


.svg)


Quick-service restaurants (QSRs) have faced headwinds in 2024, from higher costs to increased competition. But some brands are weathering the storm particularly well. We dove into the data to check in with two of the nation’s most prominent restaurant companies – Restaurant Brands International (RBI) and Yum! Brands – to see how their biggest chains, Burger King (RBI) and Taco Bell (Yum!), performed in Q3 2024.
Burger King’s “Royal Reset” Bears Fruit
Burger King, RBI’s largest restaurant chain, has been the focus of a major modernization effort, dubbed the “Royal Reset”, that includes a series of restaurant remodels and equipment and technology upgrades. Burger King has also been rightsizing – closing underperforming restaurants to shore up the chain’s overall strategic positioning.
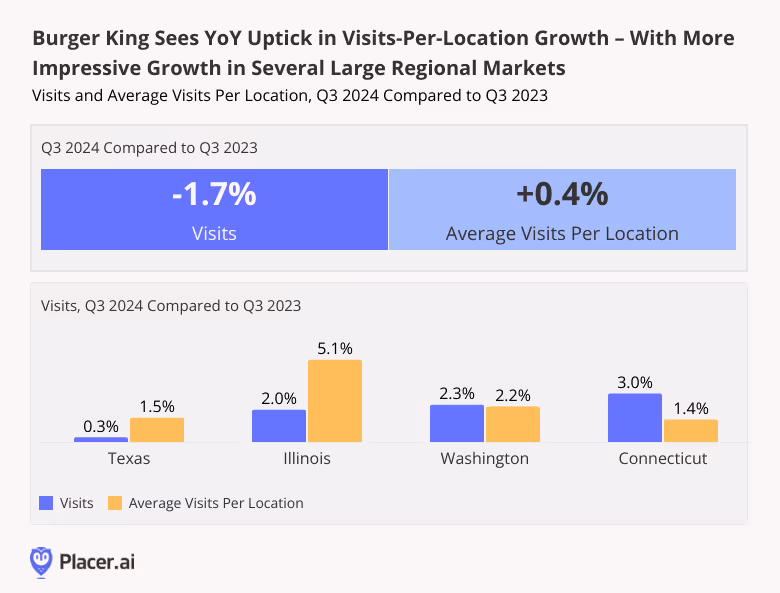
And foot traffic data shows that these initiatives are paying off. In Q3 2024, overall visits to Burger King dipped 1.7% YoY – but the average number of visits to each Burger King location increased slightly (0.4%). This per-location uptick may have been fueled, in part, by the chain’s summer “$5 Your Way” value meal special, which kept YoY visits elevated through July. And some major markets – including Texas, Illinois, Washington, and Connecticut – performed even better, with average visit-per-location growth ranging from 1.5% - 5.1% YoY.
Yum!’s Taco Bell Draws Crowds With Special Promotions
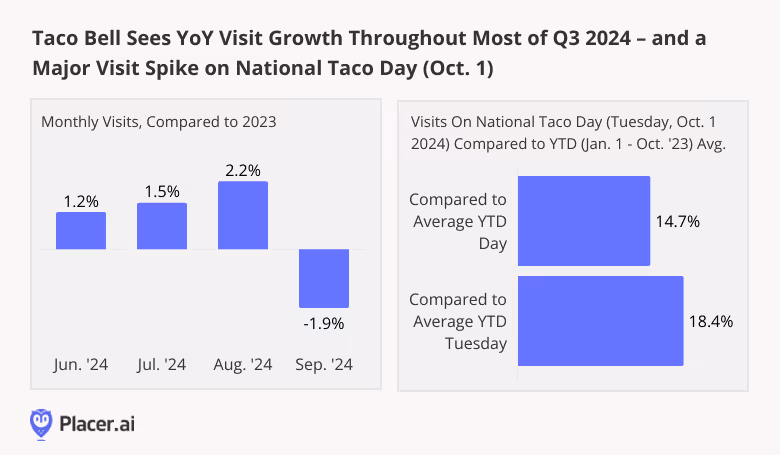
Taco Bell is Yum! Brands’ largest chain – accounting for over 70.0% of visits to the company’s U.S. restaurants in Q3 2024. And the Tex-Mex leader is another QSR that is standing strong in 2024. Throughout the summer, Taco Bell experienced YoY visit growth ranging from 1.2% to 2.2% – and though the chain saw a minor 1.9% YoY dip in September, this may be due to the month having one fewer Friday than the equivalent period of 2023. (Friday is Taco Bell’s busiest day of the week). Even accounting for this dip, visits to Taco Bell were up 0.6% YoY overall in Q3 2024.
One factor that has likely helped Taco Bell weather recent QSR storms has been its strength in executing special promotions. In July, the Tex-Mex leader attracted big crowds with a limited-time offer commemorating the 20th anniversary of the chain’s popular Baja Blast beverage. And in October 2024, the restaurant marked National Taco Day (Tuesday, October 1st) with ten hours of $1 tacos – fueling a substantial traffic spike: On the big day, visits rose 14.7% above the chain’s daily year-to-date (YTD) average, and 18.4% above the chain’s Tuesday YTD average.
A QSR Reset
Burger King and Taco Bell found success in Q3 2024 through limited-time promotions – and in the case of the former, a strategic focus on rightsizing while updating existing stores. How will RBI and Yum!’s biggest brands perform in Q4?
Follow Placer.ai’s data-driven restaurant analyses to find out.
This blog includes data from Placer.ai Data Version 2.1, which introduces a new dynamic model that stabilizes daily fluctuations in the panel, improving accuracy and alignment with external ground truth sources.

Holiday shopping creep is upon us once again. Though Black Friday is still several weeks away, a shorter holiday shopping window (just 27 days between Thanksgiving and Christmas) has many retailers more eager than ever to get the ball rolling. And with Amazon’s October Prime Big Deal Days the focus of much consumer excitement, major brick-and-mortar players like Walmart, Target, and Best Buy have launched important fall sales events of their own.
Among these pre-holiday promotions, Target’s October Circle Week stands out as a favorite, offering millions of shoppers deep discounts across a wide range of categories, from household essentials to early holiday gifts. What can location analytics tell us about how this year’s Circle Week (October 6th-12th) resonated with consumers? We dove into the data to find out.
Right on Target
Looking first at weekly year-over-year (YoY) visits to Target shows the power of this major sales event to get shoppers moving. Following a successful back-to-school shopping season, visits began to taper off in September. But during the week of October 7th, which included most of Circle Week, visits began to trend back upwards – perhaps signaling consumer responsiveness to early holiday discounts.
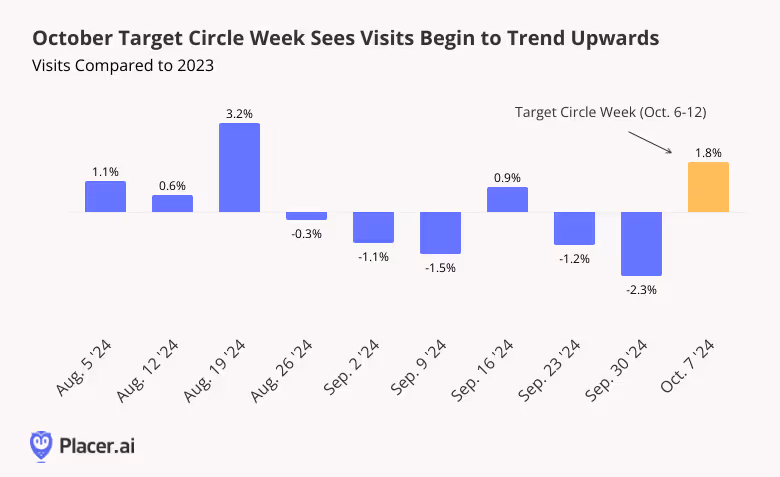
A more direct comparison between this year’s fall Target Circle Week and the one held in October 2023 (October 1st to 7th of last year) shows foot traffic up 0.7% YoY, further highlighting consumer resilience in 2024. Though the increase is a modest one, it is no small feat in a retail environment still characterized by high prices and cautious consumer sentiment.
A Nuanced Regional Story
Drilling down deeper into the data for different regions of the country paints a somewhat more nuanced picture. While in some areas of the country – particularly the Midwest and Northeast – Target Circle Week drew fewer visits this year than last (in most cases a decline of less than 3.0%), in others foot traffic increased substantially. In major southern markets like Texas and Florida, visits rose 4.2% and 3.8%, respectively. South Carolina, which has emerged as a major domestic migration hotspot in recent years, saw traffic jump an impressive 12.6%. And in California, Target’s biggest market, visits increased 1.0% YoY.

A Weekend Affair
But consumer behavior during Target Circle Week doesn’t just vary across regions – it also changes throughout the week-long sale period.
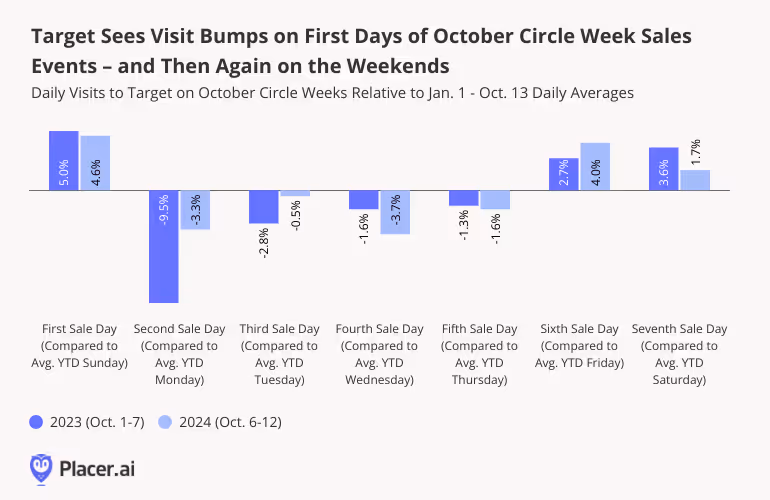
In both 2023 and 2024, Target’s October Circle Week started with a bang, as eager customers flocked to the chain to get first dibs on special sale items. Visits on launch day increased 5.0% in 2023 and 4.6% in 2024, compared to a January 1st to October 13th daily visit average. Activity then tapered off during the work week, with Monday - Thursday visits hovering just below daily visit averages for those days of the week. But on Friday and Saturday, foot traffic picked up again as shoppers utilized their time off to hit the sales.
Holidays Ahead
Early October holiday sales are quickly becoming de rigueur – and an important bellwether of overall Q4 performance. Target’s successful Circle Week this fall signals consumer resilience in the face of headwinds – though engagement levels varied throughout the country. How will the all-important Q4 continue to play out for brick-and-mortar retailers this year?
Follow Placer.ai’s data-driven retail analyses to find out.
This blog includes data from Placer.ai Data Version 2.1, which introduces a new dynamic model that stabilizes daily fluctuations in the panel, improving accuracy and alignment with external ground truth sources.

With Q3 2024 in the rearview mirror, we dove into the data to check in with two smoothie and bowl spots that are firmly in expansion mode – Playa Bowls and Tropical Smoothie Cafe. What lies behind their smashing success? And what awaits them in Q4?
We dove into the data to find out.
Smooth(ie) Sailing
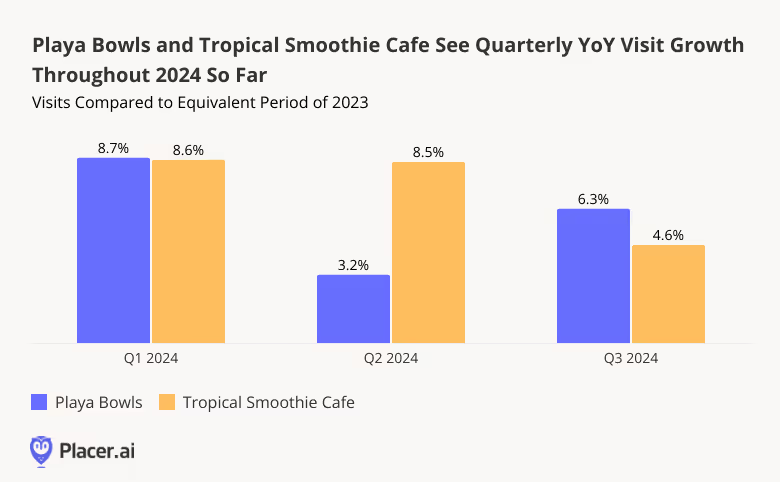
Looking first at quarterly YoY visit trends shows both Playa Bowls and Tropical Smoothie Cafe experiencing substantial year-over-year visit growth during the first three quarters of 2024 – driven in part by their rapidly growing fleets. In Q1 2024, Playa Bowls – recently acquired by Sycamore Partners – saw a YoY foot traffic jump of 8.7%. And Tropical Smoothie Cafe, acquired by Blackstone this year, saw a YoY visit boost of 8.7%. For both chains, this positive trajectory continued, though at a more moderate pace, through Q3 2024.
Juice in a Jiffy
What's behind the fast expansion and visit growth of these smoothie leaders? With high food prices still weighing on consumers, and health still top of mind for many, brands that provide nutritious, affordable indulgences are poised to win. Those that do so while meeting the rising demand for quick and convenient dining options are especially well-positioned to thrive.
And drilling down deeper into the data for Playa Bowls and Tropical Smoothie Cafe shows that the two chains’ outsize success is being fueled, in large part, by customers dropping by for a quick pick-me-up on the go, rather than a sit-down meal.
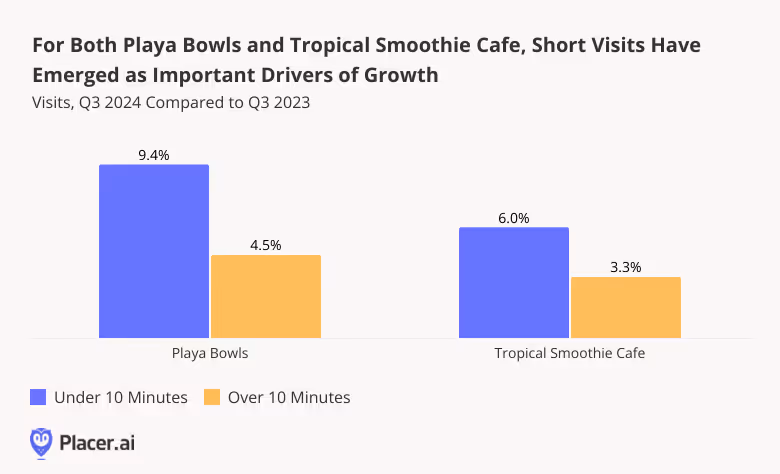
In Q3 2024, the number of short visits to Playa Bowls (i.e. those lasting less than 10 minutes) increased 9.4% YoY, while longer visits increased just 4.5%. (In Q3 2024, short visits accounted for 31.2% of visits to Playa Bowls, compared with 30.3% in Q3 2023). This suggests that robust demand for off-premises dining has emerged as a major driver of growth for the brand.
A similar trend emerged at Tropical Smoothie Cafe, where nearly half of all Q3 2024 visits (48.4%) lasted less than 10 minutes – likely due to the chain’s ubiquitous drive-thrus. Short visits to Tropical Smoothie Cafe increased 6.0% YoY in Q3, while more extended visits increased 3.3%.
Bowled Over by Offers
Playa Bowls and Tropical Smoothie Cafe have also fueled success by marking special calendar days with limited-time promotions.
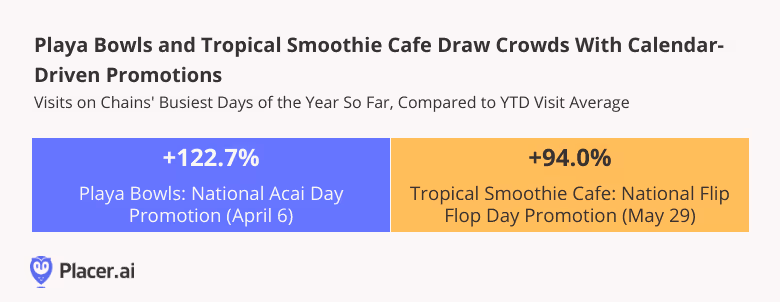
For Playa Bowls, for example, the busiest day of 2024 so far was April 6th – National Acai Day – when the juice bar offered rewards members $5 off any acai bowl. The promotion was wildly successful, fueling a remarkable 122.7% visit surge compared to a year-to-date (January to September) daily average.
For Tropical Smoothie Cafe, it was National Flip Flop Day (yes, that’s a thing) that drew major crowds this year. On May 29th, 2024, the brand marked the occasion with free Island Punch Smoothies for guests who visited participating locations while wearing flip flops. And the promotion was a hit, generating enough excitement to drive a 94.0% visit spike for the brand.
Superfruit Surge
Successful harnessing of the growing demand for convenient, healthy, and affordable off-premises dining options together with unbeatable limited-time promotions have helped propel growth for both Playa Bowls and Tropical Smoothie Cafe.
Will visits to the two chains continue to surge in the months ahead?
Follow Placer.ai’s data driven dining analyses to find out.
This blog includes data from Placer.ai Data Version 2.1, which introduces a new dynamic model that stabilizes daily fluctuations in the panel, improving accuracy and alignment with external ground truth sources.

Sprouts Farmers Market, the Phoenix, Arizona-based natural foods chain with some 419 locations across 23 states – up from 391 in July 2023 – is firmly in expansion mode. The chain reported a strong Q2 2024, including a 6.7% increase in comparable store sales.
But how did Sprouts perform in Q3? We dove into the data to find out.
Sprouting Ahead of the Pack
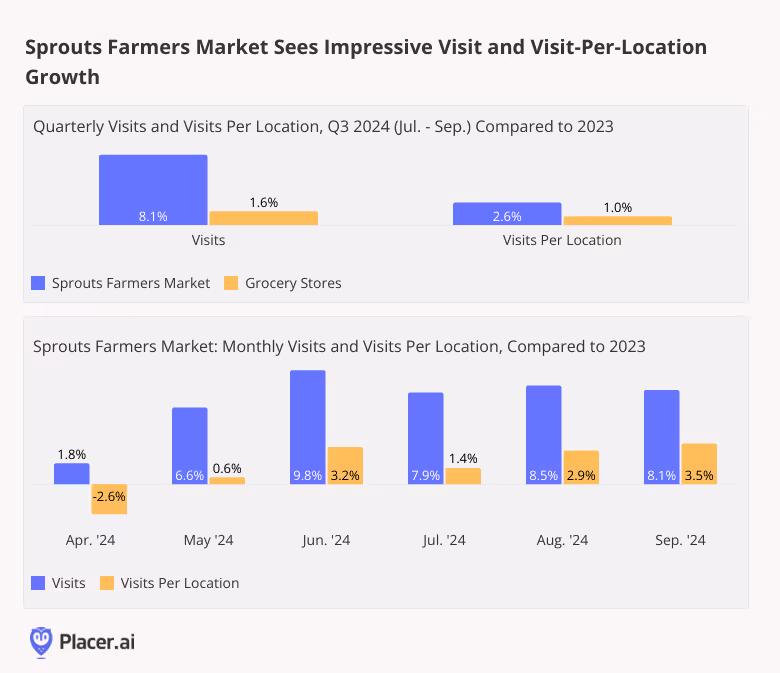
Given its rapidly-growing footprint, Sprouts’ strong year-over-year (YoY) foot traffic growth – 8.1% in Q3 2024, far above the industry average of 1.6% – may seem unremarkable. After all, a bigger fleet means more locations to contribute to the chain’s overall visit count. But for Sprouts, expansion is just part of the story. Throughout Q3 and most of Q2, the average number of visits to each of Sprouts Farmers Market’s locations also increased YoY, showing that the chain’s growing store count is meeting robust demand. And though the wider grocery space also saw a YoY uptick in visits per location, the increase was significantly lower (1.0% in Q3 for the segment as a whole, compared to 2.6% for Sprouts).
Turkey Wednesday, Here We Come!
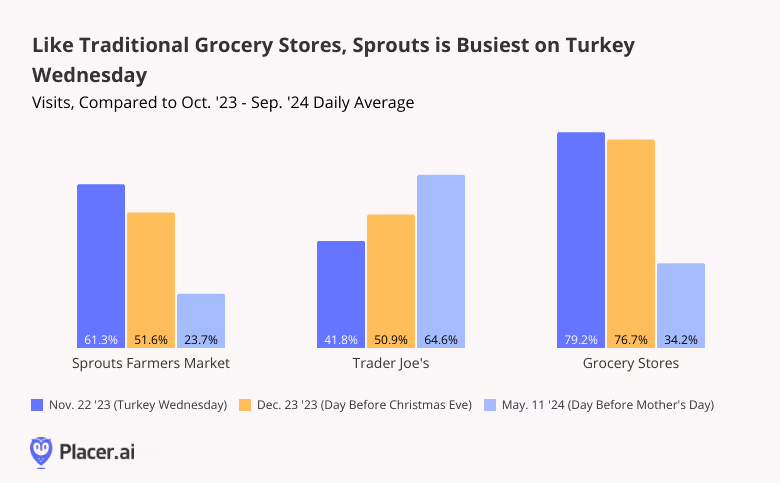
What can Sprouts expect this holiday season? In the past, location analytics have shown that while Turkey Wednesday – the day before Thanksgiving – is a major milestone for traditional grocery stores, specialty grocers like Trader Joe’s see smaller visit peaks on the big day.
But though Sprouts Farmers Market is certainly positioned as a specialty grocer, it is somewhat more akin to a traditional supermarket than key competitors like Trader Joe’s. For one thing, Sprouts boasts a wider array of merchandise than Trader Joe’s – including a huge selection of fresh, organic fruits and vegetables. And while Sprouts has been leaning heavily into its growing portfolio of private-label products, they still account for a minority of the chain’s revenue (In Q2 2024, just about 20% of Sprouts’ revenue came from private-label items – while at Trader Joe’s, some 80% of products sold are own-label.)
Perhaps as a result of these differences, consumers interact with Sprouts in some ways as they would with a traditional supermarket – including during the holidays. On November 22nd, 2023, for example (last year’s Turkey Wednesday), visits to Sprouts were up 61.3% compared to the chain’s daily average for the 12-month period ending September 30th, 2024 – making it Sprouts’ busiest day of the year by far. Though this jump was smaller than the 79.2% visit spike seen by the wider grocery store category, it was significantly larger than the 41.8% boost experienced by Trader Joe’s – which draws more traffic on the day before Mother’s Day. (December 23rd was the second-busiest day of the year for all three.)
More Families With Children, Fewer Singles
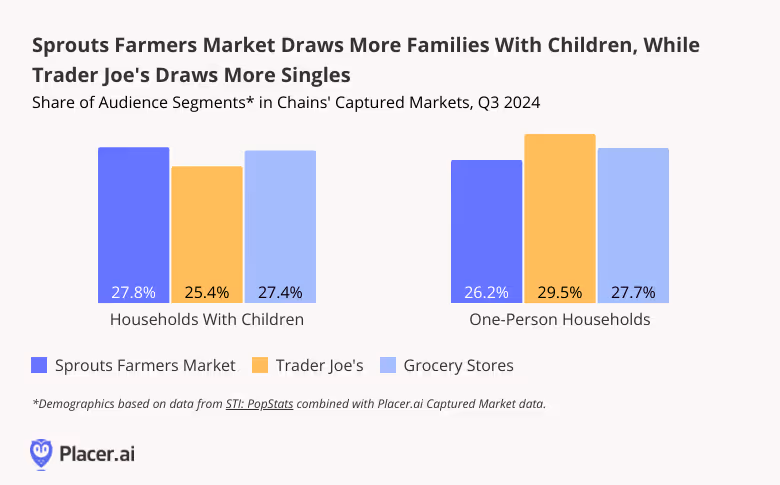
Additionally, like traditional grocery stores, Sprouts Farmers Market attracts more parental households, and fewer singles, than Trader Joe’s – another reason, perhaps, why it’s so busy on Turkey Wednesday.
Over the past twelve months, the share of families with children in Sprouts’ captured market stood at 27.8% – higher than Trader Joe’s 25.4% and in line with the industry-wide average of 27.4%. On the flip side, the share of one-person households in Sprouts’ captured market was 26.2%, lower than Trader Joe’s 29.5%, and once again more closely aligned with the somewhat-higher 27.7% observed for the grocery category as a whole. As a family-friendly chain that caters to parents on the hunt for healthy food items, Sprouts will likely be a key destination this year for households seeking to load up on ingredients for the holidays.
*Captured market analysis weights each census block group (CBG) feeding visits to the chain according to its share in the chain’s overall foot traffic – thus reflecting the profile of the chain’s actual visitor base.
Full Speed Ahead
Sprouts Farmers Market is a specialty grocer– but one that is often treated like a traditional supermarket. With stellar YoY visit and visit-per-location performance under its belt, Sprouts appears poised to be a stand-out beneficiary of both Turkey Wednesday and the day before Christmas Eve (December 23rd) this year. What else lies in store for Sprouts this year?
Follow Placer.ai’s data driven retail analyses to find out.
This blog includes data from Placer.ai Data Version 2.1, which introduces a new dynamic model that stabilizes daily fluctuations in the panel, improving accuracy and alignment with external ground truth sources.

Recovering consumer sentiment has provided a boost to restaurants in recent months – but not all dining segments are performing equally well.
We dove into the data to check in with two casual dining steakhouse chains that were recently named America’s favorite full-service restaurants – Texas Roadhouse and Darden’s LongHorn Steakhouse. How did they perform in Q3? And what are some of the factors contributing to their success?
Leading the Full-Service Pack
Since April 2024, Texas Roadhouse and LongHorn Steakhouse have both experienced consistently positive YoY foot traffic – outpacing the wider full-service restaurant space. The steakhouses’ strongest months were in May and June, when both chains traditionally draw big Mother’s Day and Father’s Day crowds. In August, too – prime vacation season – Texas Roadhouse and LongHorn Steakhouse experienced 12.5% and 9.3% YoY visit increases, respectively.
On a quarterly basis, YoY visits to Texas Roadhouse and LongHorn Steakhouse increased 5.9% and 4.0%, respectively, in Q3 2024 – while the wider FSR space saw a 2.0% decline. And though some of this growth can be attributed to the chains’ expanding footprints, the average number of visits to each chain’s individual locations also rose YoY (3.0% for Texas Roadhouse and 2.6% for LongHorn Steakhouse).
Reaping Weekday Rewards
What is the secret to these steakhouses’ success? One factor that appears to be driving growth for both restaurants is their relative affordability – especially on weekday afternoons. The cost of beef has continued to climb in recent months – and though the two chains have been forced to raise prices, they have remained committed to providing high-quality meals that don’t break the bank.
One way they’ve done so is through weekday specials that allow hungry customers to indulge as they go about their routines. Texas Roadhouse’s Early Dine Menu offers diners a variety of entrees for $8.99 to $11.99 – as long as they snag them before the dinner time rush. LongHorn Steakhouse, for its part, offers a lunchtime special on Mondays through Saturdays from 11:00 AM to 3:00 PM, including an $8.99 sandwich combo.
And foot traffic data suggests that these offerings may be helping to drive traffic to the two chains. In Q3 2024 (July to September), both Texas Roadhouse and LongHorn Steakhouse saw significantly higher weekday YoY visit growth during the afternoons – 9.7% and 8.0% respectively, compared to 6.8% and 4.3% after 6:00 PM. The accelerating return-to-office push may also be contributing to the two chains’ YoY visit growth, as commuters seek out affordable places to have lunch with colleagues.
Staking Regional Claims
Texas Roadhouse and LongHorn Steakhouse are both major national chains – with locations spread across the continental U.S. But a look at the geographic distribution of visits to the two steakhouse giants shows that each of them has a somewhat different regional focus. Though Georgia – where LongHorn Steakhouse was founded – is the brand’s second-largest market in terms of restaurant count, the Peach State garnered the highest share of visits to the chain in Q3 2024 (13.3%). Next in line was Florida, with 12.6% of visits. For Louisiana-based Texas Roadhouse, on the other hand, Texas was at the center of it all – with Florida coming in a not-so-close second.
Both chains, however, share some major markets – including Ohio (about six percent of visits to each chain) and Pennsylvania (about five percent of visits to each chain) – showing that many regional markets have plenty of room for high-quality, affordable steakhouses.
Something for Everyone – Especially in the Burbs
And a look at the demographic profiles of Texas Roadhouse and LongHorn Steakhouse’s trade areas shows that like other successful chains, both brands appeal to a wide range of audience segments. The eateries’ captured markets boast higher-than-average shares of very different suburban segments – from wealthy and upper-middle-class suburban families to suburban boomers and residents of blue collar suburbs.
Looking Ahead
Full-service restaurants still face significant hurdles in 2024 – from rising costs to discretionary spending cutbacks. The 2024 consumer prioritizes value and convenience, making it difficult for traditional sit-down eateries to compete. But the continued success of Texas Roadhouse and LongHorn Steakhouse proves that even in today’s difficult environment, FSR chains that succeed in providing affordable, high quality offerings can thrive.
Follow Placer.ai for more data-driven restaurant insights.
This blog includes data from Placer.ai Data Version 2.1, which introduces a new dynamic model that stabilizes daily fluctuations in the panel, improving accuracy and alignment with external ground truth sources.

Bowlero Corporation operates more than 350 bowling alleys nationwide, under a portfolio of brands that includes Bowlero and AMF – the company’s two largest chains. How have the bowling alleys performed this year?
We dove into the data to find out.
Summer Success
A look at year-over-year (YoY) visitation trends shows that after a January weather-induced slump and a lackluster three months between February and April 2024, YoY visits to both Bowlero and AMF Bowling Centers picked up major steam. Beginning in May, the two chains saw consistent monthly YoY visit growth ranging from 8.4% to 21.9%.
Fleet expansions undoubtedly contributed to the chains’ summer traffic jumps – but the visit increases were likely also driven by the reintroduction of Bowlero’s popular summer season pass – redeemable across the company’s portfolio of brands – which entitles customers to two free games daily at a center of their choosing. (A premium version can be used at any of the company’s locations.) The pass, which was valid from May 24th to September 2nd, proved to be such a runaway success this year that the company decided to launch a similar promotion for fall. This year’s record-breaking heat may have also contributed to the bowling alleys’ visit boosts – as consumers sought to cool down with indoor activities.

AMF: In a League of its Own
Bowlero and AMF are owned by the same company, but customers seem to interact with each brand slightly differently. Between January and August 2024, AMF attracted a higher share of frequent visitors than Bowlero – perhaps indicating the brand’s positioning as a destination for more serious bowlers and league participants.
On average, 21.4% of AMF’s visitors frequented the chain at least twice a month during the analyzed period – and 8.4% visited at least four times a month. Meanwhile, Bowlero, which touts itself as a “bowling/dining/nightlife experience,” drew smaller shares of frequent visitors – though 16.5% of Bowlero visitors turned out 2+ times a month on average during the analyzed period, and 5.7% visited at least four times a month.

Bowlero: A Family Favorite
Bowlero, which attracts more casual bowlers than AMF, is also a destination for families. Between January and August 2024, Bowlero’s captured market featured a higher-than-average share of households with children – 28.5%, compared to 26.5% for AMF and a nationwide baseline of 26.9%.
AMF, for its part, was more popular among singles: During the analyzed period, 28.6% of its captured market was made up of one-person households – more than both the nationwide baseline and that of Bowlero (26.7%).

An All-American Sport
Still, though Bowlero and AMF attract somewhat different audiences, drilling down further into the psychographic segmentation of their captured markets shows that bowling really is an all-American favorite pastime.
During the analyzed period, Bowlero’s was more likely to attract “Young Professionals” and “Near-Urban Diverse Families” – middle-class families living in and around cities – while AMF was more likely to attract upper-middle class, suburban families (“Upper-Suburban Diverse Families”) and households from “Blue Collar Suburbs”. But despite these differences, both chains attracted consumers from a variety of communities, highlighting their broad appeal.

Looking Ahead
Will consumers continue frequenting bowling alleys as the weather cools down – and will Bowlero’s autumn season pass be as successful as its summer one?
Follow Placer.ai’s data-driven analyses to find out.
This blog includes data from Placer.ai Data Version 2.1, which introduces a new dynamic model that stabilizes daily fluctuations in the panel, improving accuracy and alignment with external ground truth sources.

