


.svg)


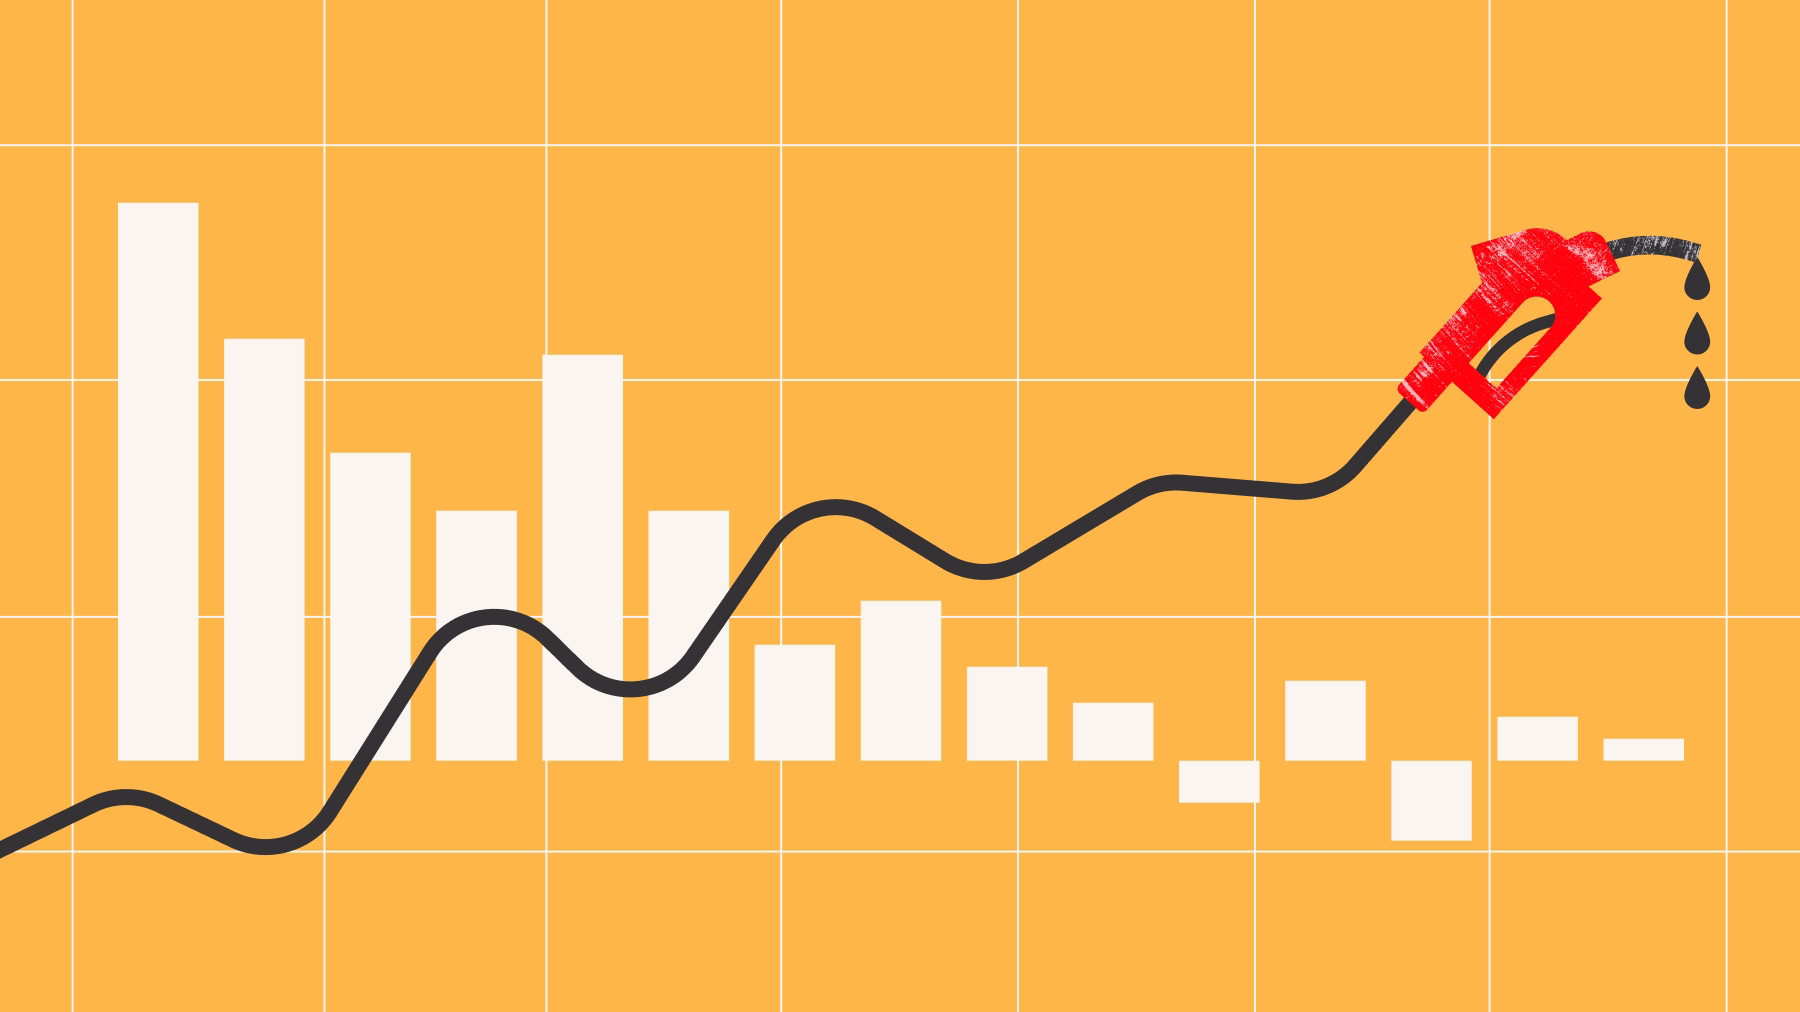
The Iran conflict and resulting supply disruptions pushed average U.S. gas prices from $2.80 per gallon in early January to $4.49 by mid-May – a nearly 60% increase. And while consumers initially appeared willing to absorb higher fuel costs, recent traffic patterns suggest that sustained pressure at the pump may finally be impacting behavior.
Consumers’ Initial Resilience
When gas prices initially began rising in early March 2026, both retail and fuel demand remained relatively resilient. As the chart below shows, discretionary retail and gas station visits hovered near or above prior-year levels – indicating that consumers were largely maintaining their shopping and driving habits. Meanwhile, non-discretionary retail traffic continued to post modest year-over-year (YoY) gains, perhaps a product of ongoing macroeconomic instability and the overall strength of essentials-based retail.
The Easter Escape
The Easter calendar shift – with the holiday falling on April 20th in 2025 and April 5th in 2026 – even provided a temporary lift across all three categories, which may have masked some of the early effects of rising fuel prices. Non-discretionary retail saw the strongest Easter impact – visits rose 10.0% YoY during the week of March 30th, 2026 – as consumers prepared for holiday gatherings. Easter-related travel also appears to have supported gas station visits, which increased 1.3% and 2.2% YoY the weeks of March 30th and April 6th, respectively. Discretionary retail benefited from the calendar shift as well, with visits increasing 5.0% YoY the week of April 6th, and 5.8% YoY the week of April 13th – likely driven by a combination of post-Easter promotions and spring break travel.
Consumers Pump the Brakes
Following a temporary Easter-related lift, location intelligence suggests that consumer behavior reached an inflection point in mid-April. The week of April 13th marked both the second consecutive week in which average gas prices exceeded $4.00 per gallon and the first week since the start of the supply disruption that gas station visits fell below year-ago levels. Since then, gas stations have experienced persistent YoY visitation declines, suggesting that consumers may be driving less or holding out between fill-ups.
Beginning the week of April 20th, discretionary retail traffic also slipped below prior-year levels – pointing to a potential pullback in non-essential shopping trips. Non-discretionary retail proved more resilient, remaining near or above the previous year’s levels from that week onward (a brief YoY visit gap the week of April 13th was likely due to the Easter calendar shift). And yet, even visits to essentials-based categories dipped below prior-year levels the week of May 18th, indicating that consumers may be shopping more deliberately or consolidating trips as transportation costs rise.
Have Consumers Reached a Fuel Price Threshold?
While consumers initially appeared willing to absorb higher fuel costs, recent foot traffic trends suggest that prolonged high prices at the pump have influenced fill-up and retail behavior across the board. However, if consumers continue to see some relief, that pressure could ease in the weeks ahead.
Want to stay informed on the latest consumer behavior trends? Visit Placer.ai/anchor.
Placer.ai leverages a panel of tens of millions of devices and utilizes machine learning to make estimations for visits to locations across the US. The data is trusted by thousands of industry leaders who leverage Placer.ai for insights into foot traffic, demographic breakdowns, retail sale predictions, migration trends, site selection, and more.
During periods of economic uncertainty and tighter consumer spending, demand for smaller indulgences often remains resilient. In beauty, this phenomenon is commonly referred to as the “lipstick effect” – the idea that consumers continue seeking affordable products that provide a sense of comfort, self-care, or reward even as discretionary budgets tighten.
Still, even this resilience doesn’t allow beauty chains to rest on their laurels. In 2025, both Ulta Beauty and Bath & Body Works introduced new corporate strategies aimed at driving their next phase of growth – but from very different starting points. Ulta is evolving from a position of relative strength, leaning into loyalty, discovery, and brand partnerships to sustain momentum. Bath & Body Works, meanwhile, is navigating a more uneven traffic recovery as it works to reduce its reliance on promotional peaks and expand engagement across digital and alternative channels.
How are those efforts resonating with consumers? And how are expanding e-commerce options impacting brick-and-mortar beauty visits? We dove into the data to find out.
Ulta’s Consistent Traffic Built on Loyalty
Ulta Beauty’s has been faring well in recent months, with positive same-store and overall traffic increasing year-over-year (YoY) in nine of the last twelve months.
That consistency may reflect the impact of Ulta Beauty Unleashed – the company’s strategy aimed at deepening customer engagement and refining in-store execution, launched just over a year ago. The initiative has helped fuel continued growth in Ulta’s loyalty ecosystem, which now boasts more than 46 million members, while also creating a flywheel effect in which greater customer participation supports Ulta’s personalization capabilities that, in turn, help drive further engagement.
Ulta’s strong loyalty infrastructure also plays a role in the retailer’s ability to offer an innovative product assortment through brand-building – another pillar of the Ulta Beauty Unleashed strategy. This approach helps Ulta sustain a sense of discovery and newness within the store environment, driving consistent traffic while also creating opportunities for outsized visit spikes. This dynamic was evident in February 2026, when the launch of the Rare Beauty partnership drove record-breaking demand and contributed to a 10.3% increase in YoY visits to the chain – marking Ulta’s largest monthly traffic gain of the past twelve months.
Bath & Body Works Through a Transition
Bath & Body Works, on the other hand, has been more reliant on promotion-driven peaks – something its leadership has been candid about since announcing its new Consumer First Formula.
Double-digit year-over-year (YoY) visit growth in July and October 2025 as well as in January 2026 aligned with periods of heightened promotional activity – including the retailer’s Semi-Annual Sales. But traffic moderated between those peaks, highlighting what management believes to be an overreliance on promotional cadences.
As Bath & Body Works CEO Daniel Heaf put it “transformations of this scale take time.” The foot traffic data suggests that the brand may still be facing near-term headwinds, with monthly YoY traffic trending down since February 2026 – although the dips may also indicate that a portion of in-store demand is shifting to e-commerce and alternate sales channels.
Bath & Body Works recently opened a new Amazon storefront, refreshed its mobile app, and lowered its free-shipping threshold, moves aimed at capturing digital demand and promoting discovery – particularly among younger consumers. And the company’s launch into campus bookstores reflects a similar effort to leverage alternative distribution channels to extend the brand’s reach and build relevance with younger consumers. These digital and alternative retail investments are designed to build longer-term engagement that could eventually translate into sustained growth for the chain.
Dwell Time Reflects Brick-and-Mortar Discovery
But even as Ulta and Bath & Body Works lean into digital and alternative channels, the brands are continuing to invest in their owned stores – and analyzing shifts in visit length for the two chains offers further insight into the role stores continue to play within each brand’s broader transformation strategy.
A Q1 comparison reveals that since 2023, more than 37% of visits to Ulta lasted over 30 minutes. The retailer has been rolling out an updated store format since 2022 – designed to promote exploration with a more intuitive category-based layout. And investments in the store experience have continued with ongoing Beauty Bar activations and events, K-Beauty World shop-in-shops, and the recent Wellness by Ulta Beauty pilot, all likely contributors to a more discovery-driven customer experience and longer dwell times.
Bath & Body Works, while seeing a smaller share of visits exceeding the 30-minute mark than Ulta, posted a significant increase in visits of that length between Q1 2025 (32.5%) and Q1 2026 (34.1%). This indicates that the Gingham+ redesign introduced in 2025 – featuring scent bars, dedicated product testing zones, and a more immersive merchandising approach – may be influencing the amount of time shoppers spend in-store.
While digital and nontraditional retail channels have become critical components of modern beauty retail strategy, the in-store experience remains a key driver of customer engagement – whether a retailer is navigating a period of transformation or working to sustain long-term growth.
Beauty’s Next Phase of Growth
The data suggests that beauty retail’s next phase of growth will depend on more than category resilience alone. Both Bath & Body Works and Ulta Beauty are investing in new ways to engage consumers – from loyalty ecosystems and digital expansion to immersive store experiences designed to encourage discovery. And while their strategies differ, both underscore a broader industry reality: even in an increasingly omnichannel environment, physical stores remain central to how beauty brands build engagement and long-term consumer loyalty.
For more data-driven retail insights, visit Placer.ai/anchor.
Placer.ai leverages a panel of tens of millions of devices and utilizes machine learning to make estimations for visits to locations across the US. The data is trusted by thousands of industry leaders who leverage Placer.ai for insights into foot traffic, demographic breakdowns, retail sale predictions, migration trends, site selection, and more.

January and February saw a modest year-over-year (YoY) uptick in visits to the DICK’s Sporting Goods banner, while March traffic softened. However, March 2026’s visit decline appears at least partially calendar-driven – the month had one fewer Saturday than the previous year – and traffic rebounded to near-flat levels in April.
Gap entered 2026 with momentum, but foot traffic softened in both March and April – perhaps reflecting the calendar shift as well as broader consumer caution and its impact on discretionary spending. Still, the traffic slowdown may be a temporary setback. Gap continues to expand into apparel-adjacent retail categories such as beauty and accessories – with new product launches in the months ahead that could help reinvigorate visits.
Meanwhile, lululemon’s North American business continues to face headwinds, as domestic performance lags behind stronger international results. Yet, the company – still searching for a new CEO – is guiding for a turnaround in the second half of 2026. Planned initiatives include new product introductions, reduced reliance on markdowns, and ongoing store expansion. Whether visit trends begin to reflect that anticipated recovery will be closely watched as the year unfolds.
For more data-driven retail insights, visit Placer.ai/anchor.
Placer.ai leverages a panel of tens of millions of devices and utilizes machine learning to make estimations for visits to locations across the US. The data is trusted by thousands of industry leaders who leverage Placer.ai for insights into foot traffic, demographic breakdowns, retail sale predictions, migration trends, site selection, and more.

Warehouse clubs continue to benefit from their strong value proposition, sustaining meaningful visit growth even amid macro uncertainty. And elevated fuel prices are adding another tailwind, driving increased traffic to wholesale club gas stations. Leveraging location intelligence, we examined recent performance for Costco, Sam’s Club, and BJ’s Wholesale Club.
A Whole Lot of Growth
Recent visit data for BJ’s, Costco, and Sam’s Club reveals how the warehouse club model continues to resonate with consumers. All three chains sustained year-over-year (YoY) visit growth over the past six months, and while growth moderated briefly in March 2026, a rebound in April suggests the slowdown was more calendar-driven than demand-driven. March 2026 included one fewer Saturday than the prior year – a small shift that can have a significant impact on time-rich retail formats.
Real estate strategy also emerged as a key factor shaping traffic trends across the three wholesalers. Costco and BJ’s both saw gains in overall visits alongside same-store growth, indicating that performance was supported by a combination of new unit expansion and growing demand at existing locations. Costco added 15 domestic warehouses in fiscal 2025 and appears on track for a similar pace in fiscal 2026, while BJ's opened seven clubs in fiscal 2025 and and is signaling a more aggressive expansion over the next two years, including its recent entry into the Dallas-Fort Worth market.
Sam's Club, by contrast, added just one new location in its fiscal 2026 (ended January 2026) while completing 14 remodels – pointing to a strategy centered on optimizing its existing footprint. This emphasis is reflected in the close alignment between overall and same-store visits, suggesting that growth is being driven primarily by improvements within the current store base. Still, Sam’s Club’s pipeline includes at least one upcoming opening, which could indicate a gradual shift toward expansion – potentially blending its optimization strategy with the unit growth that has supported momentum for its peers.
Rising Fuel Prices Drive Gas Station Traffic
Beyond the traffic inside wholesale clubs, an equally notable story is unfolding at their gas stations. As the chart below shows, visits to BJ’s Gas, Costco Gas, and Sam’s Club Fuel accelerated in early March 2026, aligning with a sharp rise in fuel prices amid the Iran War. Perhaps expectedly, this demonstrates that competitively priced fuel is a meaningful traffic driver during periods of elevated gas prices – reinforcing the value proposition of warehouse club memberships. If fuel prices remain high, members may be more inclined to consolidate shopping trips around fuel fill-ups, potentially boosting both gas station traffic and in-club spending.
Frequent Fill-Ups – An Emerging Wholesale Habit
Diving deeper into March and April visitor patterns offer further perspective into how fuel prices are influencing wholesale club member behavior. Across all three wholesale gas chains, the share of visitors who visited at least twice rose in both March and April 2026 compared to 2025.
Rising visit frequency suggests that increased traffic is not being driven by one-time responses to pricing pressure. Instead, higher fuel prices appear to be prompting members to consistently shift a greater share of their fuel spend into the wholesale ecosystem.
And more frequent fill-ups increase the likelihood that gas trips are paired with in-club shopping, suggesting that habits formed in response to pricing dynamics at the pump may ultimately drive increases in visit frequency and in-store spend.
Fuel For Thought
In the wholesale club space, core value perception is sustaining steady visit growth, while elevated fuel prices are amplifying that advantage by driving incremental traffic and frequent visits to gas stations.
In this context, wholesale fuel is transforming club-member behavior and has the potential to drive deeper, long-term engagement with the retailers as a whole.
Will these trends continue in the months ahead? Check back in with The Anchor to find out.
Placer.ai leverages a panel of tens of millions of devices and utilizes machine learning to make estimations for visits to locations across the US. The data is trusted by thousands of industry leaders who leverage Placer.ai for insights into foot traffic, demographic breakdowns, retail sale predictions, migration trends, site selection, and more.

Fast casual extended its winning streak into April 2026, while shifting visit durations across all restaurant formats point to deeper changes in how consumers are choosing to dine.
Fast Casual Keeps Its Edge
April 2026 marked another month of year-over-year (YoY) visit growth for fast casual, with traffic rising 1.9% compared to April 2025. The consistency of that trend – visible in the chart below – speaks to the ongoing strength of the segment’s value perception as consumer sentiment declines and energy costs spike – putting pressure on household budgets. Consumers continue to weigh quality and experience against price, and fast casual – sitting between the affordability of QSR and the elevated cost of full-service – keeps clearing that bar. This could also explain the slight decline in QSR visits – for the second consecutive month – which may be reflecting rising prices that are narrowing the gap with fast casual and prompting some consumers to trade up.
Full service restaurants, meanwhile, saw their visit gap improve following March's 4.8% YoY decline – which may indicate that March's dramatic decrease may have been due to calendar shifts rather than to a sharp drop in demand. (March 2025 had five Saturdays compared to March 2026's four, which likely hurt full-service's total monthly traffic last month.) The return to modest dips suggests that, while underlying demand is facing broader macro headwinds, the pressure is less severe than last month’s outsized drop implied.
A Shift Toward Mid-Length Visits
Beyond visit counts, April 2026 brought a slight shift in visit duration. Mid-length visits (10 to 30 minutes) grew their share YoY across all three segments, while the share of very short visits (under 10 minutes) declined for QSR and fast-casual and the share of longer visits (30+ minutes) fell for all three categories.
For QSR, the 10 to 30 minute visit bucket grew from 30.2% of visits in April 2025 to 31.2% in April 2026 – a meaningful shift for a segment where speed is a core value. This could reflect consumers skipping the drive-thru, and opting to park and dine-in instead, as fuel costs make idling a less economical proposition.
Fast casual visits revealed a similar pattern, as mid-length visits in the segment edged up from 34.2% in April 2025 to 35.4% in April 2026. Given that fast casual is already designed for a more relaxed dining pace than QSR, the uptick in mid-length visits might reflect a combination of factors – consumers leaning into the sit-down experience, and slightly longer wait times as the segment's sustained popularity pressures throughput.
Meanwhile, full-service visits saw a decline in the share of longer visits (30+ minutes) while the share of both short and mid-length visits increased – though longer visits still lead in overall share. Lighter checks, smaller parties, or a more purposeful approach to dining occasions could all be contributing factors.
What the Data Signals
Fast casual's sustained outperformance and the industry-wide shift toward mid-length visits both point in the same direction: consumers are engaging more selectively with dining, and the segments and brands that offer a compelling experience are pulling ahead.
For more dining insights, visit Placer.ai/anchor.
Placer.ai leverages a panel of tens of millions of devices and utilizes machine learning to make estimations for visits to locations across the US. The data is trusted by thousands of industry leaders who leverage Placer.ai for insights into foot traffic, demographic breakdowns, retail sale predictions, migration trends, site selection, and more.
%20(1).avif)
Location intelligence for Walmart and Target highlights two distinct storylines in the superstore space – one defined by sustained momentum, and the other by the early stages of a rebound.
Walmart's Consistency
Over the past several months, Walmart has recorded consistent year-over-year (YoY) visit growth, with same-store visits closely tracking overall traffic – suggesting that gains are being driven primarily by existing locations rather than new store openings. This trend aligns with the company’s previously reported transaction growth, reinforcing the strength of underlying demand and serving as a positive signal as Q2 2026 progresses.
Target's Rebound Is Real
Target, on the other hand, entered 2026 under pressure, as visits trailed prior-year levels in both November and December 2025 – partly reflecting continued softness in discretionary categories, which represent a significant portion of its business.
January 2026, however, appeared to mark the beginning of a notable shift, with both overall visits and same-store visits stabilizing. The months that followed brought a meaningful traffic rebound, indicating that February’s positive sales trends may have continued, and new CEO Michael Fiddelke’s turnaround strategy may be bearing fruit. These improvements are particularly noteworthy in light of ongoing weakness in consumer sentiment and the impact of energy price hikes.
Weekdays Are Carrying Both Brands
An analysis of visits to both brands by day of week adds further context to their recent performance. At Walmart and Target alike, weekday visits rose sharply YoY in Q1 2026 – marking a clear improvement for both retailers – while weekend visits remained essentially flat YoY.
For Target, this stabilization in weekend visits is notable, as prior declines had weighed on overall performance. This matters because weekends tend to capture more discretionary browsing and higher-margin categories that are central to Target’s model.
At the same time, with non-essential spending under pressure, growth anchored in steady weekday demand – reflecting routine, need-based shopping trips – suggests that both brands are reinforcing their roles as essential retail destinations. A measured, but steady, start to 2026.
Two Companies, Two Moments
AI-powered location intelligence indicates that Walmart continues to benefit from steady, need-based demand, while Target appears to be regaining traction after a softer period. Whether Target can build on this early momentum and translate it into sustained growth may be one of the more closely watched dynamics in the sector in the months ahead.
For updates, visit Placer.ai/anchor.
Placer.ai leverages a panel of tens of millions of devices and utilizes machine learning to make estimations for visits to locations across the US. The data is trusted by thousands of industry leaders who leverage Placer.ai for insights into foot traffic, demographic breakdowns, retail sale predictions, migration trends, site selection, and more.
Digging Into Dining
The dining industry showcased its agility over the past couple of years as it rapidly adapted to shifts in consumer preference brought on by COVID and rising prices. And with a new year around the corner, the pace of change shows no signs of slowing down.
This white paper harnesses location analytics, including visitation patterns, demographic data, and psychographic insights, to explore the trends that will shape the dining space in 2024. Which dining segments are likely to pull ahead of the pack? How are chains responding to changes in visitor behavior? And where are brands driving dining foot traffic by taking advantage of a new advertising possibility? Read on to find out how dining leaders can tap into emerging trends to stay ahead of the competition in 2024.
Stepping Up To The Plate
Comparing quarterly visits in 2023 and 2022 highlights the impact of the ongoing economic headwinds on the dining industry. The year started off strong, with year-over-year (YoY) dining visits up overall in Q1 2023 – perhaps aided by the comparison to an Omicron-impacted muted Q1 2022. And while overall dining growth stalled in Q2 2023, several segments – including QSR, Fast Casual, and Coffee – continued posting YoY visit increases, likely bolstered by consumers trading down from pricier full-service concepts.
Foot traffic slowed significantly in Q3 2023 as inflation and tighter consumer budgets constrained discretionary spending. Overall dining visits fell 2.4% YoY, and full-service restaurants – with their relatively high price point compared to other dining segments – seemed to be particularly impacted by the wider economic outlook. But the data also revealed some bright spots: Fast Casual still succeeded in maintaining positive YoY visit numbers and Coffee saw its Q3 visit grow an impressive 5.4% YoY. As the return to office continues, a pre-work coffee run or lunchtime foray to a fast-casual chain may continue propelling the two segments forward.
Shifting Demographics and Shifting Dining Behavior
Restaurant visitation patterns have evolved over the past few years. Although an 8 PM seating was once the most coveted slot at fine-dining restaurants, recent visitation data suggests that sitting down to dinner earlier is rising in popularity.
But among the QSR segment, the opposite trend is emerging, with late-night visits rising. Analyzing hourly foot traffic to several major QSR chains reveals that the share of visits between 9 PM and 12 AM increased significantly between Q3 2019 and Q3 2023. Even Taco Bell – already known for its popularity among the late-night crowd – saw a substantial increase in late-night visits YoY – from 15.4% to 20.3%.
Younger Customers Staying Out Later
Who is driving the late night visit surge? One reason restaurants have been expanding their opening hours is to capture more Gen-Z diners, who tend to seek out nighttime dining options. But location intelligence reveals that younger millennials are also taking advantage of the later QSR closing times.
An analysis of the captured market for trade areas of top locations within one of Taco Bell’s major markets – the Chicago-Naperville-Elgin, IL-IN-WI Metropolitan area – reveals a year-over-four-year (Yo4Y) increase in “Singles & Starters.” The “Singles & Starters” segment is defined by Experian: Mosaic as young singles and starter families living in cities who are typically between 25 and 30 years old. As consumers continue to prioritize experiential entertainment and going out with friends, late-night dining may continue to see increased interest from young city-dwellers.
Smoothies Drive Weekend Visits
Millennials and Gen-Z consumers aren’t only heading to their favorite fast food joint for a late-night bite – these audience segments are also helping drive visits on the weekends. Smoothie King is one chain feeling the benefits of young, health-conscious consumers.
The chain, which opened in New Orleans, LA, in 1973 as a health food store, has since grown to over 1,100 locations nationwide and is currently expanding, focusing on the Dallas-Fort Worth CBSA. The area’s Smoothie King venues have seen strong visitation patterns, particularly on the weekends – weekend visits were up 3.4% YoY in Q3 2023. The smoothie brand’s trade areas in the greater Dallas region is also seeing a YoY increase in weekend visits from “Young Professionals” – defined by the Spatial.ai PersonaLive dataset as “well-educated young professionals starting their careers in white-collar or technical jobs.”
Sports and Dining - Match Made in Heaven
While some dining chains are appealing to the late-night or weekend crowd, others are driving visits by appealing to sports lovers. How have recent rule changes around student athletes changed the restaurant game, and how can college football teams drive business in their hometowns?
Scoring Big: Leveraging Fan Insights to Fuel Successful Partnerships
College sports have long been a major moneymaker, with top-tier teams raking in billions of dollars annually. And as of 2021, college athletes can enjoy a piece of the significant fan following of college sports thanks to the change in the NCAA’s Name, Image, and Likeness (NIL) rules, which now allows student athletes to sign endorsement deals.
Since then, multiple restaurants have jumped on the opportunity to partner with student athletes, some of whom have millions of followers on Instagram and TikTok. Chains like Chipotle, Sweetgreen, Slim Chickens, and Hooters have all signed college athletes to various brand deals.
How can brands ensure they partner with athletes their customers will want to engage with? Analyzing a chain’s audience by looking at the interests of residents in a given chain’s trade area can reveal which type of athlete will be the most attractive to each brand’s customer base. For example, data from Spatial.ai: Followgraph provides insight into the social media activity of consumers in a given trade area and can highlight desirable partnerships.
Examining the trade areas of Chipotle, Sweetgreen, Slim Chickens, and Hooters, for instance, reveals that Sweetgreen’s visitors tended to have the largest share of Women’s Soccer followers. Conversely, Sweetgreen’s trade area had lower-than-average shares of College Football Fans or College Basketball Fans, while residents of the trade areas of the other three chains showed greater-than-average interest in these sports. Leveraging location intelligence can help companies choose brand deals that their customers resonate with and find the ideal athletes to represent the chain.
College Gameday - Wins for Dining
Finding the right college athlete partnership is one way for dining brands to appeal to college sports enthusiasts. But dining chains and venues located near major college stadiums also benefit from the popularity of their local team by enjoying a major game day visit boost.
One of the country’s most popular college football teams, the Ohio State Buckeyes, can draw millions of TV viewers, and its stadium has a capacity of 102,780 – one of the largest stadiums in the country. And while tailgating is a popular activity for Buckeyes fans, nearby restaurants are some of the biggest beneficiaries of the college football craze. Panera experienced a 235.3% increase on game days as compared to a typical day, Domino’s Pizza visits grew by 283.3%, and Tommy’s Pizza, a local pie shop, saw its visits jump by a whopping 600.9%.
Game Day Visitor Spikes
This influx in diners also causes a major shift in game day visitor demographics, as revealed by changes in visitors at dining venues located near stadiums of two of the nation’s best college football teams – the Ohio State Buckeyes and Ole Miss Rebels. Based on Spatial.ai: Personalive data for the captured market of these dining venues, game day visitors tended to come from “Ultra Wealthy Families” when compared to visitors during a typical non-game day in September or October.
The analysis indicates that popular sporting events create a unique opportunity for restaurants near college stadiums to attract high-income customers game day after game day, year after year.
Subwars: Room for Everyone
While some spend game day tailgating or visiting a college restaurant, others hold a viewing party – with a six-foot submarine. And the sub’s popularity extends beyond Superbowl Sundays. Sandwich chains including Jersey Mike’s, Firehouse Subs, Jimmy John’s, and Subway (recently purchased by the same company that owns Jimmy John’s) have seen sustained YoY increases in visits and visits per venue in the first three quarters of 2023.
Some of the growth to these chains may be related to their affordability, a draw at all times but especially during a period marked by consumer uncertainty and rising food costs. And subway leaders seem to be seizing the moment and striking while the iron is hot – Jersey Mike’s opened 350 stores in 2023 and still saw its YoY visits per venue grow by 6.6%. And Subway reported ten consecutive quarters of positive sales, a promising sign for its new owner.
Sandwich Chains Attract a Wide Consumer Base
The love for a healthy, affordable sandwich extends across all income levels, with all four chains seeing a range in their visitors' median household income (HHI). Out of the four chains analyzed, Jersey Mike’s – which has long prioritized a suburban, middle-income customer – had the highest trade area median household income of the four chains at $77.3K/year. Subway, known for its affordability, had the lowest, with $62.9K/year. The variance in median HHI combined with the strong foot traffic growth shows that when it comes to sandwiches, there’s something for everyone.
So What’s The Dining Space Cooking Up?
Persistent inflation and declining consumer sentiment may pose serious challenges for the dining space, but emerging trends are helping boost some restaurants. Customers seeking out a late-night bite drive visits to QSR chains, and health-conscious diners are boosting foot traffic to smoothie bars and sandwich shops. Meanwhile, sports sponsorships and game-day restaurant visits can provide a boost to dining businesses that take advantage of these opportunities.

