


.svg)


In 2024, auto parts retailers are continuing to see visit growth compared to last year. We dove into the data for three of the industry’s leaders – AutoZone, O’Reilly Auto Parts, and NAPA Auto Parts – to explore the consumer behavior and profiles behind the space’s ongoing success.
Visits Revving Up
Auto parts retail visits have been bolstered in recent months by still-high vehicle prices – which have incentivized many cash-strapped consumers to fix up the car they have rather than buy a new one. To be sure, the industry hasn’t been entirely spared the effects of inflation, which has caused many consumers to tighten their (seat)belts and defer non-essential car repairs. Still, one of the key factors benefiting the space has been the greater prevalence of older vehicles on the road, which are more likely to need significant – and essential – maintenance.
Since the start of 2024, AutoZone and O’Reilly have sustained consistent year-over-year (YoY) monthly visit growth. And though NAPA saw mild visit gaps in March, June, and August – coinciding with traffic fall-off to some of the repair shops it supplies – it too experienced YoY increases throughout most of the analyzed period.
As auto parts inflation continues to wane in 2024, more consumers may begin taking on repairs they postponed last year, providing these retailers with continued foot traffic boosts.
Repair or Replace?
Less affluent consumers are more likely to be deterred from buying a new ride by high prices and interest rates. And analyzing the demographic characteristics of visitors to AutoZone, O’Reilly, and NAPA reveals that in H1 2024, the median household incomes (HHIs) of the chains’ captured markets were indeed significantly lower than those of new car dealerships ($75.6K).
The data reveals a divide between consumers in the market for new cars – who generally have higher income levels – and those that frequent auto parts retailers to invest in their current set of wheels. And consumers seeking to repair rather than replace may be even more inclined to do so while vehicle prices and financing costs remain elevated.
DIY the Ride
Analysis of consumer spending habits provides a further indication that AutoZone, O’Reilly and NAPA’s audiences are more likely to invest in upgrades and repairs than in the purchase of a new vehicle.
In H1 2024, residents of AutoZone and O’Reilly’s captured markets spent 17% less annually on buying used cars than the nationwide average, while residents of NAPA’s captured market spent 14% less.
And residents of all three auto parts retailers’ trade areas spent even less on new car buying. In H1 2024, AutoZone’s captured market spent 23% less on new cars than the nationwide average, and O’Reilly’s and NAPA’s captured markets spent 22% and 18% less, respectively.
AutoZone and O’Reilly’s relatively large share of DIY consumers – those who repair or upgrade their cars on their own to save money – likely contributed to their trade areas’ smaller car buying expenditures. Meanwhile, the slightly larger spend on both new and used cars in NAPA’s trade area – though still significantly lower than the nationwide average – may be due to the retailer’s predominantly commercial business.
No Stalling
Auto parts chains have been riding strong tailwinds on the road to success – and they appear geared up for more foot traffic success in the homestretch of 2024. As more older vehicles stay on the road and car-buying costs remain high, robust demand for parts is likely to continue.
Will the auto parts industry accelerate even further in the months to come? Visit Placer.ai to find out.
This blog includes data from Placer.ai Data Version 2.1, which introduces a new dynamic model that stabilizes daily fluctuations in the panel, improving accuracy and alignment with external ground truth sources.

The last several years have seen many Americans relocate to states like Texas, Florida, Montana, and Maine. We checked in with another region of the country that’s become a domestic migration hotspot in recent years – South Carolina – to explore what’s attracting movers to the state.
Carolina Calling
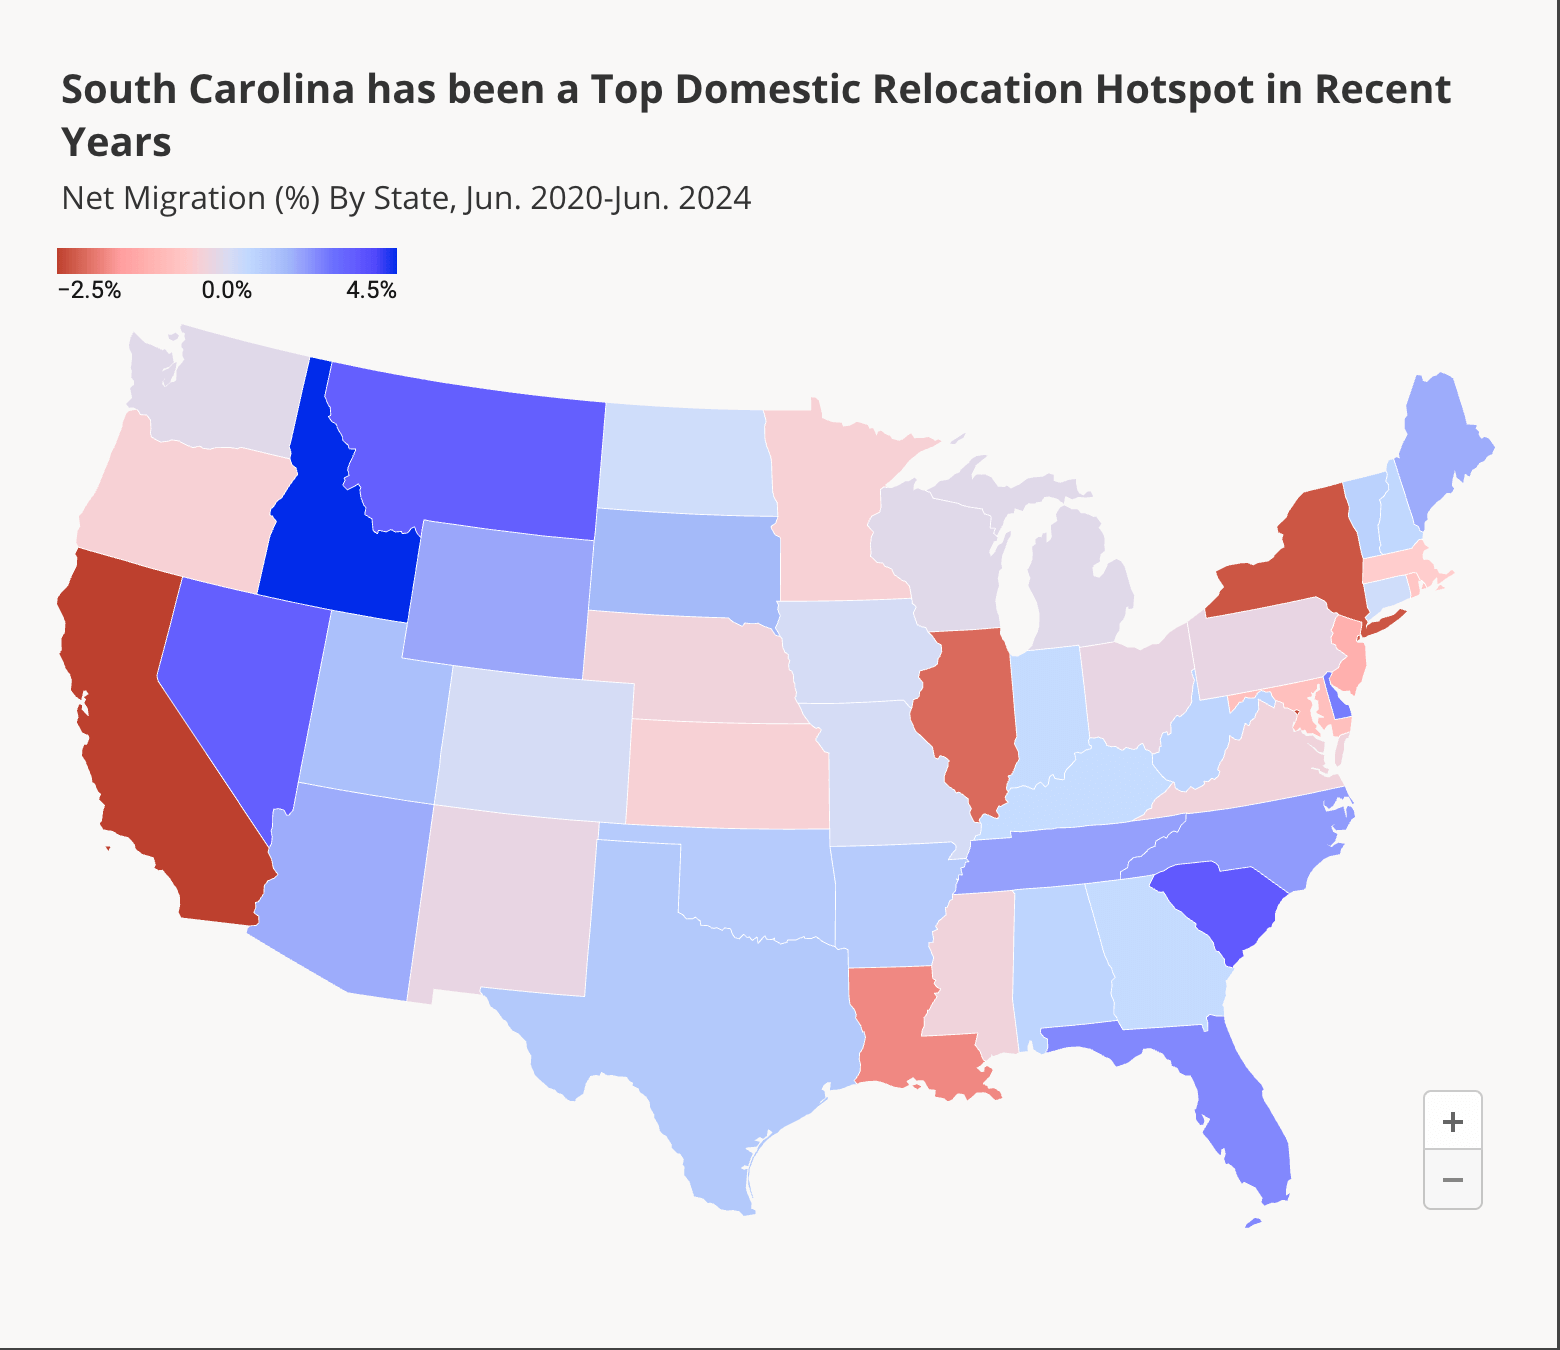
Analyzing domestic migration trends throughout the United States between June 2020 and June 2024 reveals several regions of the country that have attracted new residents over the past four years. Idaho led the charge with positive domestic net migration of 4.5%, meaning that the total number of people that moved to Idaho from elsewhere in the U.S., minus those that left, constituted 4.5% of the state’s June 2024 population.
And South Carolina – with a thriving economy, a robust job market, and plenty of affordable living – came in a close second, with a net domestic migration increase of 3.5%. Several other Southeastern states also saw a net inflow of relocators – including Tennessee (2.0%), Alabama (0.7%), Georgia (0.5%), Florida (2.4%), and North Carolina (2.1%).
The Coast with the Most
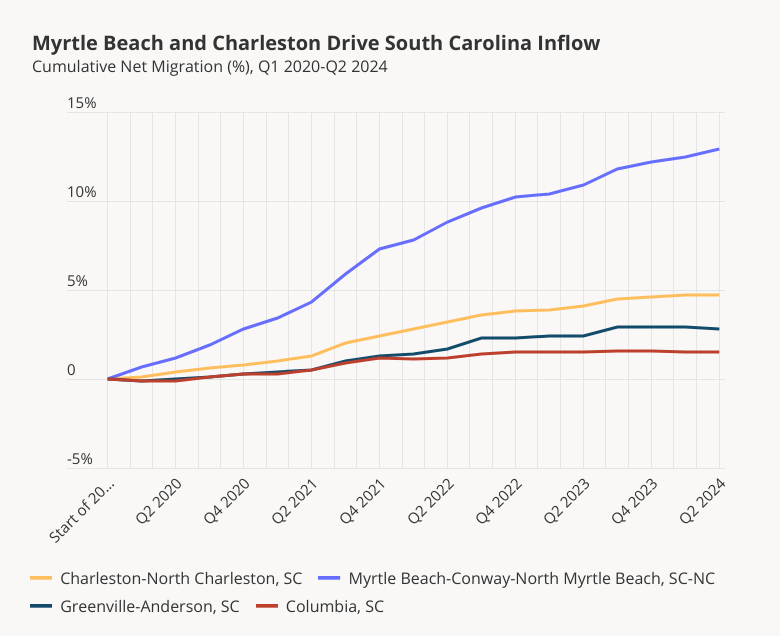
To uncover local trends driving South Carolina’s net migration growth we analyzed the quarterly cumulative migration to several of the state’s largest CBSAs, focusing on the period between Q1 2020 and Q2 2024.
Of the CBSAs analyzed, Myrtle Beach-Conway-North Myrtle Beach saw the most significant influx of new residents – with a whopping 12.9% cumulative net migration as of Q2 2024. With a low cost of living, a vibrant job market, and plenty of access to the outdoors, it may come as no surprise that Myrtle Beach has become the nation’s fastest-growing city and most popular relocation hotspot. The CBSA is also home to The Grand Strand – a collection of unique communities spanning 60 miles of pristine beaches.
The Charleston-North Charleston metro area also experienced substantial cumulative migration between early 2020 and Q2 2024 (4.7%). The CBSA’s primary municipality, Charleston, has been acclaimed as a top destination for relocators, due in part to its rich history, culture, and sense of community. And like Myrtle Beach, Charleston is also on the coast.
Urban on The Up
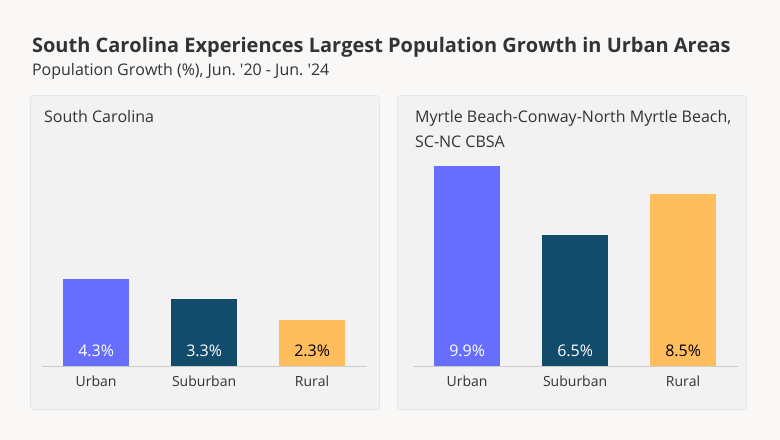
And diving deeper into population growth patterns in South Carolina’s Myrtle Beach-Conway-North Myrtle Beach metro area showcases the unique lifestyle that is attracting many new residents. In many regions of the country, suburban areas are experiencing the most substantial population growth. But in Myrtle Beach – and in South Carolina more generally – it is urban areas that are on the rise.
Between June 2020 and June 2024, South Carolina’s urban population grew by 4.3%, compared to 3.3% for suburban communities, and 2.3% for rural ones. Over the same period, urban areas in the Myrtle Beach-Conway-North Myrtle Beach metro area saw a remarkable 9.9% population increase, likely driven by the popularity of hubs like Myrtle Beach and North Myrtle Beach – coveted by lovers of the year-round beach lifestyle. Still, the CBSA’s suburban and rural communities also experienced significant population growth, outperforming statewide baselines.
Moving On
South Carolina is home to several metro areas seeing positive net migration, and its coastline is one of the most popular regions for new residents. Will these areas continue to see population growth? Which other parts of the country are popular for those taking on relocation?
Visit Placer.ai to find out.

Discount and Dollar Stores as a whole had resounding success in Q2 2024. We dove into the data for Five Below and Ollie’s Bargain Outlet to take a closer look at what’s driving the recent foot traffic gains to these discount chains.
Expansion Continues to Drive Growth
Five Below and Ollie’s have been on a growth trajectory for quite some time. In 2023, Five Below opened a company-record 205 new stores, and in fiscal Q1 2024 opened another 61 locations. Ollie’s grew its real estate footprint by 45 locations in 2023 and added 4 new stores in fiscal Q1 2024.
Ollie and Five Below’s visit growth has at least partly been fueled by their growing fleets. In Q2 2024 (April-May), Five Below and Ollie’s saw YoY visit increases of 14.0% and 17.1%, respectively.
And while both brands have plans to continue their physical-world expansions in the near future, a robust digital and social media presence also appears to be part of both Ollie’s and Five Below’s long-term strategies.

Visitor Frequency On the Rise
An examination of changes in visitor engagement with these two chains indicates that increasing consumer loyalty has been a significant factor for both Five Below and Ollie’s in recent years.
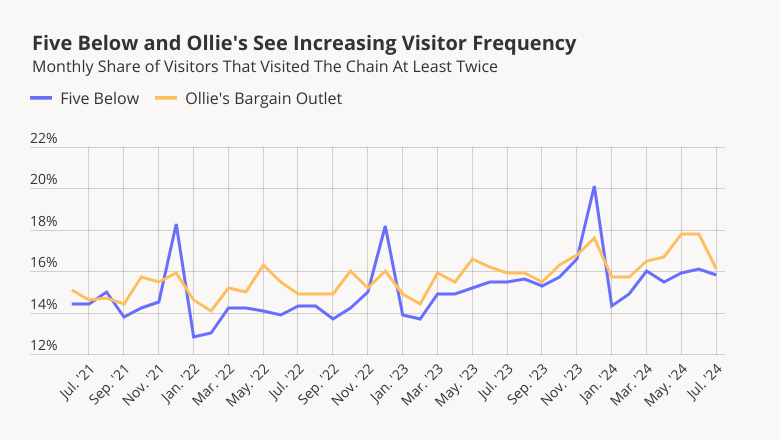
Five Below’s focus on recreational items appears to be a key driver of visitor frequency and visits – especially during the holidays. And visitor frequency is on the rise for the chain. In December 2021 and 2022, the share of visitors that visited Five Below at least twice during the month peaked at 18.3% and 18.2%, respectively. But in December 2023, the share of Five Below’s repeat visitors climbed to 20.1%. This could be due in part to the company’s doubling down on the Five Beyond store-in-store concept, which offers merchandise beyond the chain’s traditional $5 price-ceiling – broadening their offerings and enhancing the treasure-hunting experience. With the addition of a loyalty program next year, Five Below could expect to see an even greater share of frequent visitors.
Meanwhile, Ollie’s closeout business model and recruitment of consumers into its “army” likely encourage frequent visitation to the chain throughout the year. And still-high prices appear to have consumers visiting Ollie’s more often than in previous years, perhaps as they keep their eyes out for bargains on everyday items and home goods to help stretch their dollars.
Discounts Applied at Checkout
Visits to Five Below and Ollie’s remain elevated as consumers appear hungry-as-ever for bargains on items that excite and fill everyday needs. Will foot traffic to these retailers remain strong through the second half of 2024?
Visit Placer.ai to find out.
Discount & dollar stores had a strong Q2 2024, as consumers continued to prioritize value amid persistent high prices. We dove into the data for category leaders Dollar General and Dollar Tree to take a closer look at the drivers of these chains’ most recent success.
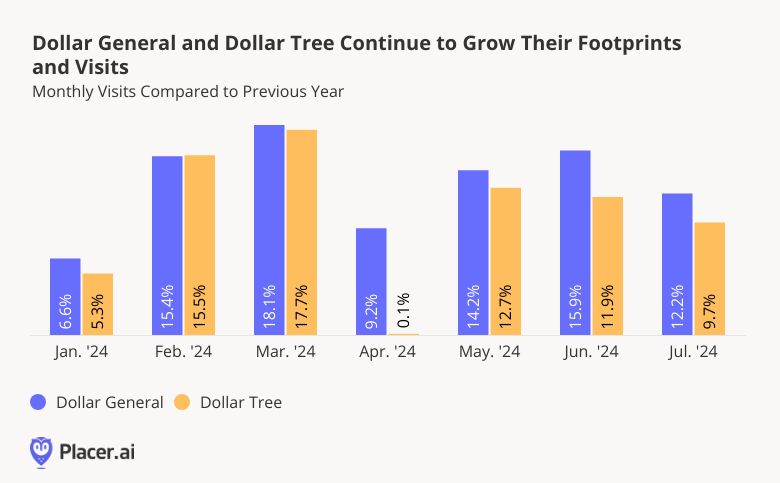
Dollar General and Dollar Tree Continue to Grow
Dollar General – the nation’s largest dollar store player – opened nearly 200 stores last quarter, surpassing 20,000 U.S. locations. And Dollar Tree, the second-biggest dollar store chain by real estate footprint, stands at over 8,300 locations, including more than 100 new additions in the first months of 2024.
These chains’ significant fleet expansions continue to fuel foot traffic growth. Both Dollar General and Dollar Tree saw consistently positive YoY visit growth during the first seven months of 2024. Only in April 2024 did Dollar Tree’s YoY foot traffic appear to falter, likely as a result of decreased YoY demand for its traditional holiday merch due to an Easter calendar shift.
On a quarterly basis, YoY visits to Dollar General and Dollar Tree in Q2 2024 rose 13.1% and 8.4%, respectively. Over the same period, the two chains also experienced YoY increases in the average number of visits to each of their locations (10.3% for Dollar General and 3.7% for Dollar Tree), indicating that visits to individual stores remained robust as the brands grew.
And both brands plan on continuing to expand in the near future. Dollar General expects to open a total of 730 new stores in 2024, while Dollar Tree announced the takeover of 170 99 Cents Only Stores to complement the banner’s other openings. These strategic initiatives should continue to drive foot traffic gains for both brands in the coming months.
More Visitors, More Often
What’s behind Dollar General and Dollar Tree’s visit success? A look at changes in visitor interaction with the two chains suggests that for both dollar leaders, rising customer loyalty has played an important role.
Since July 2022, the share of visitors frequenting the two brands on a regular basis has been on an upward trajectory. In July 2024, 35.5% of Dollar General visitors frequented the chain at least three times during the month – up from 34.1% in July 2022. This increase in visitor frequency may be due in part to Dollar General’s inroads into the grocery space – giving consumers even more of a reason to visit the chain for daily essentials on a regular basis.
And though Dollar Tree’s somewhat more modest fleet drives a slightly smaller share of repeat visitors, it too has seen an increase in frequent visitors while investing in diversified offerings at various price-points – including consumables. In July 2024, 16.6% of Dollar Tree’s visitors also visited the chain at least three times, up from 13.9% in July 2022.
For both chains, visitor frequency is driven in part by seasonality, with loyalty upticks in December and May, likely driven by holiday season and Mother’s Day shoppers. Still, Dollar Tree, which remains a more traditional dollar store than Dollar General, experiences more dramatic seasonal visit peaks than its prime competitor – and its loyalty also follows a more pronounced seasonal pattern.

How Far Can A Dollar Take Us?
With the biggest players in the discount & dollar category seemingly going strong, will the second half of 2024 bring even more success to this retail space?
Visit Placer.ai to find out.

Midway through 2024, foot traffic to Lowe’s and Home Depot – the leaders in the home improvement space – is climbing. What’s driving these retailers’ recent visit growth? We dove into the data to find out.
New Homes, New Projects
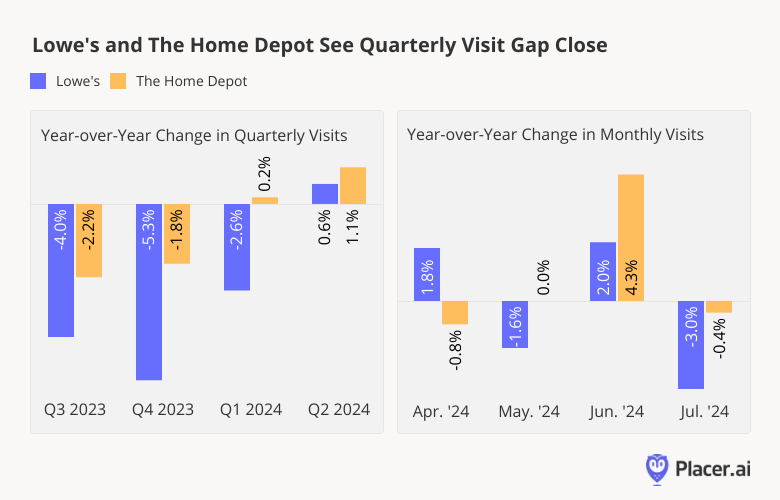
After a meteoric rise in foot traffic during the pandemic, the home improvement segment has experienced a turbulent few years – one of the primary reasons being a cool housing market that has curbed demand for projects. But after a significant period of consistent YoY visit gaps, visits to Lowe’s and Home Depot in 2024 appear to be matching and even slightly surpassing 2023 levels.
Between Q3 2023 and Q2 2024, Lowe’s and Home Depot both saw their YoY visit gaps gradually narrow and then close – finishing out Q2 with modest YoY gains. This turnaround may have been partly due to modest lifts in new home sales at the start of 2024 compared to 2023 – spurring an uptick in home improvement projects in the following months.
And though YoY visits to both retailers experienced a decline in July 2024 – perhaps due to May and June’s YoY declines in new and existing home sales – recent indications that the housing market may be heating up may bode well for the home improvement category in the second half of 2024 and beyond.
Cross Shopping Signals Larger Projects Are Back On
In addition to an increase in YoY visits, the resurgence of cross-shopping behavior between Home Depot and Lowe’s further suggests that a turnaround may be unfolding in the home improvement space. Location analytics shows that during recent home improvement booms, cross shopping between the two retailers was common, perhaps as judicious consumers taking on large projects looked to explore their options.
In Q2 of 2020 and 2021 – periods of strong foot traffic for both retailers – a large share of Lowe’s visitors also visited Home Depot. And although Lowe’s maintains a smaller retail footprint than Home Depot, many of Home Depot’s visitors visited a Lowe’s store as well.
But in the years that followed, economic headwinds led many consumers to defer their projects, and cross-shopping behavior began to moderate. In Q2 2023, only 48.8% of visitors to Lowe’s also visited Home Depot, and just 44.8% of Home Depot’s visitors visited Lowe’s.
However, in Q2 2024, consumers’ home improvement cross-shopping showed signs of a potential change of course. During the period, cross shopping between the brands climbed to 51.5% for Lowe’s and 45.7% for Home Depot. A return to in-store comparison shopping could mean that consumers are again taking on higher-stakes home improvement projects, which justify a visit to both retailers.

Engineering a Comeback
After an extended period of YoY visit gaps, foot traffic to the home improvement leaders is on the rise. Will Lowe’s and Home Depot continue to build on these positive visitation trends?
Visit Placer.ai to find out.

Summer is a time when many consumers are on the go – and vacationers moving between activities look to quick-service restaurants (QSR) and fast-casual chains to fill up and beat the heat.
We checked in with McDonald’s, Wendy’s, Wingstop, and Shake Shack to see how they are performing heading into the summer, and examined location analytics for McDonald’s latest concept – CosMc’s – to uncover emerging visitation trends for the new chain.
Key Takeaways
- In Q2 2024, Wingstop and Shack Shack saw respective year-over-year (YoY) visit growth of 31.9% and 28.3% – driven in part by the chains’ aggressive expansion strategies.
- Also in Q2 2024, McDonald’s visits grew by 0.4% YoY and Wendy’s grew by 1.4%.
- McDonald’s new CosMc’s restaurant draws higher-income consumers than the traditional McDonald’s chain – helping McDonald’s attract new audiences.
Wingstop and Shake Shack Sizzle in Summer
Popular wing and burger destinations Wingstop and Shake Shack are thriving this summer, as both chains double down on expansion plans. Shake Shack is on track to add dozens of new locations to its 300+ domestic shacks in 2024, and Wingstop’s hundreds of newly added locations bring its U.S. restaurant count to nearly 2000 venues.
These aggressive expansion strategies are playing a significant role in the chains’ respective visit growth. In June 2024, Wingstop’s visits were up 34.2% YoY, while Shake Shack’s were up 28.1%.
As the chains expand their footprints, both are taking steps to increase store efficiency and improve service. Wingstop recently adopted a new in-house transaction software, while Shack Shack continues to streamline the kiosk ordering experience.
.png)
Value on the Fast-Food Menu
The experience at many eateries continues to change – as do the prices diners see on their menus. During the first months of 2024, inflation drove price increases across the QSR space. And as consumers took note of the higher prices, “the summer of value wars” got underway – with a long list of chains, including fast-food giants McDonald’s and Wendy’s, introducing low-cost meals and menus to reel in inflation-wary diners.
Despite price hikes felt by consumers, in Q2 2024, McDonald’s visits grew by 0.4% YoY and Wendy’s grew by 1.4%. And the late-June launch of McDonald’s and Wendy’s new limited-time $5 bundles – which are already making their impact felt on the ground – may drive further foot traffic growth for the two chains throughout the summer.
.png)
CosMc’s Draws Higher-Income Visitors into McDonald’s Orbit
While many fast-food diners are looking for value this summer, they’re also proving eager to try new culinary experiences. McDonald’s spin-off restaurant CosMc’s landed in late 2023, with throngs of eager diners lining up for a taste of the unique concept. Since the first location opened in Bolingbrook, IL, several new CosMc’s have emerged to heavy fanfare, including one in Watauga, TX and another in Dallas.
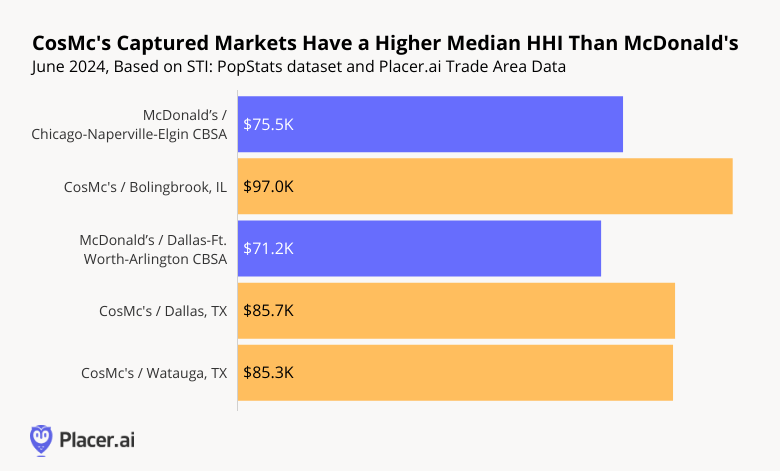
And although CosMc’s is still in its infancy, location analytics shows that the concept already drives traffic from more affluent consumers than the traditional McDonald’s chain.
In June 2024, for example, the median household income (HHI) in the captured market of the Bolingbrook, IL CosMc’s was $97.0K – significantly higher than that of McDonald’s in the Chicago metro area ($75.5K) or of McDonald’s nationwide ($65K).
A similar trend could be observed in the Dallas-Ft. Worth-Arlington CBSA – where the captured markets of local CosMc’s featured significantly higher median HHIs than those of McDonald’s.
As a beverage-led concept, CosMc’s may drive more traffic from higher-income consumers than a traditional McDonald’s – where simple soft drinks typically come as an inexpensive meal add-on. And as a result, the chain may help McDonald’s bring a new consumer cohort into the fold.
Looking Ahead
Summer 2024 is undoubtedly shaping up to be the “Summer of Value” and perhaps the “Summer of Fast Food” as well. Will favorable trends continue in the months ahead?
Visit Placer.ai to find out.
Digging Into Dining
The dining industry showcased its agility over the past couple of years as it rapidly adapted to shifts in consumer preference brought on by COVID and rising prices. And with a new year around the corner, the pace of change shows no signs of slowing down.
This white paper harnesses location analytics, including visitation patterns, demographic data, and psychographic insights, to explore the trends that will shape the dining space in 2024. Which dining segments are likely to pull ahead of the pack? How are chains responding to changes in visitor behavior? And where are brands driving dining foot traffic by taking advantage of a new advertising possibility? Read on to find out how dining leaders can tap into emerging trends to stay ahead of the competition in 2024.
Stepping Up To The Plate
Comparing quarterly visits in 2023 and 2022 highlights the impact of the ongoing economic headwinds on the dining industry. The year started off strong, with year-over-year (YoY) dining visits up overall in Q1 2023 – perhaps aided by the comparison to an Omicron-impacted muted Q1 2022. And while overall dining growth stalled in Q2 2023, several segments – including QSR, Fast Casual, and Coffee – continued posting YoY visit increases, likely bolstered by consumers trading down from pricier full-service concepts.
Foot traffic slowed significantly in Q3 2023 as inflation and tighter consumer budgets constrained discretionary spending. Overall dining visits fell 2.4% YoY, and full-service restaurants – with their relatively high price point compared to other dining segments – seemed to be particularly impacted by the wider economic outlook. But the data also revealed some bright spots: Fast Casual still succeeded in maintaining positive YoY visit numbers and Coffee saw its Q3 visit grow an impressive 5.4% YoY. As the return to office continues, a pre-work coffee run or lunchtime foray to a fast-casual chain may continue propelling the two segments forward.
Shifting Demographics and Shifting Dining Behavior
Restaurant visitation patterns have evolved over the past few years. Although an 8 PM seating was once the most coveted slot at fine-dining restaurants, recent visitation data suggests that sitting down to dinner earlier is rising in popularity.
But among the QSR segment, the opposite trend is emerging, with late-night visits rising. Analyzing hourly foot traffic to several major QSR chains reveals that the share of visits between 9 PM and 12 AM increased significantly between Q3 2019 and Q3 2023. Even Taco Bell – already known for its popularity among the late-night crowd – saw a substantial increase in late-night visits YoY – from 15.4% to 20.3%.
Younger Customers Staying Out Later
Who is driving the late night visit surge? One reason restaurants have been expanding their opening hours is to capture more Gen-Z diners, who tend to seek out nighttime dining options. But location intelligence reveals that younger millennials are also taking advantage of the later QSR closing times.
An analysis of the captured market for trade areas of top locations within one of Taco Bell’s major markets – the Chicago-Naperville-Elgin, IL-IN-WI Metropolitan area – reveals a year-over-four-year (Yo4Y) increase in “Singles & Starters.” The “Singles & Starters” segment is defined by Experian: Mosaic as young singles and starter families living in cities who are typically between 25 and 30 years old. As consumers continue to prioritize experiential entertainment and going out with friends, late-night dining may continue to see increased interest from young city-dwellers.
Smoothies Drive Weekend Visits
Millennials and Gen-Z consumers aren’t only heading to their favorite fast food joint for a late-night bite – these audience segments are also helping drive visits on the weekends. Smoothie King is one chain feeling the benefits of young, health-conscious consumers.
The chain, which opened in New Orleans, LA, in 1973 as a health food store, has since grown to over 1,100 locations nationwide and is currently expanding, focusing on the Dallas-Fort Worth CBSA. The area’s Smoothie King venues have seen strong visitation patterns, particularly on the weekends – weekend visits were up 3.4% YoY in Q3 2023. The smoothie brand’s trade areas in the greater Dallas region is also seeing a YoY increase in weekend visits from “Young Professionals” – defined by the Spatial.ai PersonaLive dataset as “well-educated young professionals starting their careers in white-collar or technical jobs.”
Sports and Dining - Match Made in Heaven
While some dining chains are appealing to the late-night or weekend crowd, others are driving visits by appealing to sports lovers. How have recent rule changes around student athletes changed the restaurant game, and how can college football teams drive business in their hometowns?
Scoring Big: Leveraging Fan Insights to Fuel Successful Partnerships
College sports have long been a major moneymaker, with top-tier teams raking in billions of dollars annually. And as of 2021, college athletes can enjoy a piece of the significant fan following of college sports thanks to the change in the NCAA’s Name, Image, and Likeness (NIL) rules, which now allows student athletes to sign endorsement deals.
Since then, multiple restaurants have jumped on the opportunity to partner with student athletes, some of whom have millions of followers on Instagram and TikTok. Chains like Chipotle, Sweetgreen, Slim Chickens, and Hooters have all signed college athletes to various brand deals.
How can brands ensure they partner with athletes their customers will want to engage with? Analyzing a chain’s audience by looking at the interests of residents in a given chain’s trade area can reveal which type of athlete will be the most attractive to each brand’s customer base. For example, data from Spatial.ai: Followgraph provides insight into the social media activity of consumers in a given trade area and can highlight desirable partnerships.
Examining the trade areas of Chipotle, Sweetgreen, Slim Chickens, and Hooters, for instance, reveals that Sweetgreen’s visitors tended to have the largest share of Women’s Soccer followers. Conversely, Sweetgreen’s trade area had lower-than-average shares of College Football Fans or College Basketball Fans, while residents of the trade areas of the other three chains showed greater-than-average interest in these sports. Leveraging location intelligence can help companies choose brand deals that their customers resonate with and find the ideal athletes to represent the chain.
College Gameday - Wins for Dining
Finding the right college athlete partnership is one way for dining brands to appeal to college sports enthusiasts. But dining chains and venues located near major college stadiums also benefit from the popularity of their local team by enjoying a major game day visit boost.
One of the country’s most popular college football teams, the Ohio State Buckeyes, can draw millions of TV viewers, and its stadium has a capacity of 102,780 – one of the largest stadiums in the country. And while tailgating is a popular activity for Buckeyes fans, nearby restaurants are some of the biggest beneficiaries of the college football craze. Panera experienced a 235.3% increase on game days as compared to a typical day, Domino’s Pizza visits grew by 283.3%, and Tommy’s Pizza, a local pie shop, saw its visits jump by a whopping 600.9%.
Game Day Visitor Spikes
This influx in diners also causes a major shift in game day visitor demographics, as revealed by changes in visitors at dining venues located near stadiums of two of the nation’s best college football teams – the Ohio State Buckeyes and Ole Miss Rebels. Based on Spatial.ai: Personalive data for the captured market of these dining venues, game day visitors tended to come from “Ultra Wealthy Families” when compared to visitors during a typical non-game day in September or October.
The analysis indicates that popular sporting events create a unique opportunity for restaurants near college stadiums to attract high-income customers game day after game day, year after year.
Subwars: Room for Everyone
While some spend game day tailgating or visiting a college restaurant, others hold a viewing party – with a six-foot submarine. And the sub’s popularity extends beyond Superbowl Sundays. Sandwich chains including Jersey Mike’s, Firehouse Subs, Jimmy John’s, and Subway (recently purchased by the same company that owns Jimmy John’s) have seen sustained YoY increases in visits and visits per venue in the first three quarters of 2023.
Some of the growth to these chains may be related to their affordability, a draw at all times but especially during a period marked by consumer uncertainty and rising food costs. And subway leaders seem to be seizing the moment and striking while the iron is hot – Jersey Mike’s opened 350 stores in 2023 and still saw its YoY visits per venue grow by 6.6%. And Subway reported ten consecutive quarters of positive sales, a promising sign for its new owner.
Sandwich Chains Attract a Wide Consumer Base
The love for a healthy, affordable sandwich extends across all income levels, with all four chains seeing a range in their visitors' median household income (HHI). Out of the four chains analyzed, Jersey Mike’s – which has long prioritized a suburban, middle-income customer – had the highest trade area median household income of the four chains at $77.3K/year. Subway, known for its affordability, had the lowest, with $62.9K/year. The variance in median HHI combined with the strong foot traffic growth shows that when it comes to sandwiches, there’s something for everyone.
So What’s The Dining Space Cooking Up?
Persistent inflation and declining consumer sentiment may pose serious challenges for the dining space, but emerging trends are helping boost some restaurants. Customers seeking out a late-night bite drive visits to QSR chains, and health-conscious diners are boosting foot traffic to smoothie bars and sandwich shops. Meanwhile, sports sponsorships and game-day restaurant visits can provide a boost to dining businesses that take advantage of these opportunities.

