


.svg)


Dave & Buster's and Main Event, two leading chains in the eatertainment industry, offer a unique mix of dining, arcade games, and immersive experiences, successfully drawing crowds seeking more than just a meal out.
We took a closer look at the two chains – both of them owned by parent company Dave & Busters Entertainment, Inc. – to see how they are faring as summer winds down.
The Great Indoors
Dave & Buster’s and Main Event have plenty of games for children – but with extensive drinks menus, they also decidedly cater to adults, offering both groups a much-needed opportunity to kick back, play some games, and enjoy a meal out with friends.
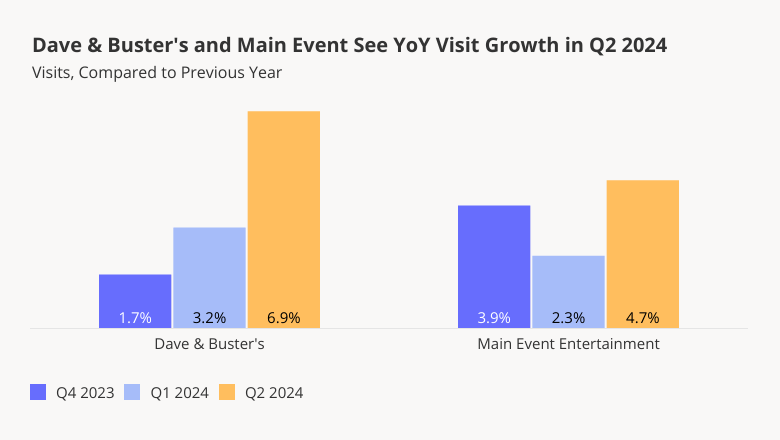
And recent foot traffic data shows that despite challenges, both chains are seeing overall YoY visit increases – partially driven by the chains’ fleet expansions. On a quarterly basis, foot traffic to Dave & Buster’s and Main Event has remained elevated year over year (YoY) since Q3 2023, finishing out Q2 2024 with respective visit boosts of 6.9% and 4.7%.
Living For the Weekends
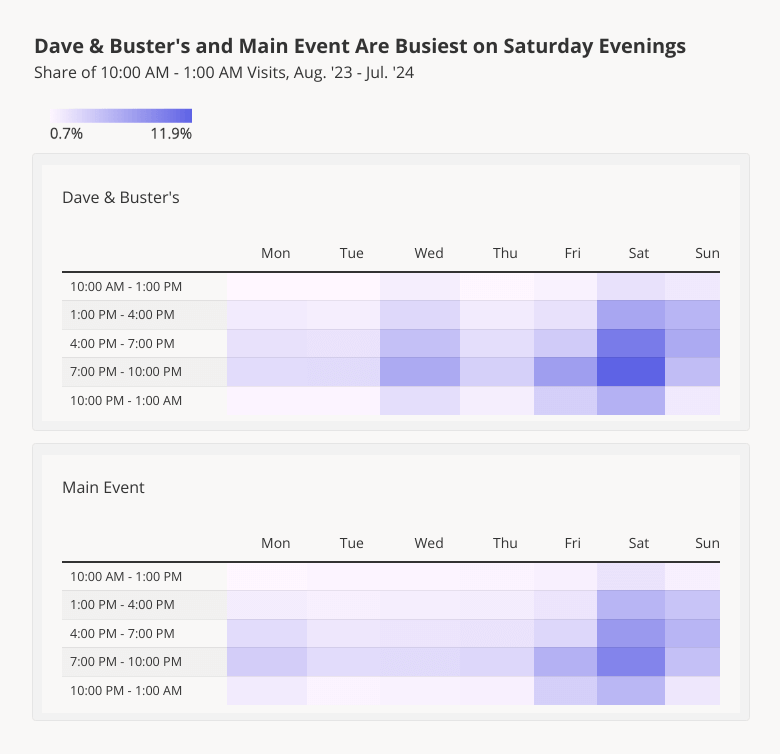
As prime eatertainment destinations, Dave & Buster’s and Main Event are busiest on weekends – with Saturday evening between 7:00 to 10:00 PM drawing the biggest crowds to both chains.
Between August 2023 and July 2024, 11.9% of visits to Dave & Buster’s and 9.4% of visits to Main Event took place during the Saturday evening time slot. Friday and Sunday also experienced increased foot traffic, with hourly fluctuations reflecting the rhythms of weekend activities: Friday visits picked up between 7:00 and 10:00 PM, as people likely wrapped up their work weeks and headed out to unwind with a drink and some skee ball. Sunday visits followed the opposite pattern, with stronger foot traffic earlier in the day that tapered off towards evening, as people put down their pool cues and got ready for the upcoming week.
But Dave & Buster’s and Main Event are both adept at harnessing special promotions to drive visits on off-peak, weekday hours. Dave & Buster’s famous Wednesdays half-off deals fueled significant visit upticks throughout the analyzed period – so it may come as no surprise that the chain recently stepped up its off-peak offerings with a new all-you-can-eat weekday wings deal. And Main Event, which has long offered a Monday Night Madness promotions, also unveiled a “Summer Season Pass” to encourage weekday visits among its customers.
Driving Distance Differs By Day Of Week
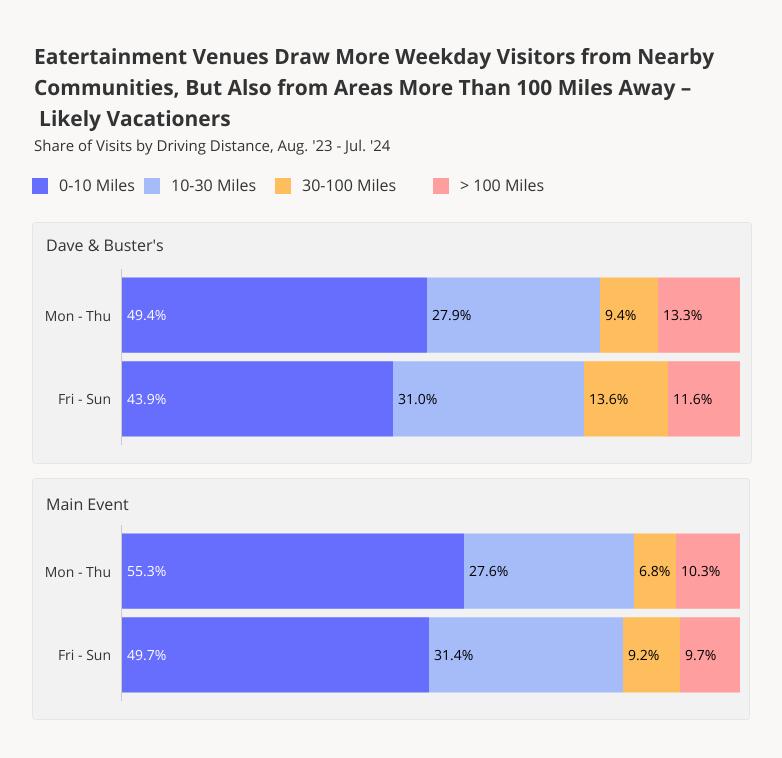
Visitor behavior to Dave and Buster’s and Main Event also changes throughout the week. Analyzing the average driving distances of visitors to the two chains shows, unsurprisingly, that people drive further distances to visit the venues on the weekends – when they have more time on their hands.
Between August 2023 and July 2024, 43.9% of weekend visits (Friday to Sunday) to Dave & Buster’s, and 49.7% of weekend visits to Main Event were made by people traveling 10 miles or less to reach the restaurant. On Weekdays (Monday to Thursday), these numbers increased to 49.4% and 55.3%, respectively – indicating that on weekdays, the eatertainment chains are particularly appealing to locals looking for a convenient night out.
But interestingly, it was on weekdays that visitors to the two chains were most likely to come from more than 100 miles away, suggesting that these customers may be on vacation away from home – the perfect time to pop into an arcade mid-week and “unlearn adulthood.”
Get Your Game On
Dave & Buster's and Main Event Entertainment continue to flourish, attracting weekend crowds and drawing visitors from near and far. Can the two eatertainment chains continue to draw crowds as summer draws to a close?
Visit Placer.ai to keep up with the latest data-driven dining and entertainment trends.
Summer events and concerts are more than just entertainment – they drive community engagement and have a significant economic impact on local businesses.
We took a closer look at the effect of major summer events, like Lollapalooza in Chicago and Governors Ball in New York, on foot traffic to local venues.
Lollapalooza: Energizing Chicago
The first Lollapalooza – a four-day music festival – took place in 1991. Chicago’s Grant Park became the event’s permanent home (at least in the United States) in 2005, drawing thousands of revelers and music fans to the park each year.
This year, the festival once again demonstrated its powerful impact on the city. On August 1st, 2024, visits to Grant Park surged by 1,313.2% relative to the YTD daily average, as crowds converged on the park to see Chappell Roan’s much-anticipated performance. And during the first three days of the event, the event drew significantly more foot traffic than in 2023 – with visits up 18.9% to 35.9% compared to the first three days of last year’s festival (August 3rd to 5th, 2023).
Change In Visitor Profile
Lollapalooza led to a dramatic spike in visits to Grant Park – and it also attracted a different type of visitor compared to the rest of the year.
Analyzing Grant Park’s captured market with Spatial.ai’s PersonaLive dataset reveals that Lollapalooza attendees are more likely to belong to the “Young Professionals” and “Ultra Wealthy Families” segment groups than the typical Grant Park visitor.
By contrast, the “Near-Urban Diverse Families” segment group, comprising middle-class diverse families living in or near cities, made up only 6.5% of visitors during the festival, compared to 12.0% during the rest of the year.
Additionally, visitors during Lollapalooza came from areas with higher HHIs than both the nationwide baseline of $76.1K and the average for park visitors throughout the year. Understanding the demographic profile of visitors to the park during Lollapalooza can help planners and city officials tailor future events to these segment groups – or look for ways to make the festival accessible to a wider range of music lovers.
Businesses Get Boosts
Lollapalooza’s impact on Chicago extended beyond the boundaries of Grant Park, with nearby hotels seeing remarkable surges in foot traffic. The Congress Plaza Hotel on South Michigan Avenue witnessed a staggering 249.1% rise in visits during the week of July 29, 2024, compared to the YTD visit average. And Travelodge on East Harrison Street saw an impressive 181.8% increase. These spikes reflect the festival’s draw not just for locals but for out-of-town visitors who fill hotels across the city.
The North Michigan Avenue retail corridor also enjoyed a significant increase in foot traffic during the festival, with visits on Thursday, August 1st 56.0% higher than the YTD Thursday visit average. On Friday, August 2nd, visits to the corridor were 55.7% higher than the Friday visit average. These numbers highlight Lollapalooza’s role in driving economic activity across Chicago, as festival-goers venture beyond the park to explore the city’s vibrant retail and hospitality offerings.
Queens Keeps it Cool
City parks often serve as community hubs, and Flushing Meadows Corona Park in Queens, NY, has been a major gathering point for New Yorkers. The park hosted one of New York’s most beloved summer concerts – Governors Ball – which moved from Governors Island to Flushing Meadows in 2023.
During the festival (June 9th -11th, 2024), musicians like Post Malone and The Killers drew massive crowds to the park, with visits soaring to the highest levels seen all year. On June 9th, the opening day of the festival, foot traffic in the park was up 214.8% compared to the YTD daily average, and at its height, on June 8th, the festival drew 392.7% more visits than the YTD average.
The park also hosted other big events this summer – a July 21st set by DMC helped boost visits to 185.1% above the YTD average. And the Hong Kong Dragon Boat Festival on August 3rd and 4th led to major visit boosts of 221.4% and 51.6%, respectively.
These events not only draw large crowds, but also highlight the park’s role as a space where cultural and civic life can find expression, flourish, and contribute to the health of local communities.
The Reach and Resonance of Events
Analyzing changes in Flushing Meadows Corona Park’s trade area size offers insight into how far people are willing to travel for these events. During Governors Ball, for example, the park’s trade area ballooned to 254.5 square miles, showing the festival's wide appeal. On July 20th, by contrast, when the park hosted several local bands and DJs, the trade area was a much more modest 57.0 square miles.
Ready, Set, Summer
Summer events drive community engagement, economic activity, and civic pride. Cities that invest in their parks and event hubs, fostering lively and inclusive spaces, can create lasting value for both residents and visitors, enriching the cultural and social life of urban areas.
For more data-driven civic stories, visit Placer.ai.

Department stores across the country have been evolving to meet changing consumer wants and needs, and Macy’s & Bloomingdale’s are no exception. Owned by the same company – Macy’s, Inc – these two brands have been recalibrating their store fleets and experimenting with new formats.
We took a closer look at visitation trends to both brands to understand how they diverge, analyze their respective strengths, and explore what might be ahead for both.
Monthly and Weekly Foot Traffic: Stabilization and Growth
In recent years, Macy’s, Inc. has focused on optimizing its store fleet, a long-running project that gained momentum with the 2023 appointment of former Bloomingdale’s executive Tony Spring as CEO. This change coincided with a turnaround strategy involving the closing of some 30% of the brand’s traditional department stores; the expansion of Macy’s small-format model; and the addition of more Bloomingdale’s locations.
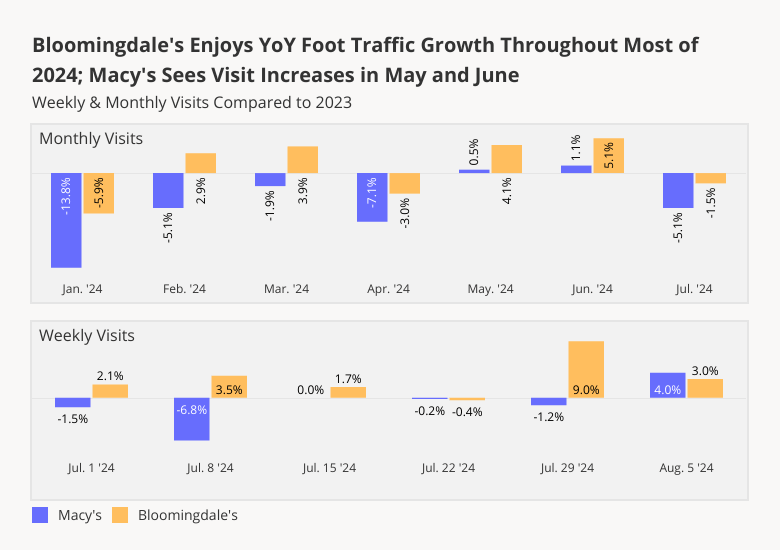
And a look at foot traffic trends at Bloomingdale’s shows that the high-end brand is indeed experiencing an uptick in demand, making it ripe for expansion. For much of the period between January and July 2024, Bloomingdale’s saw YoY monthly visit increases, with only January, April, and July seeing YoY declines. January’s drop was likely due to the inclement weather that weighed on retailers nationwide, while the April 2024 YoY downturn may have been due in part to the comparison to an April 2023 that had five weekends. And though July 2024 as a whole saw visits down 1.5% YoY, a look at weekly foot traffic to Bloomingdale’s shows that throughout most of that month and into August, the chain continued to draw more visits than in 2023.
Macy’s, for its part, had a slower start to 2024 – with YoY monthly visits down through April 2024. But in May and June, Macy’s visit gap closed, with foot traffic just above 2023 levels. And though Macy’s also saw monthly YoY visits decline in July, the chain’s weekly foot traffic has remained at or above 2023 levels since the middle of the month – likely spurred by back-to-school shopping and sales.
With the upcoming holiday season expected to bring a surge in foot traffic, both Macy’s and Bloomingdale’s are well-positioned to capitalize on these opportunities and potentially drive further growth.
A Wide Range Of Incomes
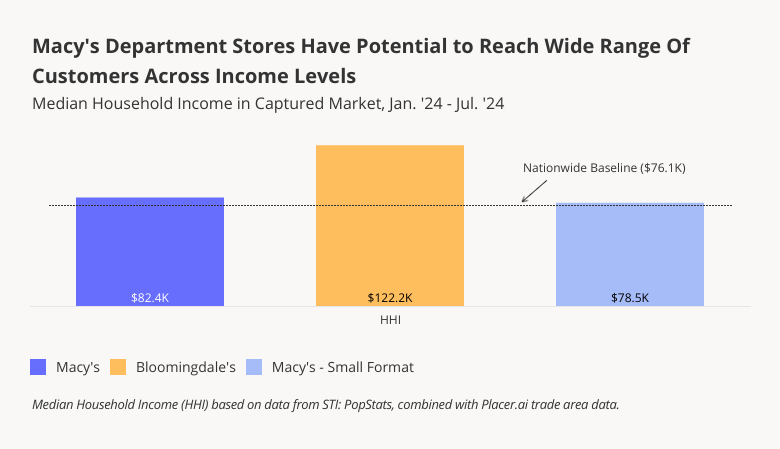
Analyzing the median household incomes (HHI) of Macy’s and Bloomingdale’s captured markets shows how Macy’s, Inc.’s revitalization strategy is helping the company further diversify the range of options available for shoppers of all kinds underneath its umbrella.
Between January and July 2024, for example, luxury-focused Bloomingdale’s attracted visitors from areas with the highest median HHI of the three brands – $122.2K, well above the nationwide average of $76.1K. Bloomingdale’s affluent audience may be less prone to inflation-driven cutbacks than the average American, contributing to the chain’s stronger positioning this year.
By contrast, Macy’s shoppers came from areas with a median HHI of $82.4K, while visitors to Macy’s small-format stores (some 13 locations nationwide) came from areas with a median HHI of $78.5K – just above the nationwide baseline. By expanding its small-format footprint, Macy’s may succeed at increasing its draw among more average-income shoppers.
This income variation underscores the broad retail potential of each chain, ensuring that consumers can find options that cater to their specific needs across Macy’s diverse offerings.
Blooming & Growing: The Bloomingdale’s Shopper
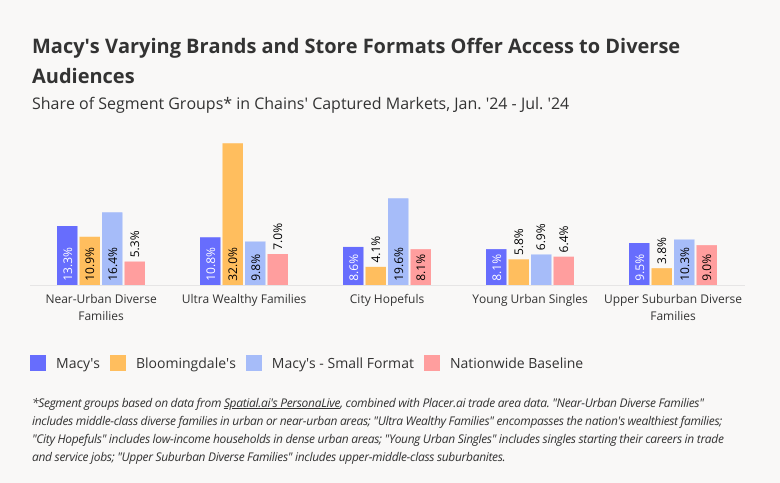
Analyzing the psychographic characteristics of Macy’s and Bloomingdale’s captured markets can shed additional light on how the chain’s turnaround strategy may help it reach new audiences. Macy’s traditional department stores already draw a diverse mix of consumers. But the addition of new Bloomingdale’s locations will help the company make further inroads into affluent segment groups like “Ultra Wealthy Families” – which makes up a whopping 32.0% of Bloomingdale’s captured market. At the same time, Macy’s smaller-format stores will offer the company greater access to the more modest-income “City Hopefuls” and “Near-Urban Diverse Families”, as well as the upper-middle-class “Upper Suburban Diverse Families”.
A Strategic Path Forward
Macy’s and Bloomingdale’s continue to adapt to shifting consumer preferences by focusing on their strengths in specific markets and among their demographic segments, and by expanding its small-format stores. With the holiday season approaching, can both chains continue to drive visits?
Visit Placer.ai to keep on top of the latest data-driven retail news.

Summer 2024 has seen fierce competition among fast food and dining chains, with many embracing limited-time offers (LTOs) to attract customers and drive visits. As restaurant price wars continue unabated, these promotions are proving crucial in keeping consumer interest alive.
We dove into the visit performance of four brands – McDonald’s, Burger King, Taco Bell, and Smoothie King – to see how their LTOs are driving visits.
McDonald’s: Continued Visit Success
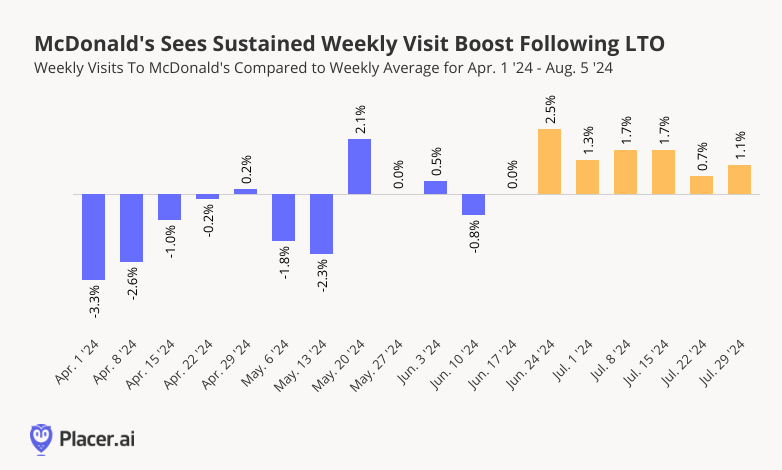
On June 25th, 2024, McDonald’s launched a limited-time offer, allowing customers to purchase a McDouble or McChicken, a 4-piece Chicken McNuggets, small fries, and a small soft drink for just $5. Originally intended to run for about a month, the promotion was so successful that it was extended through August. Foot traffic began to trend upwards following the promotion’s launch, with visits during the week of June 24th up 2.5% compared to the chain’s weekly average between April 1st and August 5th. And foot traffic to McDonald’s has remained consistently elevated in the weeks since.
Burger King: Value Meal Leads To Stable Growth
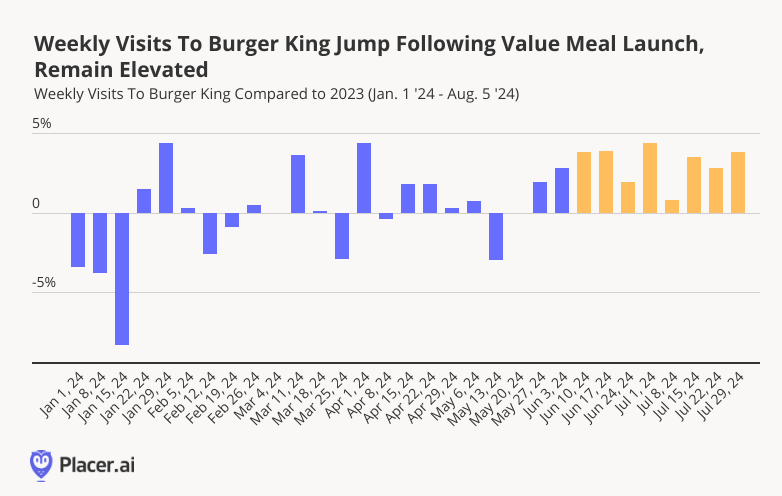
Like McDonald’s, Burger King has also been leaning into value-driven promotions, launching the "$5 Your Way" value meal on June 10th, 2024. And the promotion seems to be driving visits in a significant way. While weekly YoY visits to the chain have fluctuated throughout 2024, they jumped 3.8% YoY during the week of June 10th, and have remained consistently elevated since. Burger King, recognizing the power of the value meal, has chosen to keep the special running until October.
And following its recent rightsizing efforts, Burger King isn’t resting on its laurels. Building on the success of its $5 value meal, the chain also launched a limited-time, extra-spicy menu update on July 18th. This new offering appears to have helped keep visits elevated: After waning slightly during the week of July 8th, foot traffic to Burger King picked up once again during the week of the launch.
Having a Baja Blast
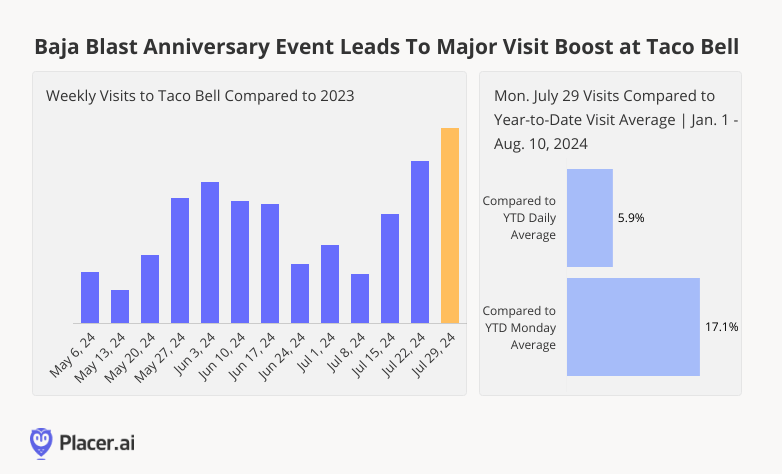
Tex-Mex favorite Taco Bell kicked off the 20th anniversary of its popular lime-flavored drink, Baja Blast, with a special "Bajaversary" promotion on July 29th, 2024, offering free drinks and freezes both in-store and on the app. The deal seems to have resonated strongly with customers, with visits growing by 12.3% year-over-year (YoY) for the week of July 29th. Daily visits also experienced a major increase – on the day of the special, visits surged by 17.1% compared to the YTD Monday visit average and were 5.9% higher than the overall YTD visit average.
Smoothie King: Capitalizing on the Olympic Spirit
The Summer Olympics were a major event, with millions of viewers tuning in to watch athletes at their best. And many fast food chains jumped on the Olympics bandwagon, offering discounts, deals, and limited-time menu items inspired by the event.
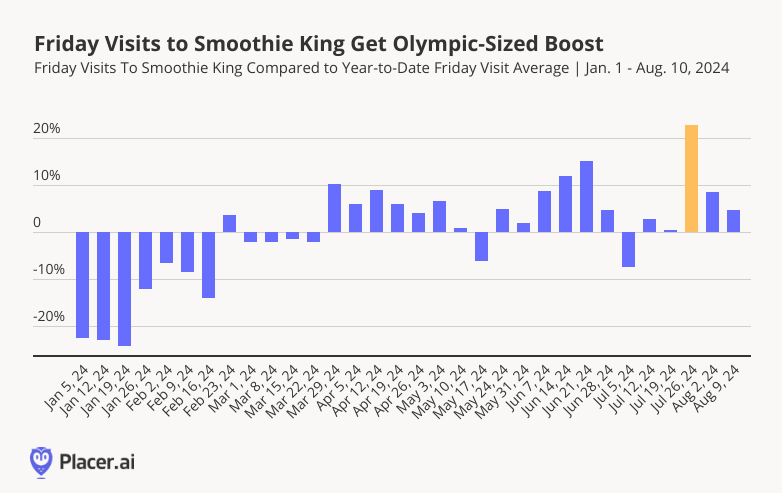
Smoothie King, known for its health-focused beverages, was one such brand with an Olympics special. The chain offered 32-oz smoothies for just $5 on Friday, July 26th, 2024, to coincide with the Olympic kickoff. The deal ran for one day only and fueled a significant foot traffic boost. Visits to Smoothie King on July 26th were 22.9% higher than the YTD Friday visit average – highlighting the effectiveness of well-timed, event-based offers.
Short Term Deals, Long Term Gains
For now at least, it seems that LTOs – particularly those focused on offering diners more bang for their buck – are reigning supreme in the fast-food space.
Will these promotions continue to drive foot traffic and maintain customer engagement?
Visit Placer.ai for the latest data-driven dining news.

With H2 2024 underway, we took a look at the foot traffic performance of superstores Walmart and Target, and membership warehouse clubs BJ’s Wholesale Club, Sam’s Club, and Costco. How did foot traffic compare to 2023’s visitation patterns? And what special events helped propel visits?
Year-over-Year Visits Continue to Show Strength
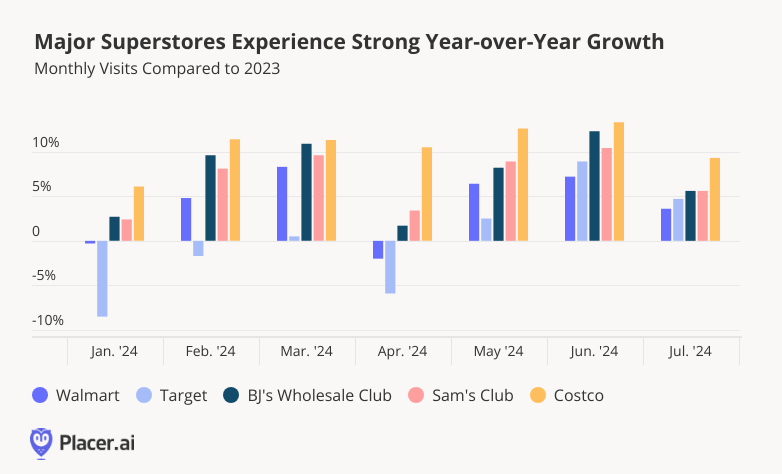
Superstores have been thriving – with YoY visits to retail giants Walmart and Target elevated consistently since May 2024. And though Target had a slower start to the year, YoY foot traffic to the chain picked up in Q2, and the retailer has been flourishing since. (Target and Walmart's April 2024 YoY foot traffic drops are likely attributable in part to calendar shifts: April 2023 had one more weekend than April 2024 – and one of them was Easter.)
Membership warehouse clubs have been faring even better, with Costco leading the pack in Q2. BJ’s and Sam’s Club also experienced strong visit growth, with July visits elevated by 5.6% YoY for both brands.
Warehouse Clubs Lead The Visit Pack
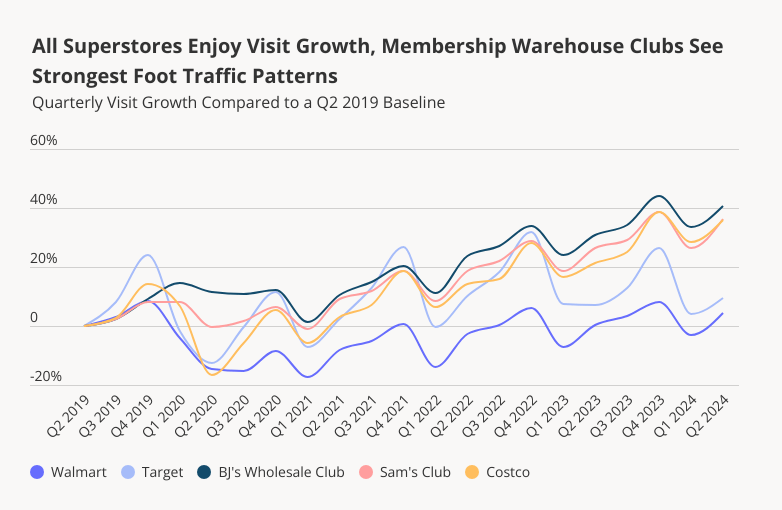
A closer look at the baseline change in quarterly visits since Q2 2019 further highlights the strong positioning of superstores and wholesale clubs in 2024. All five retailers drew more visits in Q2 2024 than they did pre-pandemic (Q2 2019).
But these visit increases have not been equally distributed across the retailers: While all of them experienced growth relative to a Q2 2019 baseline, membership warehouse visits have been outpacing those of superstores on a consistent basis since Q1 2023. As prime destinations for inexpensive, bulk buying, the segment has likely been buoyed by families and younger consumers seeking ways to save money on groceries and other basics amid high prices.
Target’s Circle Week Boosts Visits
But superstores have also been having a moment. And one factor which may have contributed to Target’s Q2 2024 turnaround is its doubling down on loyalty: In April 2024, the chain revamped its Target Circle Rewards, adding, among other things, a new paid tier called Target Circle 360.
A key benefit of Target’s loyalty program, which is free to join for the regular tiers, is access to deep discounts during Target Circle Week. This year, the big sales event took place between July 7th and 13th – and examining foot traffic trends to the chain reveals that the promotion fueled a major visit boost: During the week of July 8th, weekly visits to Target were the highest they’ve been since the start of the year, and 6.8% higher than 2024’s weekly visit average. This year’s Circle Week visits also outperformed last year’s by 8.7%.
This demonstrates how the revamped loyalty program and exclusive sales events are successfully driving more customers to Target stores. And other retailers are taking note, with Walmart debuting its own major summer sales events and Costco and Sam’s Club battling it out for the most affordable prices – a major win for shoppers nationwide.

Superstore My Shopping
Superstores enjoyed elevated visitation patterns in Q2 2024. Will the superstore and wholesale club price wars continue? And with back-to-school shopping well underway, and the holiday shopping season quickly approaching, how will these retailers continue to perform?
Visit Placer.ai to keep up with the latest data-driven retail news.

After theaters were dominated by Barbenheimer in 2023, 2024 is shaping up to be another record-breaking year, with several big-name releases. We took a closer look at visitation patterns at major movie theater chains – AMC Theatres, Regal Cinemas, and Cinemark – to analyze how foot traffic has been impacted by the highly anticipated summer releases of Deadpool & Wolverine and Twisters.
Major Boost at the Box Office
Last year was one of the most exciting ones in recent memory for cinema, with multiple films breaking box-office records and driving foot traffic at movie theaters across the country. But 2024 has had plenty of tricks up its cinematic sleeve, and several summer releases have been meeting the high bar set by Barbenheimer. Inside Out 2, released nationwide on June 14th 2024, kickstarted the summer with a major movie-goer visit boost– and Deadpool & Wolverine, released on July 26, 2024 brought out even bigger crowds.
Indeed, the superhero crossover movie Deadpool & Wolverine is set to be one of the best-performing films of 2024. During the week of July 22nd, 2024 – when Deadpool & Wolverine was released – visits to movie leaders AMC Theatres, Regal Cinemas, and Cinemark jumped by 132.7% to 140.5% compared to a YTD weekly average. Twisters, released on July 19th, also drove impressive visit boosts ranging from 39.8% to 48.3% during the week of July 15th.

Early Marvel Momentum
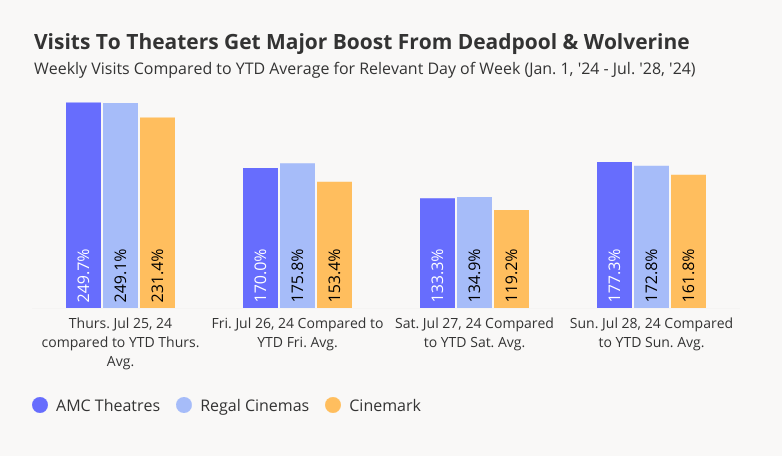
Early screenings have always been a big driver of visits for those lucky enough to grab tickets. And on the day before Deadpool & Wolverine’s big July 26th release, movie theaters already started filling up. On Thursday, July 25th, 2024, visits to AMC, Regal, and Cinemark were up a whopping 231.4% to 249.7% compared to a YTD Thursday average. And Friday, Saturday, and Sunday continued to see visit numbers significantly higher than the YTD visit averages for those days of the week, confirming the movie’s ability to drive visits to theaters. (In absolute terms, Saturday, July 27th was the cinema leaders’ busiest day of the year so far – but since Saturdays tend to be busier than Thursdays, the relative visit spike was somewhat smaller).
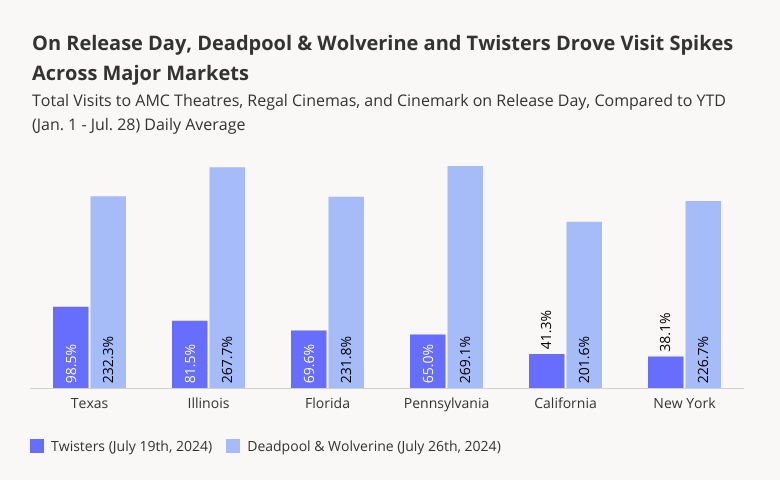
Twister Drives Visits Across Major Markets – Especially in Tornado-Prone Texas
Drilling down into the data for major markets shows that though Deadpool & Wolverine was the runaway hit of the summer, Twisters also drove significant visit spikes throughout the country. And of the major markets, some of Twisters’ biggest visit boosts took place in states with plenty of hands-on tornado experience – like Texas, where July 19th visits to AMC, Regal, and Cinemark (combined) were up 98.5% compared to a YTD daily average.
Oklahoma!
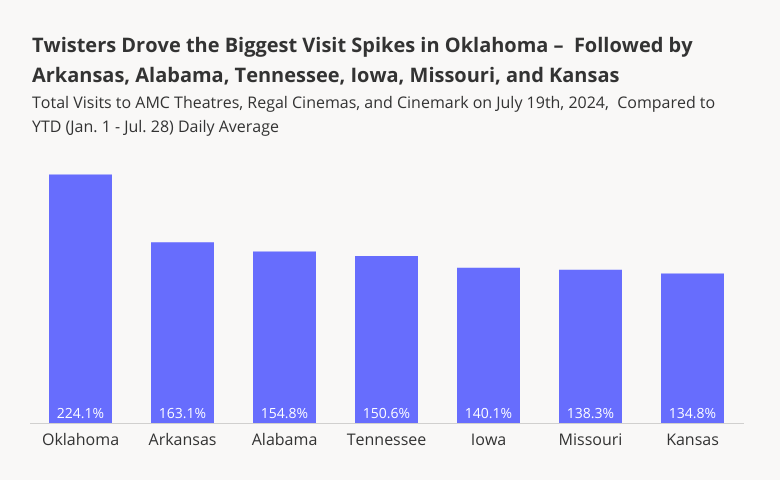
Indeed, looking at the states where Twisters drove the biggest visit spikes shows that many of the top performers were in tornado-prone areas. Oklahoma – where much of the movie was filmed – saw the most impressive Twisters foot traffic bump, with visits to leading cinemas up 224.1% on July 19th, 2024 compared to a YTD daily average. And the tornado-focused thriller also drew outsize crowds in other states where the theme of the movie was more likely than average to resonate with local audiences’ personal experiences – including Arkansas, Alabama, Tennessee, Iowa, Missouri, and Kansas.
A Cinematic Marvel
Blockbuster releases like Deadpool & Wolverine, Twisters, and Inside Out 2 highlight the enduring appeal of out-of-home entertainment, and proves that movie theaters are as relevant as ever.
With more highly-anticipated releases still yet to come in 2024, can movie theaters across the country continue to break visit records?
Visit Placer.ai to stay on top of the latest data-driven leisure and entertainment stories.

