


.svg)


Starbucks, the largest coffee chain in the world, and Dutch Bros, one of the fastest growing in the country, are major players in the hot and cold beverage space. With Q3 2024 in the rearview mirror, we took a closer look at the visitation patterns to both chains to see how they are faring – and what might lie ahead for both brands.
Starbucks Sees Stronger Short Stays
Starbucks is one of the most dominant names in coffee across the world, with thousands of stores in the United States alone. Between July 2023 and July 2024, the chain added more than 500 stores to its domestic fleet, bringing its U.S. store count to 16,730. And though Starbucks has faced its share of challenges, these store additions helped keep overall traffic to the coffee leader on par with 2023 levels throughout the summer – though visits dipped somewhat in September as consumers went back to their routines.
But digging deeper into the visit data shows that even as Starbucks saw overall foot traffic growth stall in Q3, the number of short visits to the chain – i.e. those lasting less than 10 minutes – increased. In August and September 2024, the chain drew 8.5% and 4.7% more short visits, respectively, than in the same periods of 2023 – revealing how important these quick stops are for the chain.
In-app ordering, which together with drive-thru orders made up about 70% of sales at the chain as of January 2024, may be contributing to the short visit trend. Still, new CEO Brian Niccol is looking for ways to return the chain to its roots as the third place, and the chain may yet implement shifts to encourage longer visits in the coming months.

Dutch Bros Brings The Visits
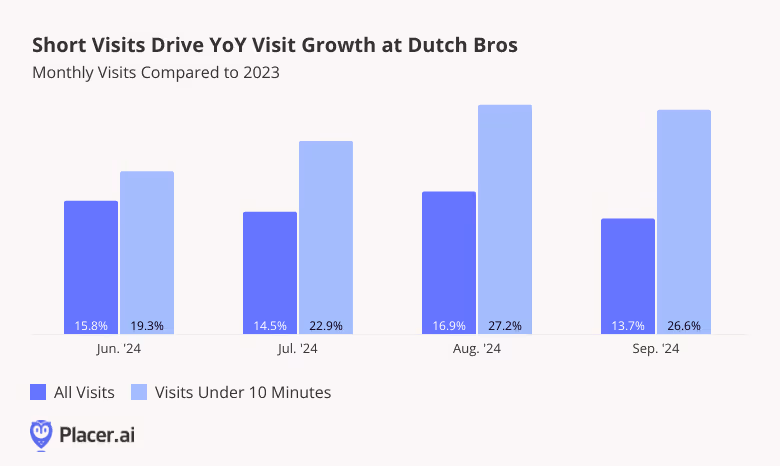
Dutch Bros has been one of the most impressive coffee chains to watch over the past few years. The Oregon-based chain has been on an expansion tear – opening more than 150 stores between Q2 2023 and Q2 2024 – and has seen the elevated monthly visits to match. Between June and September 2024, visits to Dutch Bros increased between 13.7% and 16.9%, highlighting the chain’s success at growing its audience.
But like at Starbucks, short visits outperformed longer ones at Dutch Bros – and by a lot. In September 2024, for example, overall visits to the chain grew by 13.7% – but visits lasting less than 10 minutes shot up by 26.6%.
The strength of these short visits, for both Starbucks and Dutch Bros, suggests a shift towards convenience, with both chains utilizing drive-thru services and in-app ordering to accommodate busy consumers.
Weekends Lead To Lingering Visitors
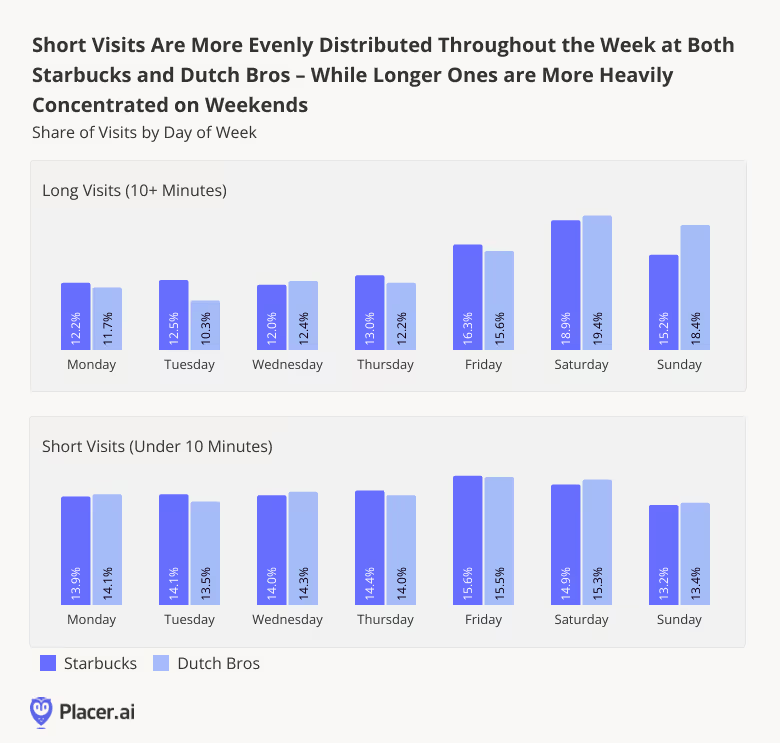
Digging down deeper into the data shows that for both Starbucks and Dutch Bros, these all-important short visits follow a distinct weekly pattern.
While longer visits (≥10 minutes) to both chains peaked in Q3 2024 on Saturdays, shorter visits were more evenly distributed throughout the week, peaking on Fridays. Overall, 34.1% of long visits to Starbucks, and 37.8% of long visits to Dutch Bros, took place on the weekends in Q3 2024 – compared to 28.1% and and 28.7%, respectively, for shorter visits.
Unsurprisingly, customers may be more likely to grab a quick coffee to go during the work week. And with the return to office still underway, quick visits may be enjoying a boost fueled by commuters in need of a quick cubicle pick-me-up.
Final Sips
As Starbucks works to adapt to shifting consumer preferences, understanding when customers spend more time in-store can help the brand reconnect with its roots as a community hub. And Dutch Bros can continue to enhance the quick-service experience that has fueled its growth. How will the two chains continue to perform in what remains a competitive coffee environment?
Follow Placer.ai for the latest data-driven dining insights.

Chipotle, Wingstop, and Shake Shack have emerged as restaurant leaders, thriving and outperforming the wider fast-casual and quick-service restaurant (QSR) categories. How did these chains perform in Q3 2024? We dove into the data to find out.
Foot Traffic Shows No Signs Of Slowing
Chipotle, Wingstop, and Shake Shack have become some of the most popular dining chains in the nation, each within its own respective niche: Chipotle excels at health-focused Tex-Mex meals, Wingstop serves up chicken wings and other game-day style dishes, and Shake Shack is known for its burgers and frozen custards. All three chains are leaning into growing demand for their offerings by adding new restaurants at a brisk clip. And for all three, the investment in fleet expansion is paying off, driving double-digit YoY visit growth.
Of the three chains, Wingstop enjoyed the strongest YoY growth between June and September of this year, with visits rising 16.5% to 33.5% throughout the analyzed period. Shake Shack, for its part, saw visits increase between 12.4% and 25.9%. Meanwhile, Chipotle, continuing several years of visit growth, posted 10.0% to 12.9% YoY boosts. In contrast, the overall quick-service and fast-casual restaurant segments saw much more muted performance, with QSR visits hovering at or slightly below 2023 levels and fast-casual segments seeing modest visit upticks.

Visit Per Locations Show Similar Growth Patterns
One key driver behind the significant foot traffic growth for these three chains is their aggressive expansion. Wingstop, which saw the largest year-over-year (YoY) increase in foot traffic, opened some 138 new restaurants in 2024 alone, and hopes to open around 300 by year’s end. Chipotle has also been expanding rapidly, with around 52 new stores in 2024 so far and more on the way. Shake Shack, aiming to open 80 new locations this year, is similarly focused on growth.
A closer look at shifts in the average number of visits to the chains’ individual locations shows that this expansion is being met with strong demand. Chipotle and Wingstop saw monthly YoY visit-per-location increases throughout the analyzed period, while Shake Shack saw increases between June and August and experienced just a minor dip in September.
These foot traffic trends – both across the chains and at individual locations – indicate that the new stores are successfully attracting steady customer interest.

Short Visits Drive More Growth
Another key factor driving success for the three chains is their pivot towards convenient takeaway options. Chipotle has focused on expanding its Chipotlane drive-thru service, while Wingstop has invested in an in-store digital platform meant to streamline the ordering process. And despite Shake Shack’s “anti fast-food” identity, the chain has also embraced drive-thrus and ordering kiosks to speed up service.
The data suggests that consumers appreciate the increased convenience of these quicker options: In Q3 2024, short visits (10 minutes or less) to Chipotle, Wingstop, and Shake Shack surged between 17.0% and 25.5% compared to Q3 2023.
For Chipotle and Shake Shack, short visits increased significantly more than extended ones in Q3, likely due in part to the brands’ intense focus on drive-thrus: Of the 271 restaurants opened by Chipotle in 2023, 238 included Chipotlanes. And since adding its first drive-thru in 2022, Shake Shack has expanded this option to more than thirty locations. For Wingstop, longer visits increased somewhat more YoY than shorter ones – but in the wake of the chain’s rapid expansion, short and long visits both increased more than 20% YoY.

Fast-Casual and Quick-Service Winners
Chipotle, Wingstop, and Shake Shack are succeeding, consistently increasing foot traffic and visits per location. Through strategic expansion and the adoption of drive-through and online ordering, these brands have firmly established their presence in the fast-casual and quick-service dining landscape.
Will the three restaurants continue to drive visit growth? Visit Placer.ai to find out.
This blog includes data from Placer.ai Data Version 2.1, which introduces a new dynamic model that stabilizes daily fluctuations in the panel, improving accuracy and alignment with external ground truth sources.

In a dining segment that has faced more than its fair share of headwinds, The Cheesecake Factory and BJ's Restaurant & Brewhouse have emerged as bright spots. We took a closer look at how the two chains have performed over the past year, and dove into some of the factors driving their success.
Steady Monthly Visit Growth
The full-service dining segment has seen turbulence since the pandemic, with many consumers embracing lower-cost meal options and redirecting their discretionary dollars. But the Cheesecake Factory – marked as a chain to watch this year – is one FSR that’s been particularly adept at weathering the storm. During the third quarter of 2024, visits to the chain were up 2.0% YoY, even as the wider FSR segment experienced a minor visit decline. And by continuing to offer a consistent, high-quality dining experience – while investing in staff retention to keep customer satisfaction higher than ever – the brand appears poised to continue growing its customer base.
BJ’s Restaurant & Brewhouse is another FSR chain that has been outperforming the wider segment. Like its cheesecake counterpart, BJ’s offers an especially varied menu – including its famous Pizookie dessert and a massive selection of craft beers. And after seeing a minor 1.7% YoY visit decline in Q2 2024, the chain finished out Q3 with an impressive 4.2% YoY uptick.
What’s driving the resilience of these two chains while others in the category struggle? We explored two factors driving this foot traffic success.

Special Calendar Days Ahead of the Holiday Season
One factor that may be helping The Cheesecake Factory and BJ’s Restaurant drive traffic is their ability to harness the power of annual dining milestones. Special calendar days can be powerful drivers of foot traffic at restaurants, offering chains a prime opportunity to grow visits – and sales.
But the two chains experience these milestones somewhat differently. For BJ’s Restaurant, the weeks of Mother’s Day (week of May 6th) and Father’s Day (week of June 10th) drew the most traffic during the last twelve months, with visits during these holidays rising 18.2% and 14.1%, respectively, compared to an October ‘23 - September ‘24 weekly visit average.
But for The Cheesecake Factory, it was the period right after Christmas that drew the biggest crowds. During the week of December 25th, 2023, visits were up 24.5% compared to the chain’s weekly average – likely driven in part by customers eager to redeem holiday gift cards. (Last year, the chain offered a special holiday gift card promotion, which went into effect in late November). Other calendar days, like Mother’s Day, Valentine’s Day, and National Cheesecake Day (week of July 29th), also provided the restaurant with substantial visit boosts.

Attracting Affluent Suburban Diners
Another factor that may be contributing to both brands’ better-than-average performance is their appeal among higher-income consumers. Using the Experian: Mosaic dataset to analyze The Cheesecake Factory and BJ’s trade areas reveals that both chains see higher shares of wealthy families in their captured markets than in their potential markets. (A chain’s potential market is obtained by weighting each Census Block Group (CBG) in its trade area according to population size, thus reflecting the overall makeup of the chain’s trade area. A business’ captured market, on the other hand, is obtained by weighting each CBG according to its share of visits to the chain in question – and thus represents the profile of its actual visitor base.)
Between January and September 2024, the shares of “Flourishing Families” in the Cheesecake Factory and BJ’s captured markets stood at 9.5% and 10.9%, respectively – outpacing their potential market shares. Similarly, the “Booming with Confidence” segment – wealthy, established couples living in suburban areas – was overrepresented in both restaurants’ captured markets.
These metrics highlight the two chains' success in attracting high-income family segments – groups who may be more resilient to the impacts of rising prices. For this consumer group, these restaurants strike a balance between quality and cost-effectiveness, making them a compelling choice for dining out in an uncertain economic landscape.

A Slice of Success
The Cheesecake Factory and BJ’s have found ways to thrive in a challenging dining environment, keeping foot traffic up and tapping into a receptive customer base.
With the holiday season around the corner, can these two chains maintain their foot traffic growth? Will The Cheesecake Factory see another major holiday season visit spike?
Visit Placer.ai to keep up to date with the latest data-driven dining news.
This blog includes data from Placer.ai Data Version 2.1, which introduces a new dynamic model that stabilizes daily fluctuations in the panel, improving accuracy and alignment with external ground truth sources.

Fast-casual dining chain CAVA has had a great few years. The restaurant chain, which serves up health and flavor-forward Mediterranean fare, has increased its footprint massively over the past few years, and shows no signs of slowing down.
We took a closer look at the location intelligence data to understand what is driving success for the fast-casual dining chain.
Monthly Visits Outpace Overall Fast-Casual Visits
CAVA, which has been opening restaurants at a rapid clip, is firmly in expansion mode. The restaurant chain featured 341 restaurants at the end of Q2 2024 – up from roughly 300 at the end of 2023 – and has set its sights on operating 1,000 locations by 2032.
Partly as a result of its growing footprint, CAVA’s foot traffic – already elevated in 2023 – has continued to surge throughout 2024. The chain achieved double-digit year-over-year (YoY) visit growth during every month of the year so far, with September visits up 24.9% YoY. By comparison, the broader fast-casual dining sector – which is also thriving – saw more modest YoY visit growth over the same period, as well as some minor YoY declines in January and September.

Visit-Per-Location Growth Cements CAVA’s Positioning
Still, though much of CAVA’s YoY foot traffic growth may be attributed to its rapid expansion – after all, more restaurants mean more opportunities for diners to try a lemon chicken or harissa avocado bowl – CAVA’s individual locations are also drawing more traffic. In all but one month of 2024 – January, when inclement weather led to a retail slowdown nationwide – the average number of visits to each CAVA restaurant also rose significantly. And in August and September 2024, visits per location grew by 15.0% and 9.9% YoY, respectively.
These trends suggest that CAVA’s expansion strategy is leaning into robust demand – and has succeeded in generating excitement and visit growth in both new and existing markets.

Visits Democratizing
One factor that may be helping CAVA drive traffic is the growing diversity of its customer base. Analyzing changes in CAVA’s captured market over time with demographics from STI: PopStats shows that the median household income (HHI) of the brand’s visitor base has dropped over the past few years. (A chain’s captured market is obtained by weighting each census block group (CBG) in its trade area according to its share of visits to the chain in question – and thus represents the profile of the business’ actual visitor base.) In Q3 2021, the median HHI of CAVA’s captured market was $107.5k – much higher than the nationwide median of $76.1K. But as the chain has expanded, the median HHI of its visitor base has steadily declined, reaching $92.3K by Q3 2024.
Similarly, using the Spatial.ai: PersonaLive dataset to look at the psychographic makeup of CAVA’s trade areas reveals that the share of “Ultra-Wealthy Families” in the chain’s captured market has also declined – from 22.9% 2021 to 17.1% in 2024. At the same time, the share of “Young Urban Singles” grew from 5.4% to 7.3%.
This shift suggests that as CAVA expands, it is welcoming a broader and more diverse customer base – positioning it for continued growth as it opens new locations.

CAVA’s Success Continues
CAVA continues to exceed expectations, opening stores at a rapid clip while maintaining visit numbers and appealing to an ever-growing range of customers.
What might the final quarter of the year hold in store for the fast-casual chain?
Visit Placer.ai to keep up to date with the latest data-driven dining insights.
This blog includes data from Placer.ai Data Version 2.1, which introduces a new dynamic model that stabilizes daily fluctuations in the panel, improving accuracy and alignment with external ground truth sources.

Carter’s Inc., owner of the OshKosh B’gosh and Carter’s baby and children’s clothing brands, is a major player in the nation’s $28 billion children's clothing industry. As of the end of 2023, the company boasted nearly 800 physical stores throughout the U.S. And after closing hundreds of stores in 2020, the brand is back to betting big on brick-and-mortar – with plans to open some 250 new U.S. locations by 2027.
How is Carter's faring in 2024? We took a closer look to find out.
Children's Clothing Creates Crowds
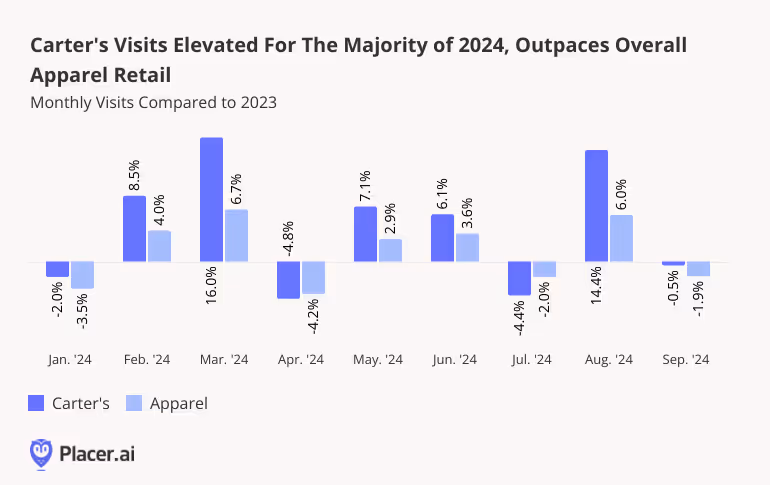
Discretionary spending cutbacks and the rise of online shopping have weighed on apparel retailers in recent years. But some clothing chains – including Carter’s – are bucking the trend. Between January and September 2024, monthly visits to Carter’s stores generally outpaced the wider apparel industry, with some months posting double-digit growth.
March and August 2024 saw respective YoY visit increases of 16.0% and 14.4%, likely driven by pre-Easter and back-to-school shopping. (March and August 2024 each also had one more Saturday than March or August 2023 – a busy day for clothing stores.) And Carter’s finished out Q3 2024 with a 4.3% YoY visit increase, even as the broader apparel category saw just a minor 0.8% uptick.
Baby Sale Boom
Indeed, examining weekly foot traffic to Carter's highlights the seasonality of the company’s visitation patterns. Visits are typically lower during the colder winter months but pick up in anticipation of Easter and spring break – likely encouraged by spring sales held by the brand.
Carter’s real spike, however, comes during the back-to-school season, when parents head to the store to pick up new clothing for the school year – and when Carter's holds major back-to-school sales. During the week of August 5th, foot traffic surged to 29.5% above the year-to-date (YTD) weekly visit average. And with the holiday season fast approaching – including major retail milestones like Black Friday and Super Saturday – the children's retailer appears poised to enjoy continued success.

Family Friendly Fashion
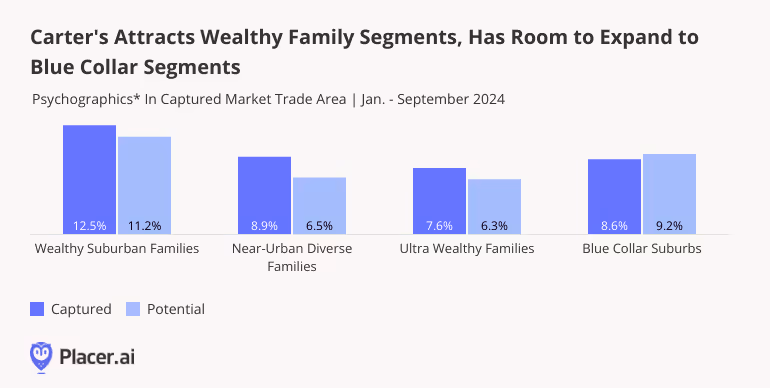
Unsurprisingly, Carter's attracts family segments to its stores, and over-indexes for wealthy and suburban family markets.
Using the Spatial.ai: PersonaLive dataset to analyze Carter's trade areas reveals that, on a nationwide level, the company’s captured market has higher shares of wealthy and suburban consumer segments than its potential one. (A chain’s potential market is obtained by weighting each Census Block Group (CBG) in its trade area according to population size, thus reflecting the overall makeup of the chain’s trade area. A business’ captured market, on the other hand, is obtained by weighting each CBG according to its share of visits to the chain in question – and thus represents the profile of its actual visitor base).
Between January and September 2024, the shares of “Wealthy Suburban Families” and “Ultra Wealthy Families” in Carter's captured market stood at 12.5% and 8.9%, respectively – outpacing the company’s potential market shares. This highlights Carter's’ success in attracting these high-income family segments. Meanwhile, households hailing from “Blue Collar Suburbs” were underrepresented in Carter's captured market compared to its potential one. This suggests that, as Carter’s continues to open stores, targeting blue collar suburban areas may pay off for the brand.
Kid-Sized Summary
Carter's is managing not just to survive, but to thrive. After closing stores during the pandemic, the company is back with full force, driving visits and maximizing high-traffic periods.
Will Carter's continue to outpace the wider apparel category during the upcoming holiday season?
Visit Placer.ai to keep up with the latest data-driven retail insights.
This blog includes data from Placer.ai Data Version 2.1, which introduces a new dynamic model that stabilizes daily fluctuations in the panel, improving accuracy and alignment with external ground truth sources.

Albertsons Companies is one of the largest grocery holding companies in the U.S., operating over a dozen regional grocery banners and serving millions of shoppers across the country.
With such a broad presence, the brand caters to a highly diverse customer base – but some overall trends can be observed on a nationwide scale. We took a closer look at the overall visitation patterns the brand experienced in Q3 2024 and dove into the demographics of some of its largest markets.
Holding Onto Gains
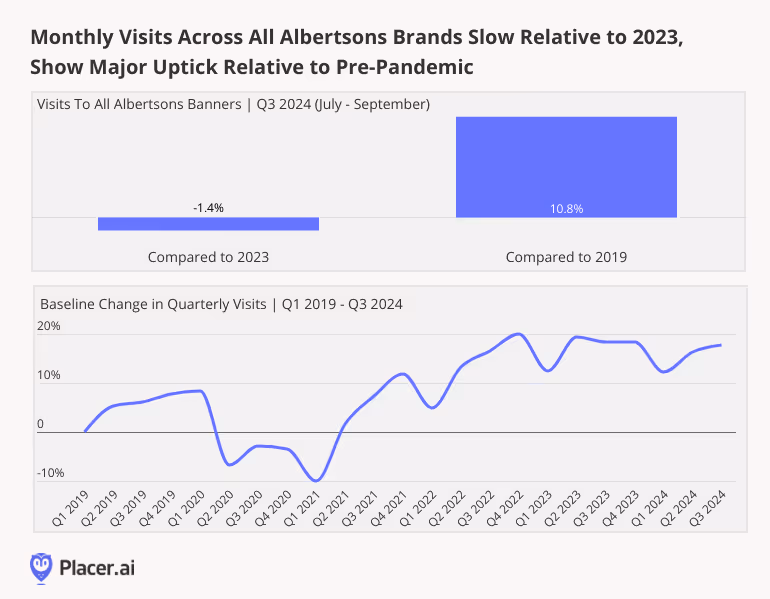
Year over year (YoY), Q3 2024 visits to Albertsons’ banners dropped 1.4% compared to the equivalent period of 2023, possibly reflecting the ongoing financial strain consumers face amid rising grocery prices. Despite this, visits to the company’s chains were significantly higher than pre-pandemic, with Q3 2024 visits up by 10.8% compared to 2019.
Analyzing quarterly visits to Albertsons’ banners relative to a Q1 2019 baseline further highlights the chain’s firm long-term positioning. After dropping during the pandemic, visits increased steadily through Q4 2022 – and have held steady since, despite the challenges facing traditional grocery stores over the past two years. This indicates that even in the face of the growing competition posed by online and value grocers, Albertsons has succeeded in holding onto gains and maintaining its standing within the sector.
Sale Events Drive Traffic Across All Banners
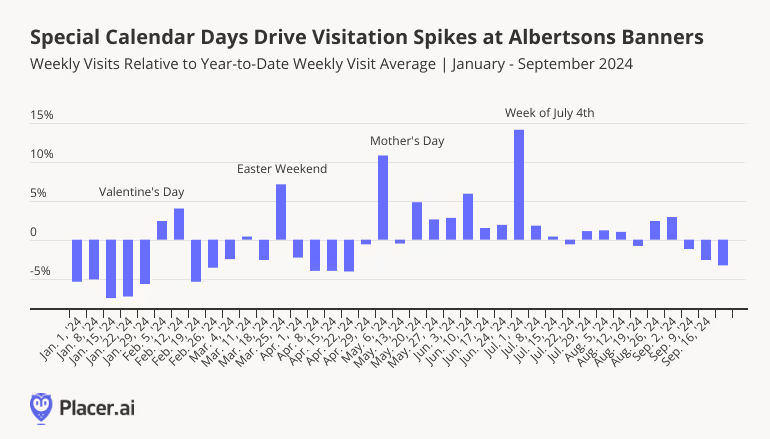
While major holidays like Thanksgiving and Christmas are known for driving grocery visits, other key dates also spark significant foot traffic across Albertsons’ banners. For instance, during the week of July 1, 2024, visits to the company’s portfolio spiked by 14.1% compared to the year-to-date (YTD) weekly visit average, as customers flocked to stores for July 4th weekend supplies.
Mother’s Day also drove significant foot traffic, with visits during the week of May 6, 2024 rising 10.8% above the YTD average. So with Halloween, Turkey Wednesday, and Christmas just around the corner, Albertsons appears poised to enjoy a busy holiday season.
Albertsons’ Customer Base: Wealthier, Suburban Shoppers
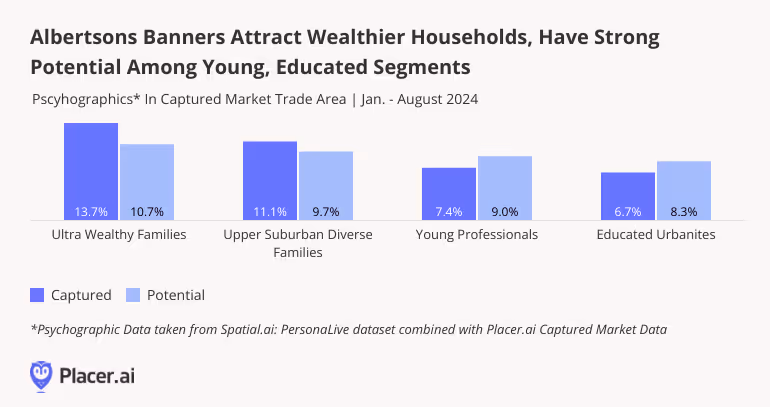
Albertsons’ extensive reach means that it attracts a broad spectrum of consumers, but overall, the company tends to over-index for wealthier and suburban markets.
Using the Spatial.ai: PersonaLive dataset to analyze Albertsons' trade areas reveals that, on a nationwide level, the company’s captured market has higher shares of wealthy and suburban consumer segments than its potential one. (A business’ potential market is obtained by weighting each Census Block Group (CBG) in its trade area weighted according to the size of its population. A business’ captured market, on the other hand, is obtained by weighting each CBG according to its share of visits to the chain or venue in question – and thus represents the profile of its actual visitor base).
During the first eight months of 2024, for example, the share of “Ultra Wealthy Families” in Albertsons’ captured market stood at 13.7%, higher than the company’s potential market share of 10.7%. This suggests that from within the overall trade areas served by Albertsons, the chain is especially successful at attracting this affluent demographic.
On the flip side, consumer groups like “Young Professionals” and “Young Urban Singles” were underrepresented in Albertsons’ captured market compared to its potential one. This signals potential growth opportunities for Albertsons, as they could expand their appeal to younger, city-based segments.
Final Thoughts
Albertsons continues to offer something for everyone, enjoying visit boosts offered by special calendar days and growing its foot traffic relative to pre-pandemic.
For the latest data-driven grocery insights, visit Placer.ai.
This blog includes data from Placer.ai Data Version 2.1, which introduces a new dynamic model that stabilizes daily fluctuations in the panel, improving accuracy and alignment with external ground truth sources.

