

.svg)


Thank you! Your submission has been received!
Oops! Something went wrong while submitting the form.
0
0
0
0
----------
0
0
Articles

Article
Placer Top 5: Cities for Coffee LoversPlacer.ai foot traffic data reveals the top 5 U.S. metros for coffee shop visit growth in H1 2026, led by Orlando, with hotspots across the country.
Lila Margalit
Jul 16, 2026
2 minutes
Article
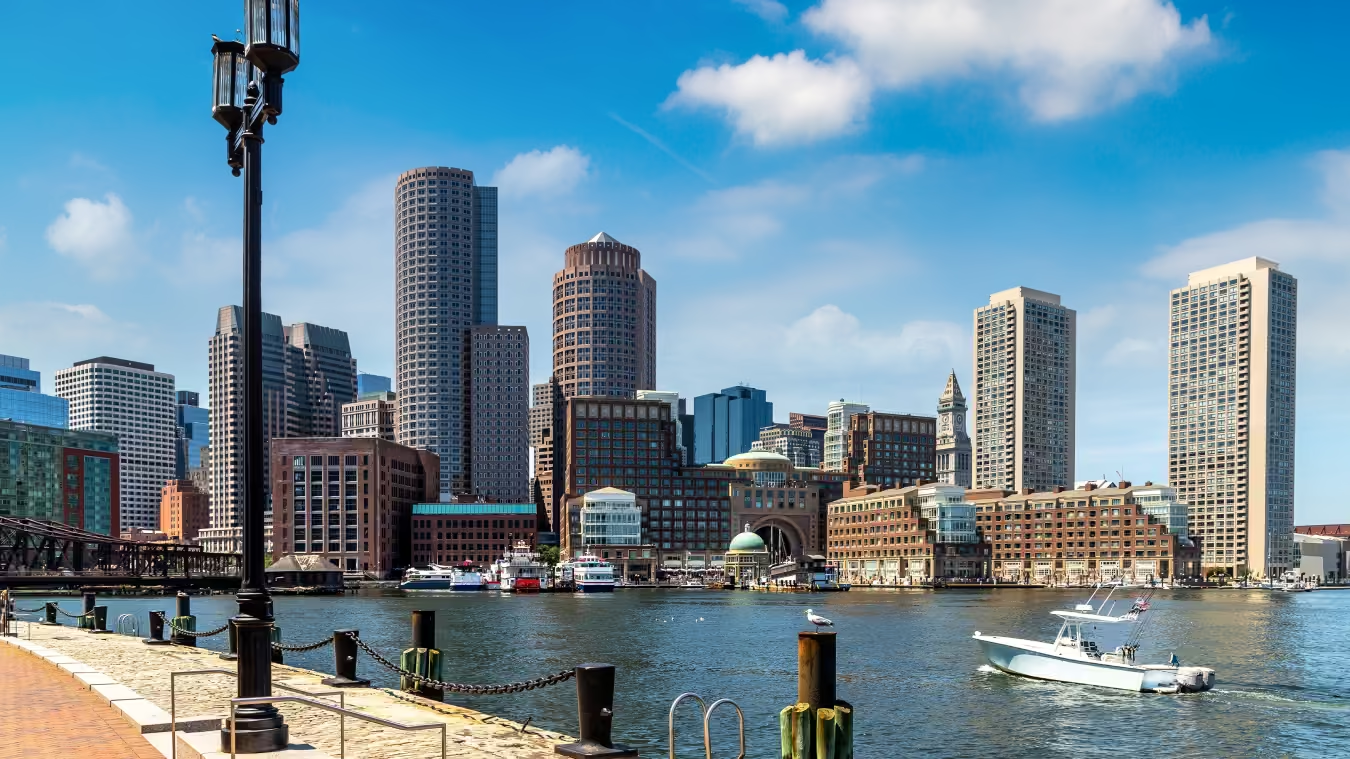
How Placemaking Powers Boston's SeaportAI-powered location intelligence reveals how experiential retail, seasonal programming, and public spaces are fueling foot traffic and attracting affluent consumers to Boston's Seaport
Ezra Carmel
Jul 15, 2026
4 minutes

Article
Q2 2026 ThoughtsExplore the biggest retail trends from Q2 2026, from World Cup-driven visits and home improvement headwinds to Shein's expansion and rising gas prices.
Ethan Chernofsky
Jul 14, 2026
4 minutes
%20(1).avif)
Article
June 2026 Placer.ai Office Index: A New Post-Pandemic Attendance HighJune 2026 office visits rose 8.5% YoY and hit a post-pandemic high per working day. Miami topped its 2019 baseline; every major market grew YoY
Lila Margalit
Jul 13, 2026
3 minutes
.avif)
Article
Retail Corridors Emerge as Evening Destinations in 2026US retail corridor traffic stalled in early 2026 as weekday daytime visits lagged, while Friday and Saturday evenings fully recovered past 2019 levels.
Ezra Carmel & Lila Margalit
Jul 9, 2026
3 minutes
%20(1).avif)
Article
Placer.ai June 2026 Mall Index: Momentum Heading Into H2 2026Placer.ai's June 2026 Mall Index finds sustained foot traffic growth across all mall formats, with open-air centers leading and shopper demographics broadening heading into H2 2026.
Shira Petrack
Jul 8, 2026
Reports
.avif)
INSIDER
Report
The Forces Shaping Consumer Traffic in 2026Explore how higher gas prices, the search for value, and nostalgia-driven demand shaped consumer traffic and behavior in H1 2026.
July 27, 2026
.avif)
INSIDER
Report
Dining In 2026: All Roads Lead To ValueHow shifting consumer priorities are reshaping value perceptions across QSR, fast casual, and casual chains.
July 9, 2026

INSIDER
Report
Migration After the Boom: Where Americans Are Moving in 2026Find out where Americans are moving in 2026, why they're relocating, and how developers, investors, and retailers can stay ahead of the trends.
June 18, 2026
Show More
1 / 24
Loading results...
We couldn't find anything matching your search.
Browse one of our topic pages to help find what you're looking for.
For more in-depth analyses on a variety of subjects, explore Reports.
For more in-depth analyses on a variety of subjects, explore Reports.

INSIDER
Stay Anchored: Subscribe to Insider & Unlock more Foot Traffic Insights
Gain insider insights with our in-depth analytics crafted by industry experts
— giving you the knowledge and edge to stay ahead.

