Crocs’ rebrand from ugly to chic is one of retail’s most fascinating Cinderella stories (glass clog, anyone?). We dive into the latest location analytics and demographic data to explore the consumer behavior that drives Crocs’ continued success.
Ezra Carmel
Apr 17, 2024
3 minutes
Crocs’ rebrand from ugly to chic is one of retail’s most fascinating Cinderella stories (glass clog, anyone?). We dive into the latest location analytics and demographic data to explore the consumer behavior that drives Crocs’ continued success.
Partnerships and Pandemic Popularity
Embarking on a journey to become a fashionable brand, in 2017 Crocs inked a partnership with Christopher Kane who became the first designer to collaborate with the brand. A stampede of designer and celebrity-inspired styles followed in 2018 and 2019 including Balenciaga's iconic ten-inch platform Croc and Post Malone's take on the classic clog.
During the pandemic, Crocs built on its success in fashion and celebrity circles, and gained a new following from comfort-first shoe shoppers stuck at home or running errands.
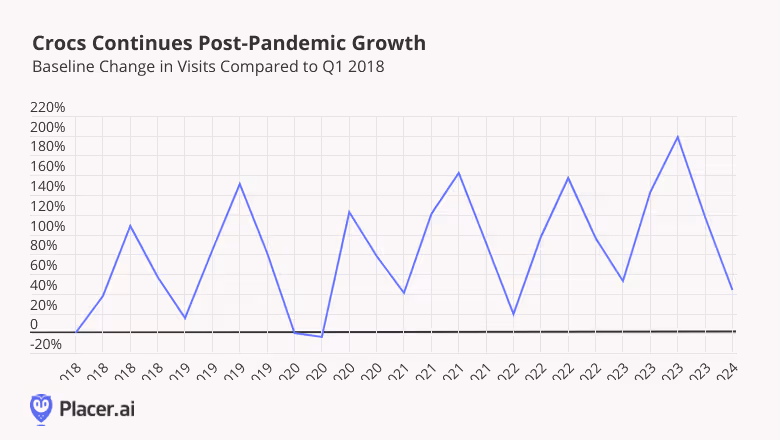
Taking a wide lens on Crocs’ foot traffic since 2018 shows how a strategy of designer partnerships as well as recognition as a functional shoe drives visits to the brand. In 2018 and 2019, as designer Crocs rolled out, visits to the brand climbed to new heights.
And since the wider retail reopening in 2021, Crocs’ foot traffic growth has accelerated as comfort reigns supreme in and out of the home.
Compared to a Q1 2018 baseline, Crocs saw its largest monthly visit peak in Q3 2023 (199.1%) – the critical summer period. And foot traffic in the most recent Q1 2024 was 43.7% above the Q1 2018 baseline. This indicates that the shoe’s acceptance within pop-culture combined with demand for comfortable footwear is elevating the brand’s traffic to new levels.
Real Estate Strategy Helps ‘Democratize’ the Brand
As Crocs continues to gain traction, the company appears to be pursuing a real estate strategy aimed at repositioning the brand as an affordable shoe for the whole family. Although Crocs shrank its store count in the years leading up to the pandemic, the brand has now begun opening new locations in outlet malls – five in 2023, with plans for 30 new stores in outlet malls in 2024.
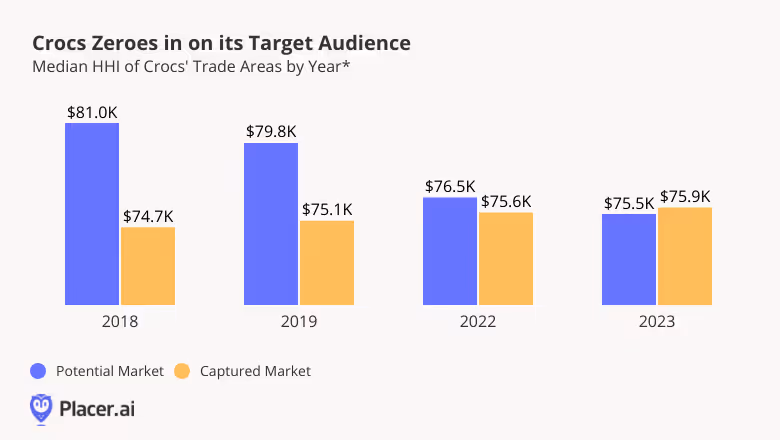
Analyzing Crocs’ trade areas between 2018 and 2023 suggests that this strategy is helping the brand reach its audience. According to the STI: Popstats 2023 dataset, in 2018, there was a gap of more than $6K between the median household income (HHI) in Crocs’ potential market ($81.0K/year) and in its captured market ($74.7K/year). But by 2023, the median HHI of the brand’s potential market ($75.5K) and captured market ($75.9K) had more closely aligned. This indicates that by opening stores in outlet malls – where consumers looking for discounts are likely to shop – Crocs’ potential market more closely reflects its actual visitors and the brand can drive additional traffic from its target audience.
Happily Ever After
From humble beginnings, Crocs have become runway-famous. And yet, the clogs are more popular than ever with the everyday consumer – at home or out on the town. How will Crocs shape the next chapter of this foam fairytale?
This blog includes data from Placer.ai Data Version 2.0, which implements improvements to our extrapolation capabilities, adds short visit monitoring, and enhances visit detection.
Final Four Weekend, when the NCAA "March Madness" basketball tournaments culminate with a championship game, took place between April 4th and 7th. Who attended these events? We take a look at the location analytics and audience segmentation of visitors to find out.
Ezra Carmel
Apr 16, 2024
5 minutes
Final Four weekend capped off the NCAA “March Madness” basketball tournaments with a full schedule of fan experiences on both the men’s and women’s sides of the ball.
The Women’s Final Four took place between April 4th and 7th, 2024 in Cleveland, Ohio with on-court action at Rocket Mortgage FieldHouse. “Tourney Town” – an interactive basketball exhibition – ran concurrently at the Huntington Convention Center.
The Men’s Final Four commenced on April 5th at State Farm Stadium in Glendale, Arizona, culminating with the championship game on April 8th. The multi-day exhibition “Final Four Fan Fest” took place at the Phoenix Convention Center.
We dove into the location analytics and audience segmentation for visitors to several Final Four events to better understand the fans in attendance throughout the tournament weekend.
Locals and Tourists Have Event Preferences
The men and women’s Final Four weekend attracted spectators from near and far, with each event attracting a unique mix of out of town tourists and locals.
Both men and women’s championship games attracted a relatively large share of out-of-town guests, likely due to the excitement surrounding a national title game. Analysis of visitors by home location revealed that the men and women’s championship games had the smallest share of visitors from less than 100 miles away – 29.8% and 33.3% respectively. In other words, these two events had the largest share of visitors that lived more than 100 miles from the venues.
The men’s open practice appeared to be more popular with long-distance travelers than the women’s, perhaps because all four men’s teams participated – as opposed to just two at the women’s open practice. The men’s practice was also followed by an all-star game which likely increased its appeal for visitors traveling from afar in the hopes of spotting their favorite players. The data revealed that more than half of the spectators traveled over 250 miles to watch the men’s practice, as opposed to under a quarter of spectators for the women’s practice.
Meanwhile, the women’s experiential exhibition at Huntington Convention Center drew more out-of-towners than the men’s exhibition at Phoenix Convention Center – only 23.3% of visitors to the women’s exhibition came from under 30 miles away, compared to almost half (48.3%) of the men’s exhibition visitors. The larger share of out-of-town visitors to the women’s exhibition may be because the event was close to the arena, making it a more convenient stop for non-local fans. On the other hand, the distance between the men’s exhibition in downtown Phoenix and the stadium in Glendale meant that the off-court experience was more out-of-the-way for tourists who had traveled specifically for the on-court action.
Wealthy Fans Dominate the Men’s Game
Analysis of Final Four visitors by income level provides further insight into the differences between each event’s fan base. According to the STI: Popstats dataset, the women’s events generally drew visitors from areas with a lower median household income (HHI) compared to the men’s events, although the gaps between the men and women’s visitor bases varied from event to event. Some of the difference in trade area HHI may be due to regional variance and the mix of locals and tourists at each event.
The visitor bases of the men and women’s championship games exhibited the widest disparity, with the men’s championship spectator base coming from areas with a median HHI of $99.9K, compared to $74.6K for the women’s championship’s trade area. The difference may be due to the relatively higher face value of tickets to the men’s championship game – even though the star-power of Iowa’s Caitlin Clark drove up the price of women’s tickets on the secondary market. In contrast, both the men’s and women’s practices and exhibitions were free or nearly free events and drove traffic from relatively lower-income areas – even though visitors to the men’s practice still came from more affluent areas than the trade area of the women’s championship match.
Visitors to the men and women’s convention center exhibition displayed the smallest income differences, with respective trade area median HHI of $80.0K and $76.6K. The data also reveals that visitors to the women’s exhibition came from a trade area with a median HHI that was higher than the median HHI for both the championship game and the open practice, perhaps because the exhibition drew a relatively large share of tourists who could afford to be in town for a slightly longer stay.
Single Fans En Masse at Women’s Events
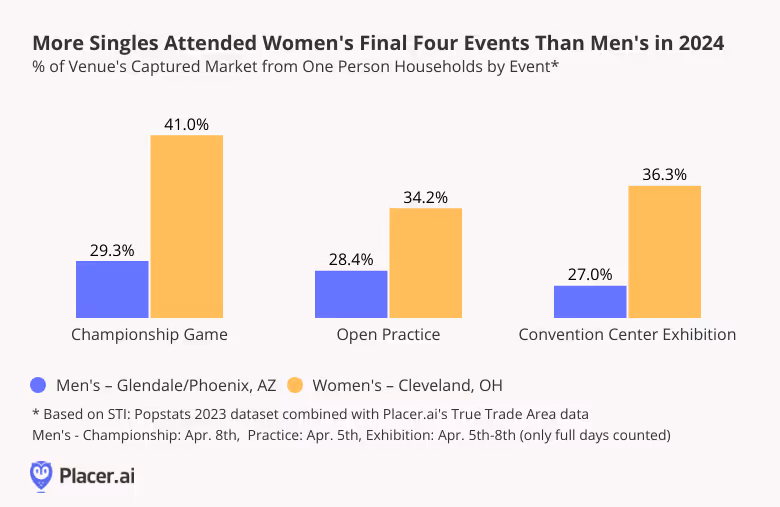
Further demographic analysis indicates that a greater share of singles – who tend to be on the younger side – attended the women’s Final Four events than the men’s. During the women’s championship, 41.0% of households in the trade area of the Rocket Mortgage FieldHouse were made up of one-person households. This segment also made up 34.2% and 36.3% of the households in the trade areas of the venues for the women’s practice and exhibition, respectively. On the men’s side, singles comprised just 29.3% of the championship’s trade area, 28.4% of the practice’s, and 27.0% of the exhibition’s.
This reflects the growing popularity of women’s college basketball players on social media which is bringing more viewership to the sport.
Want more data-driven visitor insights for sporting events? Visit Placer.ai.
This blog includes data from Placer.ai Data Version 2.0, which implements improvements to our extrapolation capabilities, adds short visit monitoring, and enhances visit detection.
Last week's solar eclipse brought people from all over the country to witness the natural phenomenon. How did the event impact business activity on the ground? Which sectors benefited from the hype – and which geographic areas saw the biggest visit spikes? We dove into the data to find out.
Lila Margalit and Noam Maman
Apr 15, 2024
3 minutes
During last week’s solar eclipse, people from all over the country converged on cities within the path of totality to witness the excitement first hand. And for municipalities and local businesses, the influx of tourists was expected to generate a boon.
But just how did the celestial event impact business activity on the ground? Which sectors benefited from the hype – and which geographic areas saw the biggest visit spikes?
We dove into the data to find out.
Key Takeaways
Hotels in CBSAs located along or near the path of totality experienced significant visits increases on the day of the solar eclipse – with Danville, IL taking the lead among metropolitan areas.
Fast Food & QSR chains in and around the path of totality also saw meaningful visit boosts.
Brands nationwide, including Warby Parker, SONIC Drive In, and Krispy Kreme Doughnuts drove visit increases with special deals and limited-time offers.
Lodging in the Path of Totality
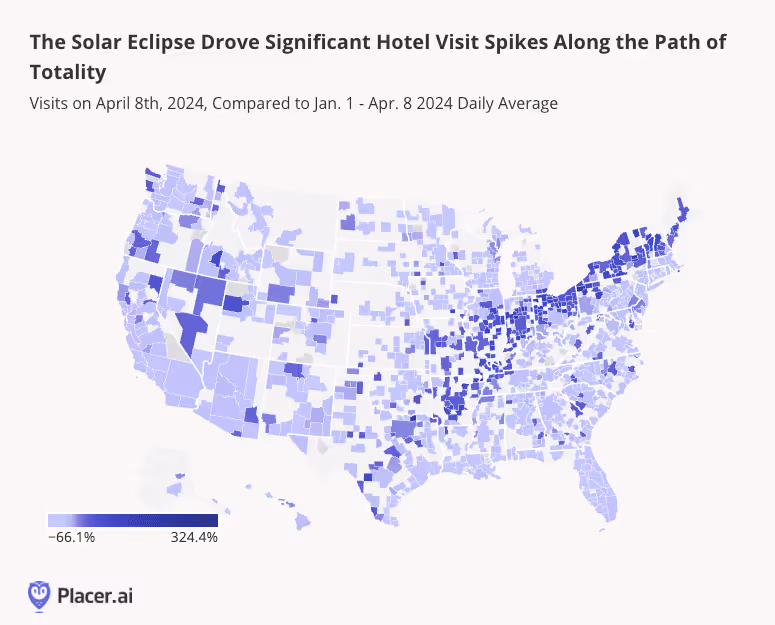
On April 8th, 2024, hotels in CBSAs where the eclipse could be viewed in all its glory (or close to it) experienced major visit boosts. And mapping hotel visits on the big day to CBSAs nationwide – compared to year-to-date daily averages – shows just how significant the cosmic alignment was for areas lucky enough to be located along or near the path of totality.
Within metropolitan CBSAs (CBSAs with at least 50,000 residents), Danville, IL – where visitors could either view a near-total eclipse or drive to a nearby location with 100% totality – experienced the biggest jump in Hotel visits, with visits to the category up 111.3%. But urban centers from north to south – including in New York, Indiana, Ohio, Arkansas, and Missouri – also experienced substantial hotel visit spikes.
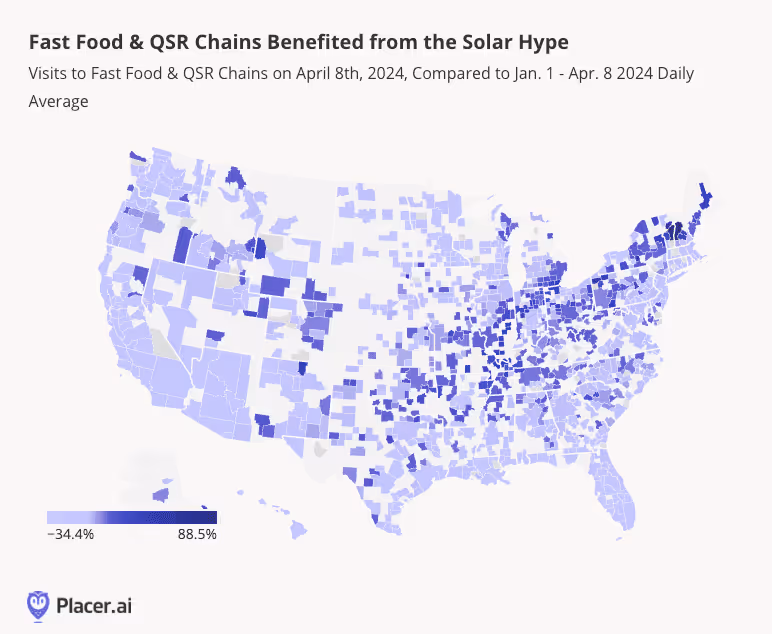
Solar-Powered Fast Food
Hotels weren’t the only locations to reap the rewards of the solar eclipse. Fast Food & QSR chains in and around the path of totality enjoyed meaningful April 8th visit spikes of their own. And while the Hotel visit increases were more closely concentrated in prime viewing areas, Fast Food & QSR visits increased along a wider radius as people likely grabbed a bite to eat while making their way to a sun-gazing hotspot.
Out-of-This-World Visit Increases
And the impact of the solar eclipse wasn’t limited to locations located in or near the path of totality. Retailers and dining chains nationwide got in on the action with special deals and limited-time offers meant to make the most of the unique interstellar opportunity.
In the week leading up to April 8th, 2024, Warby Parker drew crowds with the promise of free solar eclipse glasses. And while a burger joint may not be the first place people associate with eyewear, fast food favorite SONIC Drive In also attracted astronomy aficionados with a limited-time Blackout Slush Float that came with free eclipse viewing gear.
Krispy Kreme Doughnuts, for its part, marked the occasion with a limited-edition Total Solar Eclipse Doughnut. And though Mondays aren’t typically busy days for the chain, the special offering produced a clear visit uptick nationwide. In states along the path of totality, Krispy Kreme visits were up 55.5% on April 8th when compared to an average Monday this year, and in the rest of the country they were up 33.9%.
Astronomical Opportunities Ahead
For retailers across categories, landmark events from movie launches to cosmic occurrences have the potential to drive visit spikes and generate business. What other big opportunities lie in store for retailers this year?
This blog includes data from Placer.ai Data Version 2.0, which implements improvements to our extrapolation capabilities, adds short visit monitoring, and enhances visit detection.
This year’s March Madness really lived up to its name, buoyed by the star power of Caitlin Clark, Angel Reese, Paige Bueckers, and Juju Watkins driving viewership to new heights. For the first time in history, the NCAA women’s basketball title drew more viewers than the men’s at 18.9M for the women’s and 14.8M for the men’s, per Nielsen.
Tickets to the Final Four cost $532 on average, an 82% increase over last year, and for the championship game, Rocket Mortgage Fieldhouse Stadium in Cleveland, OH was packed to the gills.
In the days leading up to the women’s final, nearby hotels saw visits increase as well.
Last week, we took a look at where the retail sector stood after Q1 2024, with a focus on superstores, home improvement, athletic footwear and apparel, and beauty. This week, to mark the release of short visit data with Placer’s Data Version 2.0 (which better captures visits that lasted 1 minute or longer for QSR/drive-thru locations) and the publishing of our latest dining whitepaper (The QSR Dining Advantage), we thought we’d take closer look at where the restaurant sector stands after Q1 2024.
When we looked at the restaurant category in January, most chains were reporting that visits were down on a year-over-year basis (which was partly a byproduct of inclement weather across much of the country) but that there was a sense of optimism about 2024. Looking at trends by category, we see that operators were justified in this optimism, as visit trends have increased on a year-over-year basis for most categories since late January. After adjusting for calendar shifts for both Valentine’s Day and Easter, we also see strong fine dining visits for these holidays, indicating that consumers remain motivated by holiday and events (a theme we called out several times last year).
We’ve also been fielding several questions about daypart shifts given that the Placer.ai Nationwide Office Building Index (an index of data from some 1,000 office buildings across the country) continued to show an uptick in visits during March 2024 and now stands at about 67.3% of March 2019 visits. Below, we show the percentage of visits by daypart for quick-service restaurant (QSR) and full-service restaurant chains. Given the lift in office visits, it’s not surprising that we continue to see improvement in early morning (6:00 AM-9:00 AM) visits, but it’s notable that we continue to see strength in late morning (9:00 AM-12:00 PM) and afternoon (3:00 PM-6:00 PM) visits. We’ve already seen many QSR chains test new menu items that better address consumer preferences in these dayparts–McDonald's CosMc’s is just one example--and we’d expect more in the months ahead. We also continue to see strength in late night QSR visits, something that we’ve called out in the past. On the full-service dining front, we see 2023 visits still down compared to 2019 levels, but with improvement versus 2021 in most cases. Here, it’s interesting that the afternoon visits to full-service dining chains in 2023 is down only slightly compared to 2019, while the gap during the evening daypart is much wider. This reinforces some of our previous analyses on earlier dining times
With our Data Version 2.0 update, we can now more accurately monitor dwell time by restaurant channel. After bottoming-out in Q2 2020 as most chains shifted to a largely takeout model, we’ve seen dwell time steadily increase across most restaurant channels the past several years. The QSR and fast casual categories remain below pre-pandemic levels, which isn’t a surprise given an increase in drive-thru and takeout orders compared to 2019 levels. Still, some of the operators we’ve spoken to have indicated that drive-thru bottlenecks have become more of an issue in recent quarters, which may reflect in the increase in dwell times for the QSR category the past 4-5 quarters. On the other side of the spectrum, dwell time for casual dining chains has fully recovered. We believe this has been helped by the continued popularity of eatertainment concepts, which have almost twice the average dwell time as most casual dining chains. We also see that fine dining dwell time now exceeds pre-pandemic levels, which may be the result of consumers’ aforementioned focus on holiday/event dining, which tends to drive dwell times higher.
Restaurant chains still face obstacles–the spread between food at home (grocery prices) and food away from home (restaurant prices) remains high and the $20 minimum wage for QSR workers recently went into effect in California (our data does not indicate major visit changes going into effect as it may be too recent for behavioral changes to be noticeable). However, March and early April visitation trends help the optimism that many restaurant operators felt at the beginning of the year. With Panera (and other chains) evaluating a possible IPO and many other brands finally accelerating growth plans (with an increased emphasis on higher-growth markets in the Southern/Southeastern U.S.), we’d expect visitation trends to remain positive on a year-over-year basis in the months to come.
Say the word New Mexico and one might picture the stunning cliff dwellings at Bandelier Monument, rich troves of Native American Pueblo culture, or the stunning artworks of Georgia O’Keefe. This vibrant state’s largest city is Albuquerque, but Santa Fe also lays claim to fame by being the oldest state capital in the United States.
In Albuquerque, a large development is taking place centered around the Indian Pueblo Cultural Center. While one may be a bit surprised at its location, which is within an outdoor shopping center, it serves as a perfect anchoring point for a convention or a leisure trip. The museum features insights into 19 Pueblo cultures, and also hosts an authentic Indian kitchen where one can try indigenous favorites such as red chile beef stew, calabacitas, and assorted fruit pies. There is a Holiday Inn Express & Suites and a Towneplace Suites by Marriott just across the street for those who need accommodations. Meetings, parties, and events can be held onsite with particularly memorable experiences to be had in the outdoor arena and fire pit. One can even hold a wedding at the venue. And in a sign of the convenience store trend we are seeing towards localization, Four Winds offers a walk-in humidor with cigar selection, the ability to fill a growler with local craft beers, and an assortment of food, beer, wine, liquor, and tobacco.
Further afield, an hour away in Santa Fe, visitors flock to the galleries galore, restaurants and bars like Coyote Cantina, or simply enjoy an ice cream while people watching at Santa Fe Plaza. One of the highlights for opera lovers around the world is coming to Santa Fe Opera House during its season, which runs from the end of June to the end of August. Here, one can enjoy the unique open-air aspect of the opera house while sobbing along to the sad fate of Violetta in La Traviata.
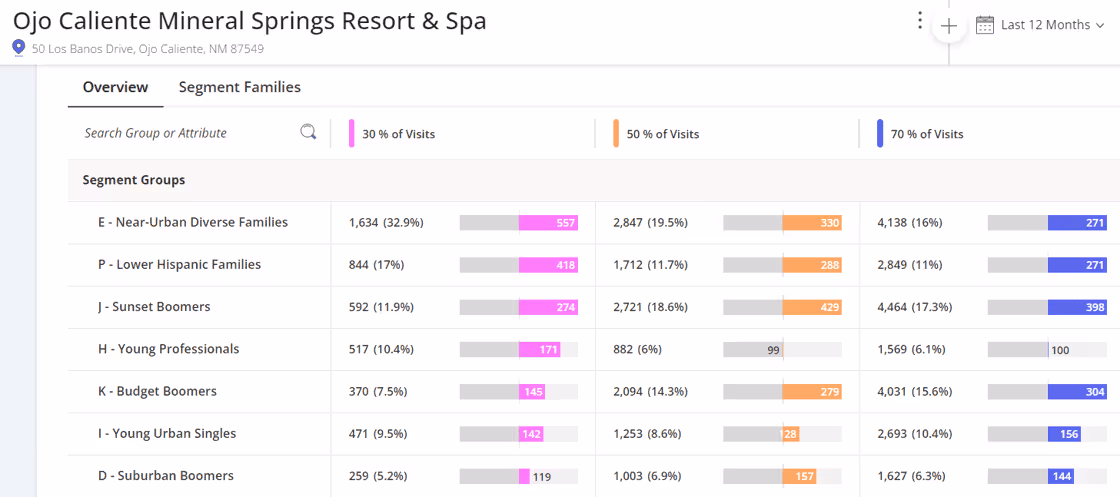
Junior Rangers might enjoy exploring Carlsbad Caverns, Aztec Ruins National Monument, or venture to Petroglyph National Monument. Adults seeking R&R can ski the day away in Taos or opt for a therapeutic visit to Ojo Caliente Mineral Springs Resort & Spa. A review of the resort describes it as “Just you, the blue New Mexico sky, peace and quiet.” Add to that a massage or spa treatment, and it sounds like just what the doctor ordered.
One of the major employers in New Mexico is Los Alamos National Laboratory. A visit to the National Historic Park there will take you on an intriguing journey of key sites that were relevant to the Manhattan Project. Between last summer’s Oppenheimer blockbuster and current global sensation The Three-Body Problem fanning interest in cutting-edge science, this is a must-see location.


.svg)


.avif)
.avif)