In today’s retail landscape, consumer behavior is influenced by a multitude of factors, directly impacting the success of products and brands. This report explores the latest trends in value perception, shopping behavior, and media consumption that impact which brands consumers are most likely to engage with – and how.
Demand for Value and the Perfect Piece
In the apparel space, consumers continue to prioritize value and unique merchandise.
Thrift and Off-Price Shopping Appeals to Diverse Audience Segments
Analysis of visits to various apparel categories reveals a steady increase in the share of visits going to off-price retailers and thrift stores at the expense of traditional apparel chains.
And the popularity of off-price chains and thrift stores appears to be widespread across multiple audience segments. Analyzing trade area data with the Experian: Mosaic psychographic dataset reveals a clear preference for second-hand retailers among both younger (ages 25-30) and older (51+) consumer segments. Meanwhile, middle-class parents aged 36-45 with teenagers – the “Family Union” segment – are significantly more likely to shop at off-price apparel stores, highlighting their emphasis on buying new, while saving both time and money.
This suggests that the powerful blend of treasure-hunting and deep value, central to both the off-price and thrift experiences, is driving traffic from a variety of audiences, and that other industries could benefit from combining affordability with the allure of unique products.
Consumers Shop a Mix of High-End and Budget Retailers, Balancing Cost and Quality
Diving deeper into the location intelligence for the apparel space further highlights thrift and off-price’s broad appeal – and that a combination of quality and price motivates consumers to visit different retailers.
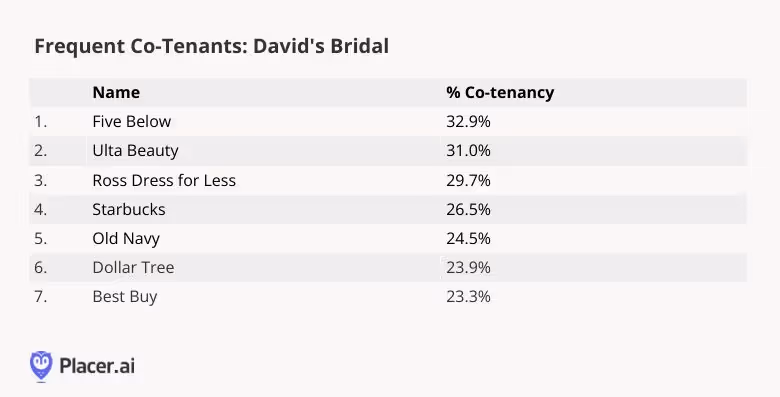
Between 2019 and 2024, the share of Bloomingdale’s, Saks Fifth Avenue, Neiman Marcus, and Nordstrom visitors that also visited a Goodwill or Ross Dress for Less increased significantly.
And while this could mean that the current economic climate is causing some higher-income consumers to trade down to lower-priced retailers, it could also be that consumers are prioritizing sustainability and seeking value in terms of “bang for their buck” – shopping a combination of retailers depending on the cost versus quality considerations for each purchase.
Flexible Consumerism on the Rise
Consumers increasingly expect to shop on their own terms, opting for a more flexible shopping experience that blurs the lines between traditional retail channels and categories.
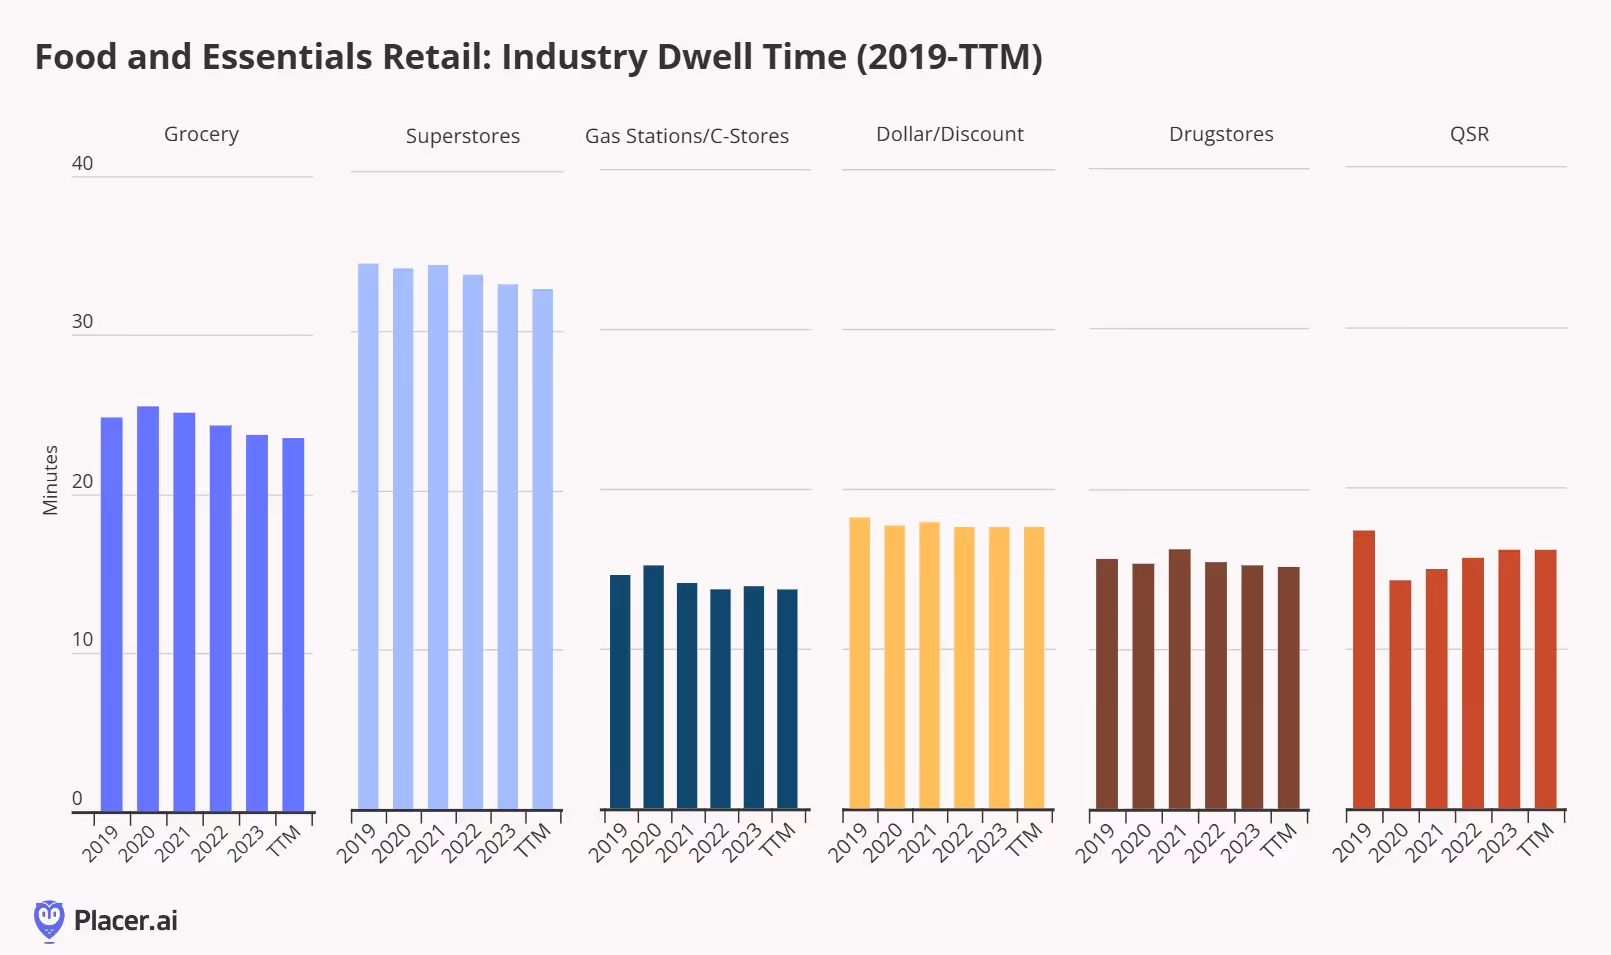
Superstores as Quick-Visit Destinations
Superstores and warehouse stores, for example, often evoke the image of navigating aisle after aisle of nearly every product imaginable – a time-consuming endeavor given the sheer size of their stores. But the latest location intelligence shows that more consumers are turning to these retailers for super-quick shopping trips.
Between 2019 and 2024, the share of visits lasting less than ten minutes at Target, Walmart, BJ’s Wholesale Club, Sam’s Club, and to a lesser extent Costco, rose steadily – perhaps due to increased use of flexible BOPIS (buy online, pick-up in-store) and curbside pick-up options. These stores may also be seeing a rise in consumers popping in to grab just a few items as-needed or to cherry-pick particular deals to complement their larger online shopping orders.
This trend highlights the demand for frictionless store experiences that allow visitors to conveniently shop or pick up orders even at large physical retailers.
Finding Quick Eats Outside of the Quick-Service Category
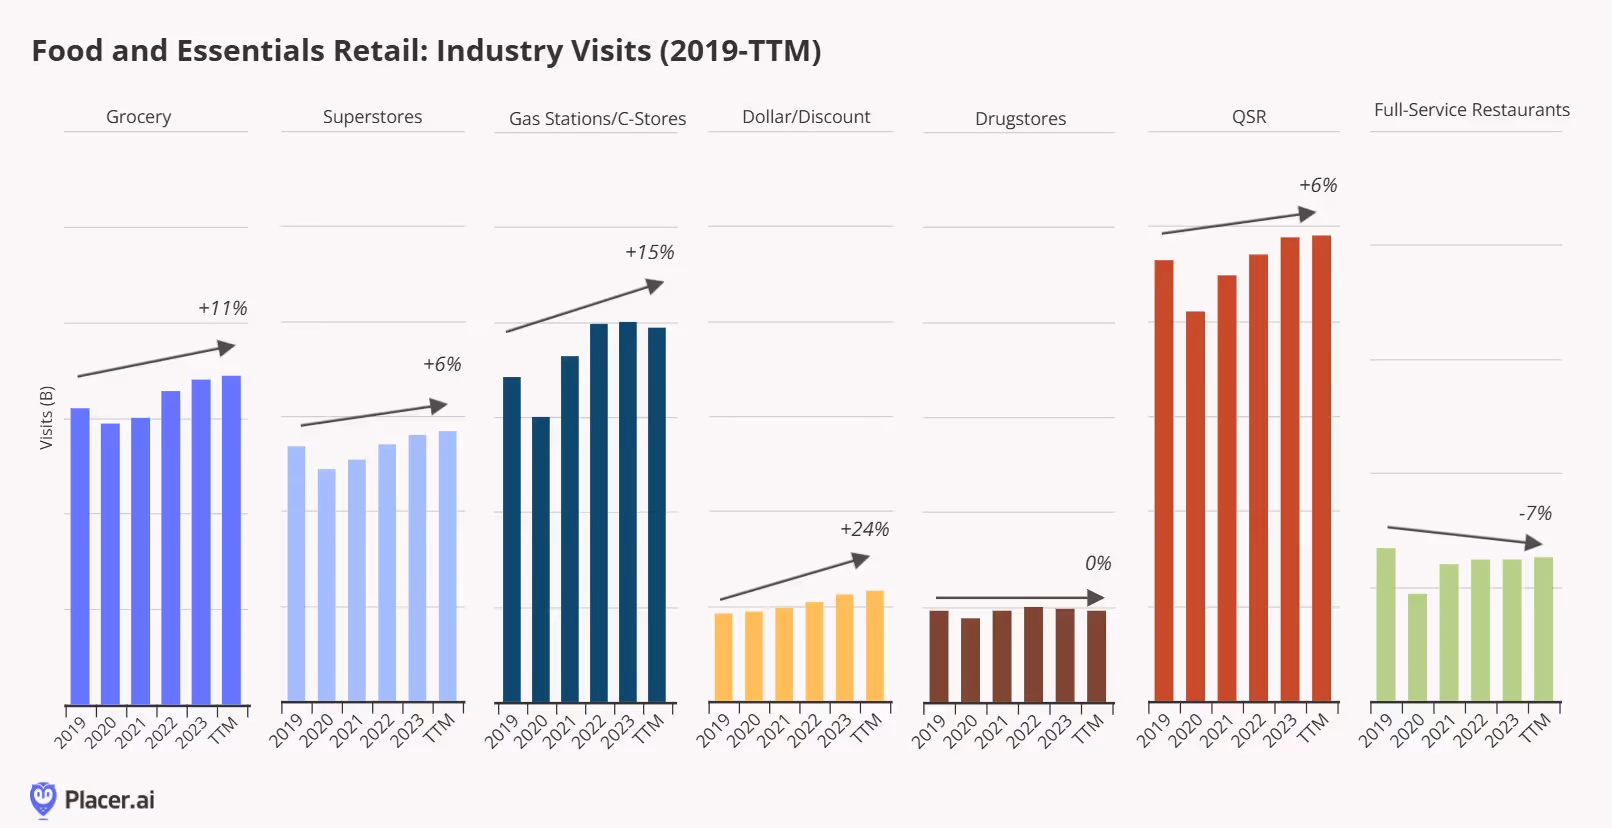
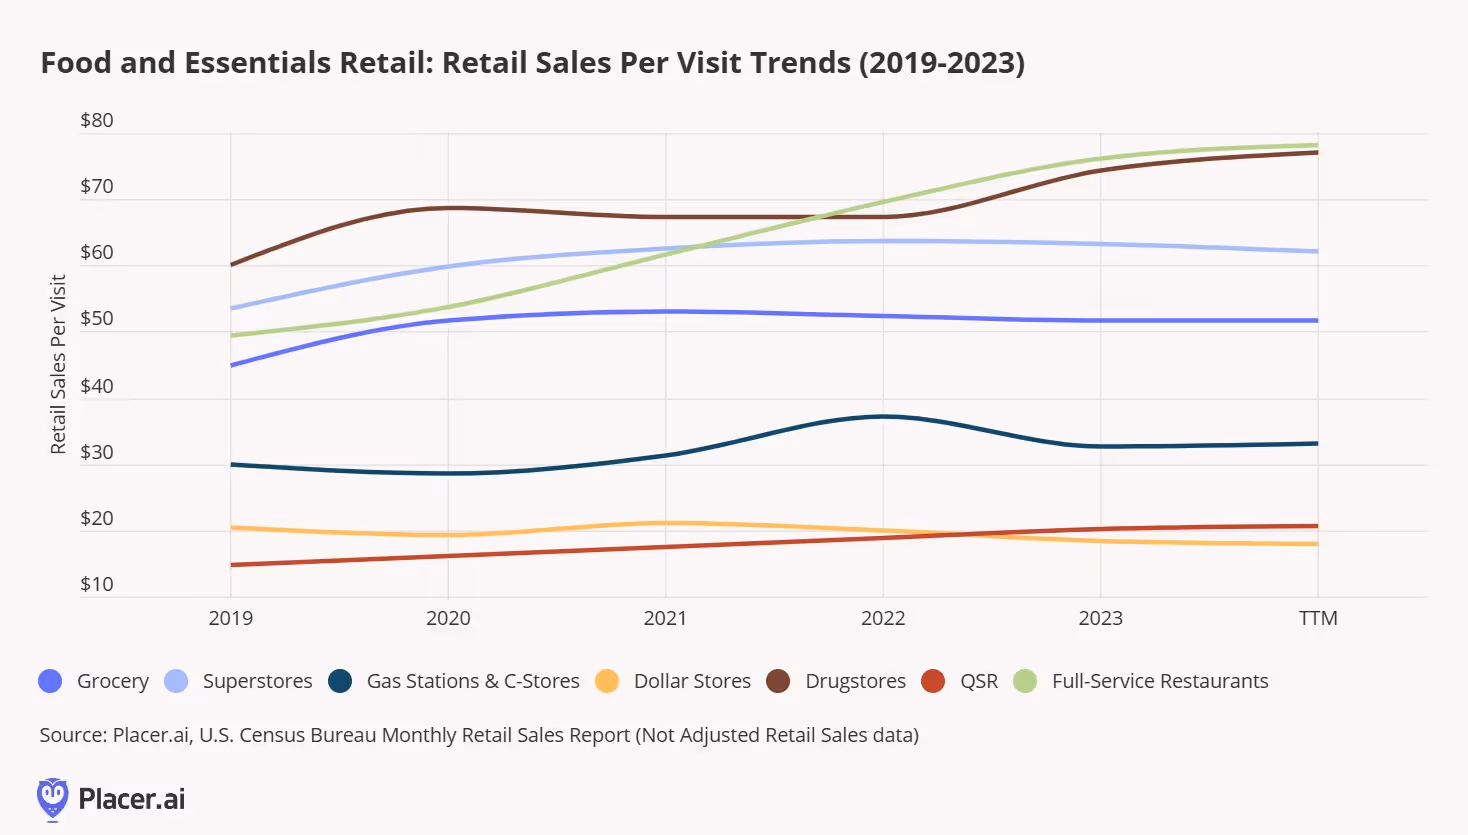
And the breaking down of traditional retail silos isn’t limited to big-box chains. Diving into the data for quick service restaurants (QSR), fast casual chains, and grocery stores indicates that more consumers are also looking for new ways to grab a convenient bite.
Since 2019, grocery stores have been claiming an increasingly large share of the midday short visit pie – i.e. visits between 11:00 AM 3:00 PM lasting less than ten minutes – at the expense of QSR chains. This suggests that consumers seeking quick and affordable lunches are increasingly turning to grocery stores to pick up a few items or take advantage of self-service food bars. Notably, the rise in supermarket lunching hasn’t come at the expense of fast-casual restaurants, which have also upped their quick-service games – and have seen a small increase in their share of the quick lunchtime crowd over the past five years.
While some of QSR’s relative decline in short lunchtime visits could be due to discontent with rising fast-food prices, it’s clear that an increasing share of consumers see grocery and fast-casual chains as viable options during the lunch rush.
Tapping into Trends Amplifies Brand Success
In 2025, tapping into hot trends and creating viral moments are among the most powerful tools for amplifying promotions and driving foot traffic to physical stores.
Pop Culture Collabs Drive Customer Engagement
Retailers across categories have successfully harnessed the power of pop culture collaborations to generate excitement – and visits – by leaning into trending themes. On October 8th, 2024, for example, Wendy’s launched its epic Krabby Patty Collab, inspired by the beloved SpongeBob franchise. And during the week of the offering, the chain experienced a remarkable 21.5% increase in foot traffic compared to an average week that year.
Similarly, Crumbl – adept at creating buzz through manufactured scarcity – sparked a frenzy with the debut of its exclusive Olivia Rodrigo GUTS cookie. Initially available only at select locations near the artist’s concert venues, the cookie was launched nationwide for a limited time from August 19th to 24th, 2024. This buzz-driven release resulted in a 27.7% traffic surge during the week of the launch, as fans rushed to get a taste of the star-studded treat.
And it’s not just dining chains benefiting from these pop-culture moments. On February 16th, 2025, Bath & Body Works launched a Disney Princess-inspired fragrance line, perfect for fans of Cinderella, Ariel, Belle, Jasmine, Moana, and Tiana. The collaboration resonated, fueling a 23.2% visit spike for the chain.
Trend-Setting Promotion Drives Visits to Cinemark
While tapping into existing pop-culture trends has the ability to drive traffic, so does creating a new one. Analysis of movie theater visits on National Popcorn Day (Sunday, January 19th, 2025) shows how initiating a trend can spur social media engagement and impact in-person traffic to physical retail spaces.
National Popcorn Day was a successful promotional holiday across the movie theater industry in 2025. Both Regal Cinemas and AMC Theatres offered popcorn-based promotions on the day, but Cinemark’s “Bring Your Own Bucket” campaign, in particular, appears to have spurred a significant foot traffic boost during the event.
Visits to Cinemark on National Popcorn Day in 2025 increased 57.5% relative to the Sunday visit average for January and February 2025, as movie-goers showed off their out-of-the-bucket popcorn receptacles on social media. Clearly, by starting a trend that invited creativity and expression, Cinemark was able to amplify the impact of its National Popcorn Day promotion.
The 2025 Consumer
Location intelligence illuminates some of the key trends shaping consumer behavior in 2025. The data reveals that value-driven shopping, demand for flexibility across touchpoints, and the power of unique retail moments have the power to drive consumer engagement and the success of retail categories, brands, and products.


.svg)


.avif)