Eatertainment chains – entertainment concepts that combine dining and play – are thriving in the current experience economy. We dove into the data for game and restaurant chains Dave & Buster’s and Main Event Entertainment to better understand how eatertainment is driving success in 2024.
Ezra Carmel
May 30, 2024
3 minutes
Eatertainment chains – entertainment concepts that combine dining and play – are thriving in the current experience economy. We dove into the data for game and restaurant chains Dave & Buster’s and Main Event Entertainment (acquired by Dave & Buster’s in 2022) to better understand how eatertainment is driving success in 2024.
Year-Over-Year: Reasons to Cheer
The past few years have been challenging ones for restaurants. But eatertainment has a special draw – and since November 2023, both Dave & Buster’s and Main Event Entertainment have seen mainly positive YoY visit growth.
In January 2024, visits slowed in the wake of extreme weather that rocked much of the country and led many would-be diners to stay home. But in February and March 2024 things picked up again, with the two chains seeing YoY visit growth ranging from 4.6% to 10.6%.
Again in April 2024, both Dave & Buster’s and Main Event Entertainment experienced minor visit gaps. But a closer look at weekly visits reveals that this was largely due to a calendar shift: April 2024 had one fewer Saturday than April 2023 – the chains' busiest day of the week by far. (In Q1 2024, Saturdays accounted for 33.8% of total visits to Main Event Entertainment and 33.3% of visits to Dave & Buster’s). And during nearly every individual week of April 2024, the brands maintained strongly positive momentum.
Feeling Special(s): Cultivating Loyal Audiences
Dave & Buster’s and Main Event Entertainment recent visit growth has been partly fueled by the two chains’ growing store counts. And a deeper dive into how the chains’ visitation patterns have evolved since COVID shows why they are well-positioned for continued expansion – and success.
One factor likely contributing to the eatertainment brands’ strength is the increasing loyalty of their visitors. Dave & Buster’s leveled up its rewards program in 2021 – and has been upping its loyalty game ever since. Members can access special deals, like the chain’s recent 50% off food promotion, and earn points by playing games or ordering off the menu. Main Event, too, keeps customers coming back with a variety of promotions, from Monday Night Madness to Kids Eat Free Tuesdays – a particularly attractive offer for the chain’s family-orientedaudience.
And since 2019, both chains have seen a steady increase in the share of visits made by customers frequenting the chain at least twice a month.
When the Time is Right: Visits Late at Night
In addition, both Dave & Buster’s and Main Event appear to be finding success by leaning into the evening daypart.
Back in 2019, Main Event introduced a late-night menu and announced that all of its stores would be open until at least 12:00 AM – and even later on Fridays and Saturdays. (Even before that, some of its stores were open during the wee hours). Dave & Buster’s has also taken steps to increase its night-time business with special late-night deals and happy hours.
And location analytics indicates that this strategy is bearing fruit. Over the past several years, both brands have experienced an increase in their share of late-night visits (i.e. those taking place between 9:00 PM and 2:00 AM). And in Q1 2024, Dave & Buster’s and Main Event saw 23.9% and 27.3% of their total visits during the late-night daypart, respectively.
While it might be assumed that at-home entertainment and the "Netflix effect" pose a threat to eatertainment chains (particularly during the evening hours, as there is more content than ever to get home to), the data suggests that many consumers are staying out late for social dining and entertainment.
More Fun to be Had
Demand for dining and social experiences continues to grow. As consumer behavior and demographics evolve, how will these eatertainment chains perform and which new concepts may rise to prominence as 2024 progresses?
Are luxury retailers and high-end department stores making a comeback? Dive into the data to find out.
Ezra Carmel
May 29, 2024
3 minutes
In this blog, we dive into the latest location analytics and demographic data for luxury retailers and high-end department stores and take a closer look at consumer behavior in the upscale shopping space.
Seasonal Shopping Returns Stateside
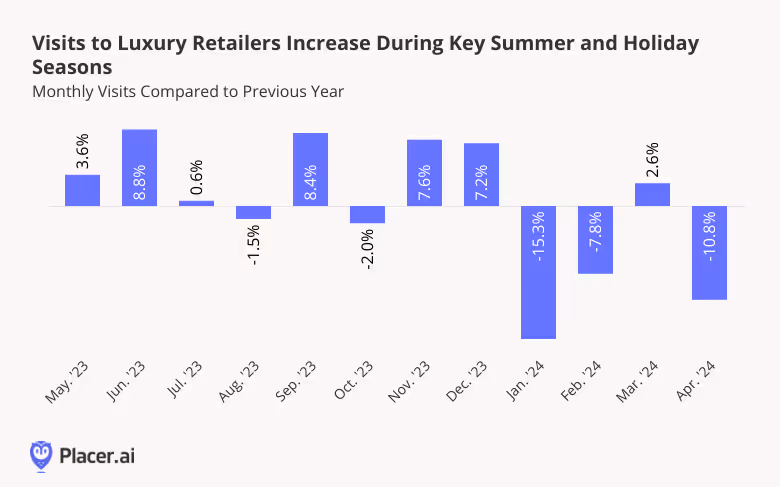
Over the past year, the Placer.ai Luxury Retail Index – including brands like Louis Vuitton, Tiffany & Co., and Chanel – saw year-over-year (YoY) foot traffic growth during crucial shopping seasons. May and June 2023 had significant increases in YoY visits, perhaps due to an influx of recreational shoppers on summer vacation, and July saw an uptick as well. YoY visits peaked again in November and December, likely reflecting the popularity of upscale retail corridors during the all-important holiday shopping season.
Some of this strength may be a result of affluent consumers refocusing their shopping on the U.S.: In 2022, many high-income shoppers chose to purchase big-ticket items abroad due to various economic benefits. But by 2023, demand for domestic luxury retail appeared to rebound, as some upscale retail clients “repatriated” their discretionary dollars.
To be sure, visit gaps re-emerged in some months of early 2024 – though these are partly attributable to factors like January’s unusually stormy weather and an April calendar shift. (April 2024 had one fewer Saturday than April 2023, providing less opportunity for visits in the highly discretionary category). But March 2024 also saw YoY visit growth. And given how well luxury retailers performed during their busiest months of year, the category may very well rally once again heading into the summer.
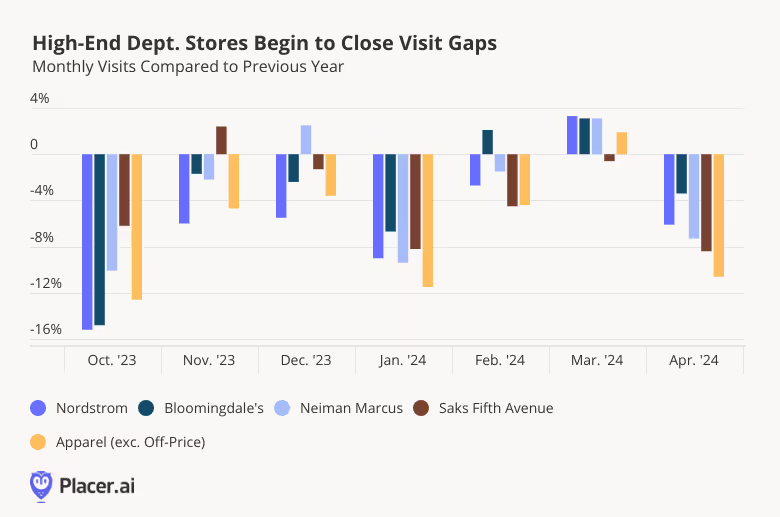
High-End Department Stores Close the Gap
Recent location intelligence also offers encouraging signs from the high-end department store space.
Like luxury retailers, high-end department stores saw narrowing visit gaps during the peak holiday shopping season – with Saks Fifth Avenue seeing a YoY uptick in November 2024, and Neiman Marcus seeing one in December.
In March 2024, YoY traffic turned positive for Nordstrom (3.3%), Bloomingdale’s (3.1%), and Neiman Marcus (3.1%), while Saks Fifth Avenue had just a -0.6% visit gap. And although April 2024 was a challenging month for the retailers, perhaps due in part to the calendar shift mentioned above, all four upscale department stores outperformed the traditional apparel category – another indication that high-end department stores may be poised for a comeback.
The Highest Earners Drive Traffic
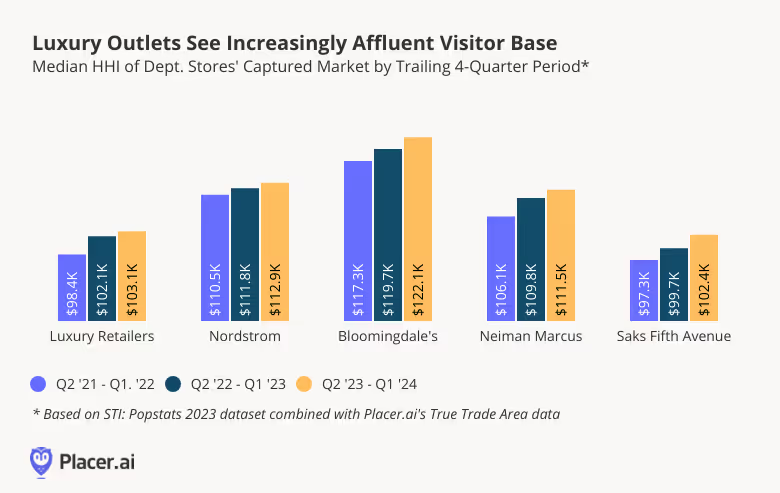
Analyzing demographic changes in the captured markets of both luxury brands and high-end department stores indicates that increasingly affluent consumers are the main drivers of visits to the segment. (A chain’s captured market is obtained by weighting each Census Block Group (CBG) in its trade area according to the CBG’s share of visits to the chain – and so reflects the population that actually visits the chain in practice).
Over the last four quarters, visitors to luxury retailers and high-end department stores came from areas with higher median household incomes (HHIs) than in previous years. For example, during the period between Q2 2023 and Q1 2024, the median HHI of Bloomingdale’s captured market was $122.1K, an increase from $119.7K between April 2022 and March 2023, and $117.3K from April 2021 to March 2022.
In the face of recent inflationary pressures, aspirational luxury shoppers (who tend to be slightly less affluent) are likely quicker to adjust their behavior and trade down to more affordable brands. Meanwhile, prestige luxury shoppers – those with the highest incomes – tend to be relatively resilient, and so are able to continue shopping at their favorite luxury brands, driving up the HHI in these retailers’ trade areas.
Looking Ahead
Luxury retailers and high-end department stores have had recent foot traffic successes, while their clientele has become increasingly affluent. Will these brands continue their upward visit trajectories – and how will they leverage affluent foot traffic going forward?
Discretionary retail has faced its fair share of challenges over the past few years. But even in this challenging environment, some brands, like Ulta Beauty, are continuing to see visit growth, while others, like Gap and Old Navy, are making a comeback.
Bracha Arnold
May 28, 2024
4 minutes
Discretionary retail has faced its fair share of headwinds over the past few years, from pandemic-related restrictions to inflation. And while prices have stabilized, subdued consumer confidence continues to weigh on non-essential segments. But even in this challenging environment, some companies, like Ulta Beauty, are continuing to see visit growth, while others, like Gap Inc. and its portfolio of apparel brands, are making a comeback.
With Q2 2024 well underway, we take a look at the foot traffic patterns for these companies to see how they are faring.
Ulta: The Beauty Powerhouse Sees YoY Visit Growth
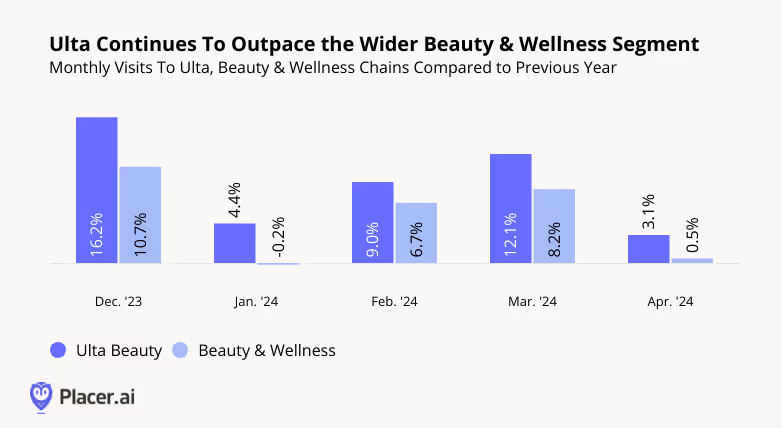
In 2020, Placer.ai predicted that Ulta Beauty would be an unstoppable force in beauty retail – and the chain has impressed ever since. Over the past several years, Ulta has been on a consistent upward visit trajectory, propelled by strong demand for affordable luxuries (the so-called “Lipstick Effect”), and consumer interest in self-care.
And though the pace of Ulta’s tremendous YoY visit growth has moderated somewhat in recent months, the beauty giant continues to thrive – drawing even more visitors in early 2024 than during the equivalent period of last year. Between January and April 2024, YoY visits to the beauty retailer remained consistently elevated, outperforming the wider Beauty & Wellness space.
Gap Brands: A Retail Revival
The fashion segment has experienced rising prices and persistent inflation over the past few years, leading to a new era of discount and thrift shopping. And iconic apparel retailers like Gap Inc – operator of Gap, Old Navy, Athleta, and Banana Republic – have not been immune to the challenges facing the category.
But through a combination of high-profile hirings and revitalized branding efforts, Gap Inc. has been readying itself for a comeback. In Q4 2023, the retailer announced stronger-than-expected results, driven primarily by Gap and Old Navy. And recent foot traffic to the company’s largest brands provides further evidence that its turnaround efforts may be starting to bear fruit.
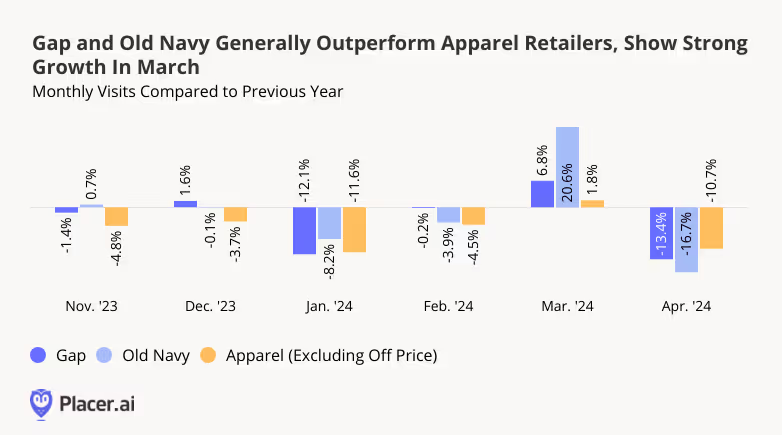
During the all-important November and December shopping season last year, Gap and Old Navy saw YoY visits hold steady or increase, outpacing the wider Apparel space. In January 2024, visits to the two chains declined in the wake of an Arctic blast that kept many shoppers at home. But in February, Gap enjoyed a 0.7% YoY visit bump, while Old Navy saw just a mild drop – less than that of the overall Apparel category. In March 2024, both Gap and Old Navy enjoyed strong YoY visit growth, far outperforming overall Apparel – likely driven by sales events held by eachbrand. And though April saw YoY visits decline once again, with the two chains falling behind Apparel, drilling down into weekly data offers a different perspective.
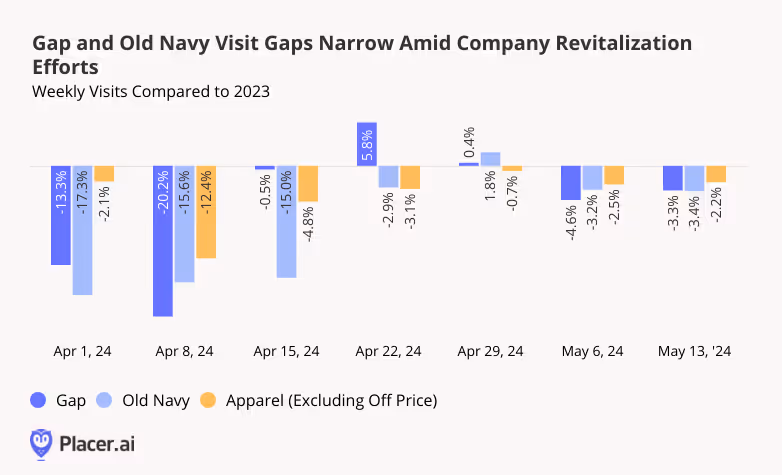
Both Gap and Old Navy started off April with lackluster YoY performance, perhaps due in part to the comparison to an early April 2023 that included Easter weekend. But towards the end of April and beginning of May, Gap and Old Navy’s’ visit gaps narrowed – with some weeks seeing positive YoY visit growth, and with the two chains once again either nearly on par with, or outperforming, overall Apparel.
Gap Inc. itself is bullish about what the next year holds in store, with big names like Zak Posen joining the Gap family in hopes of propelling the company forward. Though it may be premature to declare an end to the troubles that have plagued the clothier in recent years, early 2024 foot traffic provides further evidence that the company is heading in the right direction.
Final Thoughts
Ulta continues to experience visit growth, highlighting Beauty’s enduring appeal. Meanwhile, Gap and Old Navy are witnessing narrowed visit gaps and some weekly visit growth.
Is the Apparel segment making a comeback? Can the Beauty segment sustain its positive momentum indefinitely?
Visit Placer.ai to keep up to date with the latest retail developments.
We dove into the data to check in with specialty discount chains Ollie’s Bargain Outlet and Five Below. How did they fare in early 2024? And what can the two brands’ recent performance tell us about what lies in store for them in the months ahead?
Ezra Carmel
May 27, 2024
3 Minutes
We dove into the data to check in with specialty discount chains Ollie’s Bargain Outlet and Five Below. How did they fare in early 2024? And what can the two brands’ recent performance tell us about what lies in store for them in the months ahead?
The Hop Don’t Stop: Easter Caps off the Quarter
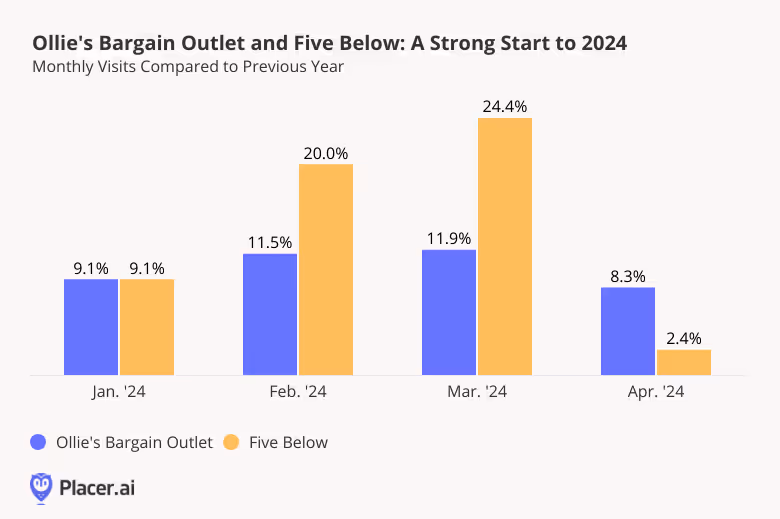
A quest for bargains and the promise of unexpected finds have kept Discount & Dollar Store shoppers coming so far in 2024. Despite lapping a strong 2023, foot traffic to Ollie’s Bargain Outlet and Five Below remained consistently above last year’s levels between January and April 2024, partly due to the chains’ continuedexpansions.
Though both chains draw Easter shoppers with special seasonal offerings, Five Below’s primary focus on low-ticket recreational merchandise makes it a natural destination for shoppers eager to fill their baskets with candy and other inexpensive holiday items. And Q1 2024 foot traffic to the chain appeared to be shaped by Easter shopping patterns. The brand’s YoY visits increased significantly in February with the roll-out of holiday wares, and the Saturday before Easter (March 30th, 2024) saw a sizable foot traffic boost that was 38.7% above the chainwide average for Saturdays in Q1 2024 – contributing to the month’s elevated visits overall. This pull-forward in demand, together with the comparison to an April 2023 that included Easter Sunday, at least partially explains Five Below’s more modest visit growth in April.
For both Ollie’s and Five Below, strong traffic since the beginning of the year indicates continued YoY gains may be expected in the months ahead.
Leisurely and Weekend Visits Drive Growth
In addition to YoY visit growth in the early months of 2024, Ollie’s and Five Below are seeing elevated weekend visits and an increase in longer visits, indicative of a robust treasure-hunting culture that is driving demand.
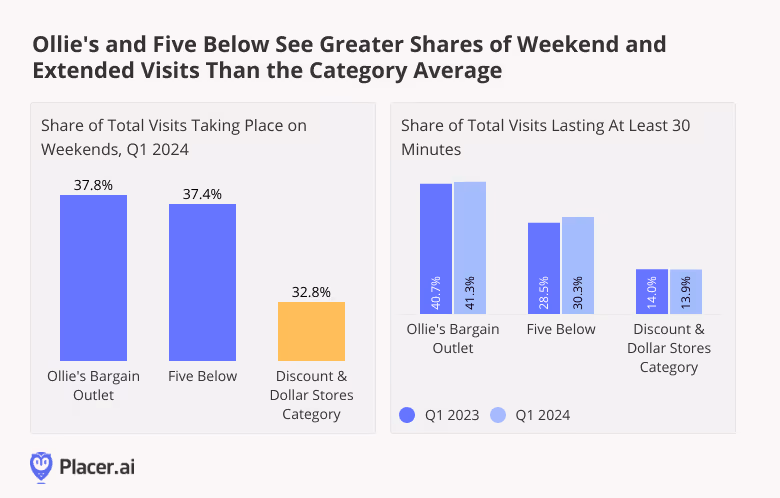
In Q1 2024, 37.8% of visits to Ollie’s and 37.4% of Five Below’s visits occurred on weekends, while weekend visits accounted for only 32.8% of visits to the wider Discount & Dollar Store category. This is likely due to Ollie’s and Five Below’s growing notoriety as destinations for treasure hunting – a pastime perhaps preferred at the end of the work week when schedules are more flexible.
Meanwhile, the share of visits lasting over 30 minutes in Q1 2024 increased for both brands YoY, even as it slightly declined for the category as a whole. This indicates that shoppers drawn to Ollie’s and Five Below’s recreational vibes spent even more time browsing the aisles in Q1 2024 than they did last year. Ollie’s closeout buying model and shifting array of steeply discounted brand name merchandise is especially conducive to the thrill of the hunt – and the chain saw a remarkable 41.3% of visits lasting more than half an hour in Q1.
Taking Stock
Ollie’s Bargain Outlet and Five Below continue to demonstrate their consumer appeal in 2024. As the brands expand, holidays prove to be retail highlights while a culture of treasure hunting has shown its capacity to drive consistent traffic.
For more data-driven retail insights, visit Placer.ai.
In the spirit of retail quarterly earnings season, it has been eye-opening to see the disparity in performances, especially among specialty retailers. This week, Urban Outfitters, Inc. (URBN) reported first quarter earnings, with comparable dollar sales up 4.6%, a strong growth number compared to many in the industry. Urban Outfitters, Inc. benefitted from a diversified retail portfolio, with the growth stemming from its Anthropologie, Free People and Nuuly brands, both in-store and online, while its namesake brand continues to be challenged over the past few years. As far as specialty apparel retailers go, the company has done a fantastic job of creating retail experiences that are unique and irreplaceable for their customers, and finding true competitors of its brands proves difficult.
Looking at Q1 2024 traffic performance, Free People and Anthropologie led the way, echoing the earnings release. Free People visits, excluding FP Movement, grew 8% year-over-year and Anthropologie saw an increase in traffic of 5% year-over-year. Urban Outfitters, on the other hand, actually saw traffic levels beat sales performance, with traffic flat compared to Q1 2023.
Anthropologie, despite retail and economic headwinds, has tightened up its value proposition to consumers and has a clear vision of its target shopper. Using Spatial.ai’s PersonaLive segmentation (as shown below), Anthropologie attracted the most visits from Ultra Wealthy Families in Q1 2024, followed by Young Professionals and Sunset Boomers. Compared to the other portfolio brands, Anthropologie attracts a higher median income consumer and over indexes with more mature consumers, two groups that have higher levels of spending power in today’s economy and haven’t decidedly altered their retail habits as much as middle- and lower-income shoppers. Anthropologie has clearly benefited from the strength of its visitors, and its curated multi-category retail experience that has shielded the chain from the struggles of other home furnishing and apparel retailers. It will be interesting to watch if the brand is able to continue to maintain its success through the remainder of the year if economic conditions become further challenged.
Free People appeals to a consumer somewhat in the middle of both Anthropologie and Urban Outfitters, and has been able to capitalize on Anthropologie’s success and hedge against Urban Outfitters’ struggles. Free People’s design sense makes it a crowd-favorite but also a source for many “dupes” on other retail platforms; however, the influx of similar designs haven’t seen to slow their momentum. FP Movement, the brand’s athleisure line that also has stand alone retail locations, has been another lever for growth. Using Placer.ai to look at three FP movement locations compared to the Free People chain, FP movement grew visits faster than the parent brand, and also had a higher dwell time. Urban Outfitters, Inc. disclosed that dollar sales for Free People were up almost 18% in Q1 2024, but the company doesn't break out sales between FP Movement and Free People. There are some risks with the athleisure market, as brands face softening performance and consumers shift away from more discretionary apparel categories. FP movement has created core and in-demand silhouettes that drive traffic, but with fashion trends, that may not be enough to sustain long-term visit growth.
Finally, there’s the lackluster performance from the namesake brand. Younger adults have so many retail options at their fingertips that retailers who cater to these consumers can often be lost in the shuffle, especially with so much competition coming from online and offline retail. Urban Outfitters long curated a distinct look and feel, as well as a mix of national brands and private labels that differentiated it from competitors; with retailers in similar price bands like Abercrombie & Fitch staging a comeback, Urban Outfitters has lost its footing. Looking into the consumer segments using Spatial.ai’s PersonaLive, Educated Urbanites and Young Professionals top Urban Outfitters segmentation; price-sensitivity could be making younger shoppers more discerning in their apparel purchases. Off-price may also be a factor here and provide higher levels of competition for the customer base. Urban Outfitters holds a lot of brand value, and if the brand is able to right size assortments and value in the short term, there could be upside to bring it closer to its sister brands.
Compared to most of the specialty retail narratives out in the market, Urban Outfitters, Inc. has a lot of positive momentum with a few of its brands. Nuuly, its subscription rental service, was also called out as a positive highlight of the quarter, and learnings about consumer preferences through that service could help to inform the go-forward strategies at Anthropologie, Free People and Urban Outfitters. There is a lot to celebrate as it relates to its discretionary retail fleet, despite the challenges at the namesake brand, and proves that specialty retail that still feels “special” has consumers' lasting attention.
Earlier this week, we attended the National Restaurant Association show in Chicago and had the chance to speak with a wide range of restaurant owner/operators (large chains, small chains, independents, and franchisees) as well as their vendors, distributors, and other technology solutions. We’ve already seen some great recaps of the event (including one from Nation’s Restaurant News), but we thought we’d offer some of our own observations from the event.
Fierce Fight for Visits Amid New Sources of Competition
We discussed this during our trade show preview last week, but concerns about slowing foot traffic trends and increased competition with alternative food retail channels like grocery, dollar stores, and convenience stores was easily the number one topic of discussion at the event. Most operators we spoke with acknowledged flat or year-over-year declines in comparable visits, which is consistent with the year-to-date on most of the restaurant subcategories we monitor (below)
Most of the restaurant executives we spoke to at the event also noted the improvements of prepared food offerings in the grocery and c-store channels as a competitive headwind. One executive even told us that “C-stores have gone from copying QSR category innovations to setting the bar higher in many ways.” We’ve seen this in the channel shift taking place across the food retail category, which we touched upon last week.
As it pertains to competition in the months ahead, operators across all categories admitted that they were curious about the ripple effect of McDonald’s plans to launch a $5 value menu on June 25 (which will run for a month). We’re already starting to see competitors try to front-run McDonald’s $5 value menu, and there will likely be others who introduce similar promotions in the coming weeks. While these offers are likely to help QSR chains recapture some of the visits lost to other channels, these chains will likely need to continue with their value messaging in the back half of the year (especially with the rollbacks taking place at Walmart, Target, and other superstore chains) while also committing to more menu innovation than we’ve seen year-to-date.
Coffee’s Momentum Continues–With A Notable Outlier
One of the two subcategories that is seeing year-over-year increases is coffee. Some of this growth has been fueled by expansion plans of Dutch Bros, 7 Brew Coffee, 151 Coffee, Scooter’s Coffee, Philz Coffee, particularly in the South and Southeast U.S. (something we touched on late last year). Below, we’ve put together a custom chain of drive-thru focused chains versus the category average to put some context behind where the growth in the category is coming from (although the category itself as a whole continues to see healthy growth).
Starbucks–which reported a 7% decline in comparable transactions during its January-March 2024 quarter–is one of the key outliers from this category. Starbucks CEO Laxman Narasimhan called the company’s performance “disappointing” on its most recent update call. There have been no shortage of opinions on why the chain has underperformed, but our data continues to indicate that occasional visitors are the root of the softer visitation trends, much like they were last quarter. To reverse these trends, the company has already launched flavored pearls for a series of summer seasonal drinks and an improved blueberry muffin. Additionally, the company plans to launch more sugar-free customization options (including syrups) as well as a zero-to-low-calorie energy beverage.
Casual Dining’s Quiet Comeback
The other restaurant category posting seeing year-over-year growth may come as a surprise: casual-dining chains. After a slow start to the year due to weather, the category has generally seen low-single-digit growth on a year-over-year basis (something Placer’s blog team pointed out a few weeks ago). Several executives in the casual dining space we spoke with noted that they had started to see improving trends, with a few citing a narrowing price gap with QSR/fast casual chains (in other words, if consumers are going to pay the same price per entree, they’ll gravitate toward casual dining) as well as a continued propensity to spend for events/holidays (a theme we touched on repeatedly in the past).
Where is the growth coming from? There are a couple of expected categories, including steakhouses, breakfast-first concepts, and eatertainment. Asian concepts have also performed well this year, helped by growth from experiential concepts like Kura Sushi and GEN Korean BBQ.
On the other end of the spectrum, we see weakness in Mexican and Seafood concepts. Seafood should not come as a surprise given that one of other notable development in the restaurant industry this week was Red Lobster’s bankruptcy announcement. The company's Endless Shrimp promotion has been widely blamed for the company's bankruptcy filing--and our visitation data does show a spike in visits coinciding with the promotion--but there were certainly other factors such as unfavorable lease terms that played a part.
Dive into the data to find out how the dining category is performing in 2025, which segments are coming out on top, and how dining consumer behavior has shifted in recent years.
June 26, 2025
10 minutes
Key Takeaways:
1. Overall dining traffic is mostly flat, but growth is concentrated in specific areas.
While nationwide dining visits were nearly unchanged in early 2025, western states like Utah, Idaho, and Nevada showed moderate growth, while states in the Midwest and South, along with Washington D.C., saw declines.
2. Fine dining and coffee chains are growing through expansion, not just busier locations.
These two segments were the only ones to see an increase in total visits, but their visits-per-location actually decreased, indicating that opening new stores is the primary driver of their growth.
3. Higher-income diners are driving the growth in resilient categories.
The segments that saw visit growth—fine dining and coffee—also attracted customers with the highest median household incomes, suggesting that affluent consumers are still spending on dining despite economic headwinds.
4. Remote work continues to reshape dining habits.
The share of suburban customers at fine dining establishments has increased since 2019, while it has decreased for coffee chains. This reflects a shift towards "destination" dining closer to home and away from commute-based coffee runs.
5. Limited-service restaurants own the weekdays; full-service restaurants win the weekend.
QSR, fast casual, and coffee chains see the majority of their traffic from Monday to Friday, whereas casual and fine dining see a significant spike in visits on weekends.
6. Each dining segment dominates a specific time of day.
Consumer visits are highly predictable by the hour: coffee leads in the early morning, fast casual peaks at lunch, casual dining takes the afternoon, fine dining owns the dinner slot, and QSR captures the late-night crowd.
Year-over-Year Dining Traffic Trends
Dining Visits Mostly Up in the West, Down in Most of Midwest and East
Overall dining visits held relatively steady in the first five months of 2025, with year-over-year (YoY) visits to the category down 0.5% for January to May 2025 compared to the same period in 2024. Most of the country saw slight declines (less than 2.0%), though some states and districts experienced larger drops: Washington, D.C, saw the largest visit gap (-3.6% YoY), followed by Kansas and North Dakota (-2.9%), Arkansas (-2.8%), Missouri and Kentucky (-2.6%), Oklahoma (-2.1%), and Louisiana (-2.0%).
Still, there were several pockets of moderate dining strength, specifically in the west of the United States. January to May 2025 dining visits in Utah, Idaho, and Nevada increased 1.8% to 2.4% YoY, while the coastal states saw traffic rise 0.6% (California) to 1.2% (Washington). Vermont also saw a slight increase in dining visits (+1.9%).
Coffee & Fine Dining See Strongest Overall Visit Growth
Diving into visit trends by dining segment shows that fine dining and coffee saw the strongest overall visit trends, with visits to the segments up 1.3% and 2.6% YoY, respectively, between January and May 2025. But visits per location trends were negative for both segments – a decline of 0.8% YoY for fine dining and 1.8% for coffee during the period – suggesting that much of the visit strength is due to expansions rather than more crowded restaurants and coffee shops.
In contrast, full-service casual dining saw overall visits decrease by 1.5%, while visits per location remained stable (+0.2%) YoY between January and May 2025. Several casual dining chains have rightsized in the past twelve months – including Red Lobster, TGI Fridays, and Outback Steakhouse – which impacted overall visit numbers. But the data seems to show that their rightsizing was effective, as the remaining locations successfully absorbed the traffic and maintained performance levels from the previous year. And the monthly data also provides much reason for optimism, with May traffic up both overall and on a visit per location basis – suggesting that the casual dining segment is well positioned for growth in the second half of 2025.
Meanwhile, QSR and fast casual chains saw similar minor visits per venue dips (-1.5% and -1.2%, respectively). At the same time, QSR also saw an overall visit dip (-0.8%) while traffic to fast casual chains increased slightly (+0.3%) – suggesting that the fast casual segment is expanding more aggressively than QSR. But the two segments decoupled somewhat in May, with overall traffic and visits per venue to fast casual chains up YoY while traffic remained flat and visits per venue fell slightly for QSR – perhaps due to the relatively greater affluence of fast casual's consumer base.
Dining Demographics
Visitor Income Levels Hold Steady in Most Segments
Analyzing the income levels of visitors to the various dining segments over time shows that each segment followed a slightly different trend – and the differences in visitor income may help explain some of the current traffic patterns.
The only three segments with YoY visit growth – casual dining, fine dining, and coffee – also had the highest captured market median household income (HHI). Although the median HHI in the captured market of upscale and fine dining chains fell after COVID, it has risen back steadily over time and now stands at $98.0K – slightly higher than the $97.1K median HHI between January to May 2019. This may explain the segment's resilience in the face of wider consumer headwinds. Meanwhile, the median HHI at fast casual and coffee chains has fallen slightly, perhaps due to aggressive expansions in the space – including Dave's Hot Chicken and Dutch Bros – which likely broadened the reach of the segments, driving visits up and trade area median HHI down.
Like fine dining, casual dining also saw its trade area median HHI increase slightly over time – but the segment has still been facing visit dips. This could mean that, even though consumers trading down to casual dining may have boosted the trade area median HHI for the segment, it still might not have been enough to make up for the customers lost to tighter budgets.
The QSR segment saw its trade area median HHI remain remarkably steady – and visits to the segment have also been quite consistent – staying between $70.6K and $70.9K between 2019 and 2025 – which may explain why the segment's visits remained relatively stable YoY.
Suburban Dining Patterns
Diving into the psychographic segmentation shows that, although the fine dining segment attracted visitors from the highest-income areas between January and May 2025, fast casual chains drew the highest share of visitors from suburban areas, followed by casual dining and coffee. QSR attracted the smallest share of suburban visitors, with just 30.5% of the category's captured market between January and May 2025 belonging to Spatial.ai: PersonaLive suburban segments.
But looking at the data since 2019 reveals small but significant changes in the shares of suburban audiences in some categories' captured markets. And although the percentage changes are slight, these represent hundreds of thousands of diners every year.
The data shows that shares of suburban segments in the captured markets of fine dining chains have increased, while their share in the captured market of coffee chains has decreased. The shares of suburban visitors to QSR, fast casual, and casual chains have remained relatively steady.
This may suggest that the COVID-19 pandemic and the subsequent rise of remote and hybrid work models are still impacting consumer dining habits, benefiting destination-worthy experiences in suburban locales such as fine dining chains while reducing the necessity of daily coffee runs that were often tied to commuting and office work. Meanwhile, the stability in QSR, fast casual, and casual dining segments could indicate that these categories continue to meet consistent suburban demand for convenience and everyday dining, largely unaffected by the redistribution seen in the fine dining and coffee sectors.
Dining Consumer Behavior Trends
Although QSR, fast casual, casual dining, fine dining, and coffee all fall under the wider dining umbrella, the data shows distinct consumer behavior patterns regarding visits to these five categories.
Limited Service Leads Weekday Visit Share, Full Service Rules the Weekend
Limited service segments, including QSR, fast casual, and coffee tend to see higher shares of visits on weekdays, while full service segments – casual dining and fine dining – receive higher shares of weekend visits. Diving deeper shows that QSR has the largest share of weekday visits, with 72.3% of traffic coming in between Monday and Friday, followed by fast casual (69.8% of visits on weekdays) and coffee (69.4% of visits on weekdays.) Looking at trends within the work week shows that QSR receives a slightly larger visit share between Monday and Thursday compared to the other limited service segments. Meanwhile, coffee seems to receive the smallest share of Friday visits – 16.3% compared to 17.0% for fast casual and 17.2% for QSR.
On the full-service side, casual dining and fine dining chains have relatively similar shares of weekend visits (39.0% and 38.8%, respectively), but fine dining also sees an uptick of visits on Fridays (with 19.1% of weekly visits) as consumers choose to start the weekend on a festive note.
Each Segment Owns a Different Daypart
Hourly visit patterns also show variability between the segments. Coffee is the unsurprising leader of early visits, with 14.6% of visits taking place before 8 AM and, almost two-thirds (64.9%) of visits taking place before 2 PM. Fast casual leads the lunch rush (29.4% of visits between 11 AM and 2 PM), casual dining chains receive the largest share of afternoon (2 PM to 5 PM) visits, and fine dining chains receive the largest share of dinner visits, with almost 70% of visits taking place between 5 PM and 11 PM. QSR leads the late night visit share – 4.1% of visits take place between 11 PM and 5 AM – followed by casual dining chains (3.2% late night and overnight visit share), likely due to the popularity of 24-hour diners.
This suggests that each dining segment effectively "owns" a different part of the day, from the morning coffee ritual and the quick lunch break to the leisurely evening meal and late-night cravings.
Shorter Visits in Most Segments
An analysis of average visit duration also reveals a small but lasting shift in post-pandemic dining behavior. Between January and May 2025, the average dwell time for nearly every dining segment was shorter than during the same period in 2019. This efficiency trend is evident across limited-service categories like QSR, fast casual, and coffee shops, suggesting a continued emphasis on speed and convenience.
The one notable exception to this trend is upscale and fine dining, where the average visit duration has actually increased compared to pre-COVID levels. This may suggest that, while visits to most segments have become more transactional, consumers are treating fine dining more as an extended, deliberate experience, reinforcing its position as a destination-worthy occasion.
Dive into the data to see how consumer response to major promotional events – from Black Friday and the back-to-school shopping rush to brand-crafted LTOs – varies by market.
June 19, 2025
Key Takeaways
1. The Midwest is the only region where Black Friday retail visits outpace Super Saturday.
But several major Midwestern markets, including Chicago and Detroit, actually see higher shopper turnout on Super Saturday.
2. Holiday season demographic shifts also vary across regions.
Nationwide, electronics stores see a slight uptick in median household income (HHI) in December – yet in certain markets, electronics retailers such as Best Buy see a drop in captured market median HHI during this period.
3. Back-to-school shopping starts earliest for clothing and office supplies retailers in the South Central region, likely tied to earlier school schedules.
But back-to-school visits surge higher for these retailers in the Northeast later in the season.
4. The share of college students among back-to-school shoppers varies by region.
In August 2024, “Collegians” made up the largest share of Target’s back-to-school shopping crowd in New England, and the smallest in the West.
5. Mother’s Day drives the biggest restaurant visit spikes in the Middle Atlantic Region, while Father’s Day sees its biggest boosts in the South Atlanticstates.
Mother’s Day diners also tend to travel farther to celebrate, suggesting an extra effort to treat mom.
6. Western states proved particularly responsive to McDonald’s recent Minecraft promotion.
During the week of A Minecraft Movie’s release, the promotion drove significantly higher visit spikes in the West than in the Eastern U.S.
Zooming in on Local Trends
Retailers rely on promotional events to fuel sales – from classics like Black Friday and back-to-school sales to unique limited-time offers (LTOs) and pop-culture collaborations. Yet consumer preferences and behavior can vary significantly by region, making it critical to tailor campaigns to local markets.
This report dives into the data to reveal how consumers in 2025 are responding to major retail promotions, exploring both broad regional trends and more localized market-level nuances. Where is Black Friday most popular, and which areas see a bigger turnout on Super Saturday? Where are restaurants most packed on Mother’s Day, and where on Father’s Day? Which region kicks off back-to-school shopping – and where are August shoppers most likely to be college students? And also – which part of the country went all out on McDonald’s recent Minecraft LTO?
Read on to find out.
The Holiday Season: A Regional Story
Promotions aimed at boosting foot traffic on key holiday season milestones like Black Friday and Super Saturday are central to retailers’ strategies across industries. The day after Thanksgiving and the Saturday before Christmas typically rank among in-store retail’s busiest days, last year generating foot traffic surges of 50.1% and 56.3%, respectively, compared to a 12-month daily average. And
But a closer look at regional data shows that these promotions land differently across the country. In the Midwest, Black Friday outperformed Super Saturday last year, fueling the nation’s biggest post-Thanksgiving retail visit spike – a testament to the milestone’s strong local appeal. Meanwhile, in the Western U.S. Black Friday trailed well behind Super Saturday, though both milestones drove smaller upticks than in other regions. And in New England and the South Central states, Super Saturday achieved its biggest impact, suggesting that last-minute holiday specials may resonate especially well in that area.
Plenty of Local Variety
Digging deeper into major Midwestern hubs shows that even within a single region, holiday promotions can produce widely different responses.
In St. Louis, Indianapolis, and Minneapolis, for example, consumers followed the broader Midwestern pattern, flocking to stores on Black Friday exhibiting less enthusiasm for Super Saturday deals. By contrast, Chicago and Detroit saw Super Saturday edge ahead, with Chicago’s Black Friday peak falling below the nationwide average of 50.1%. examples highlight the power of local preferences to shape holiday campaign results.
Differing Demographic Shifts Across Regions
Holiday promotions don’t just drive visit spikes; they also spark subtle but significant changes in the demographic profiles of brick-and-mortar shoppers, expanding many retailers’ audiences during peak periods. And these shifts, too, can vary widely across regions.
Outlet malls, department stores, and beauty & self-care chains, for instance, which typically attract higher-income consumers, tend to see slight declines in the median household incomes (HHI) of their visitor bases in December. This dip may be due to promotions drawing in more mid- and lower-income shoppers during the peak holiday season. Electronics stores and superstores, on the other hand, which generally serve a less affluent base, see modest upticks in median HHI in the lead-up to Christmas.
But once again, drilling further down into regional chain-level data reveals more nuanced regional patterns. Take Best Buy, a leading holiday season electronics destination. In some of the chain’s biggest, more affluent markets – including New York, Los Angeles, and Chicago – the big-box retailer sees small dips in median HHI during December. But in Atlanta and Houston – also relatively affluent, but slightly less so – December saw a minor HHI uptick, hinting at a stronger holiday rush from higher-income shoppers in those cities.
Back-to-School Bonanzas
Back-to-school promotions also play a pivotal role in the retail calendar, with superstores, apparel chains, office supply stores and others all vying for shopper attention. And though summer markdowns drive increased foot traffic nationwide, both the timing of these shifts and the composition of the back-to-school shopping crowd differ among regions.
A Southern Head Start
Analyzing weekly fluctuations in regional foot traffic to clothing and office supplies stores shows, for example, that back-to-school shopping picks up earliest in the South Central region, likely due to earlier school start dates.
But the biggest visit peaks occur in the Northeast – with clothing retailer foot traffic surging in New England in late August, and office supplies stores seeing an even bigger surge in the Middle Atlantic region in early September. Retailers and advertisers can plan their back-to-school deals around these differences, targeting promotions to local trends.
A New England Collegian Affair
Though K-12 families drive much of the back-to-school rush, college student shoppers also play a substantial role. And here, too, their participation varies by region.
For instance, the “Collegians” segment accounted for 2.2% of Target’s shopper base nationwide over the past year – rising to 3.0% in August 2024. But regionally, the share of “Collegians” soared as high as 4.0% in New England versus just 2.2% in the West. So while retailers in New England may choose to lean into the college vibe, those in Western states may place greater emphasis on families with children.
Mother’s Day and Father’s Day: Differing Dining Peaks
When it comes to dining, Mother’s Day and Father’s Day are the busiest days of the year for the full-service restaurant (FSR) category, as families treat their parents to a hassle-free meal out. And eateries nationwide capitalize on this trend by offering a variety of deals and promotions that add a little extra charm (and value) to the experience.
Atlantic Specials
Nationwide, Mother’s Day drives more FSR foot traffic than Father’s Day – except in parts of the Pacific Northwest, where Father’s Day traditions run especially deep. Still, the size of these holiday boosts varies substantially by region.
This year, for instance, Mother’s Day (May 11, 2025) drove the largest FSR surge in the Middle Atlantic, with the South Atlantic and Midwest not far behind. Father’s Day, by contrast, saw its biggest lift in the South Atlantic. Mother’s Day proved least resonant in the West, whereas Father’s Day had its smallest impact in New England.
Going the Extra Mile for Mom
Dining behavior also differs between the two occasions. Mother’s Day celebrants display a slight preference for morning FSR visits and a bigger one for afternoon visits, while Father’s Day crowds favor evenings – perhaps reflecting a preference for sports bars and later dinners with dad. Another interesting nuance: On Mother’s Day, a larger share of FSR visits originate from between 3 and 50 miles away compared to Father’s Day, suggesting that families go the extra mile – sometimes literally – to celebrate mom.
Self-Styled Celebrations: Driving Traffic with DIY Milestones
While established dates like Black Friday or Mother’s Day naturally spur promotions, brands can also craft their own moments with limited-time offers (LTOs). And much like holiday campaigns, these retailer-led events can produce varied outcomes across different regions.
Fast food restaurants, for example, have leaned heavily on limited-time offers (LTOs) and pop-culture tie-ins to fuel buzz in what remains a challenging overall market. And McDonald’s recent Minecraft promotion, launched on April 1, 2025 to coincide with the April 3 release of A Minecraft Move, shows just how impactful the practice can be.
Nationally, the Minecraft promotion (featuring offerings for both kids and adults) drove a 6.9% lift in visits during the movie’s opening week. But the impact of the promotion was far from uniform across the U.S. Many of McDonald’s Western markets – including Utah, Idaho, Nevada, California, Texas, Arizona, Colorado, and Oregon – recorded visit lifts above 10.0%. Meanwhile, Kentucky saw a 2.1% dip, and several other Eastern states registered modest gains below 3.0%. The McDonald’s example illustrates the power of regional tastes to shape the success of even the most creative pop-culture collabs.
Adopting a Regional Lens
Whether it’s properly timing holiday and back-to-school discounts, recognizing where Mother’s Day or Father’s Day will resonate more, or pinpointing markets that respond best to pop-culture tie-ins, the data reveals that effective promotions depend heavily on local nuances. And by analyzing regional and DMA-level trends, retailers and advertisers can craft compelling, relevant campaigns that heighten engagement where it matters most.
Discover how mall anchors are transforming in 2025 – and how a foot-traffic-focused approach to choosing key tenants can drive visits and shopper engagement.
May 29, 2025
8 minutes
Key Takeaways
1. Experiential and niche retailers can deliver anchor-level traffic. At Towne East Square Mall, the addition of a Scheels in 2023 significantly increased foot traffic and long-distance travelers, while Barnes & Noble at Coronado Center in Albuquerque has become a key driver of both foot traffic and higher-spend demographics.
2. Size isn’t everything – especially for dining venues. At Glendale Galleria and Northridge Fashion Center, smaller restaurants attracted more foot traffic than some traditional anchors.
3. Refocusing on tenants’ actual traffic contributions enables a flexible anchor approach. Balancing weekend draws like Scheels with weekday favorites such as Costco or Chick-fil-A can help maintain steady visitor flow throughout the week. Similarly, onsite fitness clubs can shift traffic to earlier in the day – an opportunity to adjust store hours and capture additional morning shoppers.
4. Temporary pop-ups can form an integral part of a visit-focused anchor strategy. The Barbie Dreamhouse Living Truck Tour generates mall visit spikes well above typical Saturday levels. Operators can integrate these events into their overall anchor strategies, offering preferential terms to high-performing pop-ups.
5. New tenants can boost traffic for existing stores in similar categories. After Aldi joined Green Acres Commons in February 2020, visits to an existing BJ’s Wholesale Club trended upwards. This synergy highlights how overlapping audiences can become a strength, creating a larger overall customer base.
The Retail Comeback Kid
Malls, it seems, are cool once again. After languishing in the wake of the pandemic, shopping centers across the country are thriving – reinventing themselves as prime “third places” where people can hang out, shop, and grab a bite to eat.
One key driver behind this resurgence is a shift in how malls view their anchor tenants. While traditional mainstays like Macy’s and JCPenney still play an important role, specialized offerings – from popular eateries to fitness centers and immersive retailtainment destinations – are increasingly taking center stage. These attractions maximize the experiential value that brick-and-mortar venues can deliver, driving visits and sales for the center as a whole.
Against this backdrop, this report leverages the latest location intelligence data to explore the types of tenants that can function as mall anchors in 2025. Should mall operators still focus on general merchandisers to draw crowds, or can dining chains and more niche retailers also do the job? How important is square footage in identifying the anchor-like tenants in a shopping center? And how can a visit-focused approach help mall operators select effective anchor or anchor-like tenants – whether to fill big-box spaces or to leverage the leasing perks traditionally reserved for major large-format chains?
Out-of-the-(Big)-Box Visit Drivers
One of the most important functions of a mall anchor is to ensure steady visitation – providing its smaller tenants with a constant flow of potential customers. And as the role of the mall continues to evolve, analyzing the actual foot traffic impacts of different types of businesses can help identify the kinds of non-traditional anchors best suited to fulfill that purpose.
The Power of a Well-Placed Scheels
Experiential venues, for example, are particularly well-poised to serve as powerful anchors in today’s retail environment – as illustrated by the visit surge experienced by Towne East Square Mall in Wichita, KS following the addition of a Scheels in July 2023.
By blending traditional retail with immersive experiences, Scheels has emerged as a true experiential destination. And this pull has also helped the mall draw more long-distance visitors willing to travel to enjoy Scheels’ offerings. In 2024, 41.9% of the mall’s customers traveled more than 50 miles to visit, compared to 35.8% back in 2018 when Sears occupied the same lot.
Scheels Anchor Brings Substantial Visit Boost to Towne East Square Mall in Wichita, KS, Attracting Visitors From Further Away
Visits to Towne East Square Mall Compared to Q1 2018 Baseline
Share of Visitors From 50+ Miles Away
Share
Embed:
The Barnes & Noble Effect
Traditionally, anchors aimed to please the widest possible audiences – with department stores, big-box chains, and grocery stores leading the way. But visitation data shows that niche concepts can also deliver anchor-level traffic if they’re compelling enough to attract dedicated fans.
The experience of the Barnes & Noble at Coronado Center in Albuquerque, NM is a case in point. After being written off as all but obsolete, Barnes & Noble has staged an impressive comeback in recent years, finding success through a more curated, localized approach to book selling. And despite not being a formal anchor, the Coronado Center Barnes & Noble accounted for 7.9% of visits to the mall in 2024 – outperforming both Macy’s and JCPenney.
Year-over-year data also shows foot traffic surging at the Coronado Center Barnes & Noble, lifting overall visitation to the mall. And demographic data reveals that the bookstore draws a more affluent audience than either the center as a whole or the two department stores – attracting a crowd with more spending power.
This example also illustrates how smaller tenants can sometimes draw larger crowds. Even though Barnes & Noble occupies a smaller onsite space than either Macy’s or JCPenney, it is proving a powerful visit driver out of proportion to its physical size.
Dining Chains Punching Above Their Size
Dining chains are also adept at punching above their square footage – often attracting crowds disproportionate to their size.
Despite its relatively small footprint, for example, the In-N-Out Burger at Glendale Galleria drew an impressive 8.6% of visits to the mall complex in 2024, outpacing some of the mall’s official anchors like DICK’s Sporting Goods, Macy’s, and JCPenney. Still, the onsite Target drew even larger crowds at 14.4% of visits.
A similar pattern emerged at Northridge Fashion Center, where Porto’s Bakery and Cafe captured a notable 15.6% of visits to the complex in 2024 – more than some of the center’s traditional department stores.
These examples underscore the potential for dining chains, which typically require less space, to serve as micro-anchors by consistently attracting outsized crowds – a key consideration for mall operators looking to sustain visitor traffic.
Choosing a Mall Anchor in 2025
Refocusing on tenants’ actual foot traffic contributions also opens the door to a more flexible and dynamic approach to anchor selection and management – one that considers each venue’s unique visitation patterns.
The Weekend/Weekday Divide
Seasonal factors, for example, can make certain anchors more powerful at specific times of the year, while different venues shine on particular days of the week.
At Jordan Creek Town Center in West Des Moines, Iowa, for instance, Scheels and Costco each delivered just under 20.0% of the complex’s overall visits in 2024. But the two retailers’ daily patterns differed significantly: Scheels saw bigger crowds on weekends, while Costco was the primary weekday destination.
Understanding differences like these can help operators optimize their tenant mix to maintain a balanced flow of shoppers throughout the week.
Another example of the impact of differing weekday traffic patterns is offered by the impact of mall-based Chick-fil-A locations on the distribution of mall visits throughout the week.
Despite its relatively small size, Chick-fil-A draws substantial traffic to malls. And after adding Chick-fil-A locations, both Northridge and Miller Hill Malls saw meaningful drops in the share of visits to the centers taking place on Sundays – even as the wider indoor mall segment saw slight upticks.
Recognizing this trend could prompt mall operators to compensate by adding more weekend-friendly traffic drivers – or to lean into this distinction by taking additional steps to bolster the mall’s role as a go-to weekday destination.
The Early-Morning Fitness Advantage
The power of different mall traffic magnets also varies throughout the day. Increasingly, shopping centers are turning to fitness centers as experiential anchors. And since many people work out early in the morning, these gyms are having a significant impact on the distribution of mall visits across dayparts.
The addition of gyms to Northshore Mall in Peabody, MA and Jackson Crossing in Jackson, MI, for instance, led to a significant rise in visits between 7:00 AM and noon. And though the rest of the stores in these malls typically open at 10:00 or 11:00 AM, this shift presents the centers with a significant opportunity.
By adjusting opening hours to accommodate these early-morning patrons, malls can capitalize on this added traffic, driving up visits and sales for relevant tenants – especially health-focused retailers such as juice bars and sporting goods stores.
Adding Temporary Pop-Ups Into the Mix
Adopting a broader, visit-focused view of anchoring also allows mall operators to apply some of the strategies typically reserved for anchors to non-conventional traffic-generating businesses, to ensure a consistent flow of traffic year-round.
Pop-up stores and events, for example, generally don’t follow the same seasonal trends as other retailers – instead, they generate short-term visit boosts during their runs, whenever in the year that may be. And a visit-focused anchor strategy can leverage some of the perks traditionally reserved for anchor tenants – such as preferential leasing terms – to complement traditional full-time anchors during slower retail periods.
The Barbie Dreamhouse Living Truck Tour is a prime example of a traffic-driving pop-up. By bringing exclusive merchandise to malls across the U.S., the truck generates plenty of buzz, drawing crowds eager to snatch up limited-edition items and immerse themselves in all things Barbie. As a result, malls hosting the tour often see significant visit spikes, with foot traffic surging well above typical Saturday levels. Well-timed pop-ups like these can help balance out traffic throughout the year, offsetting traditional slow periods.
Creating a Bigger Visit Pie
A visit-focused approach to anchor management can also help mall operators assess the potential impact of new tenants on existing stores operating in similar categories. For example, mall owners often worry that new tenants operating in similar categories might cannibalize existing businesses. But a visit-focused anchor approach reveals that a well-chosen addition can sometimes benefit current tenants – especially if they cater to similar audiences.
In February 2020, for instance, value supermarket Aldi opened at Green Acres Commons in Valley Stream, NY – a center that already hosted budget-friendly BJ’s Wholesale Club. While BJ’s visits were relatively flat in 2018 and 2019, they began to rise after Aldi’s opening (and following a pandemic-induced dip). Cross-shopping data also shows that Aldi customers were more likely to visit BJ’s than the average Green Acres patron last year.
This synergy may be due in part to the two retailers’ similar visitor bases: In 2024, the Aldi and BJ’s stores in Green Acres Common drew shoppers with comparable economic profiles. This suggests that overlapping audiences can become a strength if aligned brands attract new shoppers, who then explore multiple stores in the same center.
Visits to BJ's Wholesale Club Took Off After Addition of Aldi to Green Acres Commons – Perhaps Buoyed by Audience Similarity
Visits to Green Acres Commons BJ's Wholesale Club, Compared to Q1 2018 Baseline
Median HHI, 2024*
Cross-Shopping, 2024
*Median HHI based on STI: PopStats dataset combined with Placer.ai data for captured trade areas.
Looking ahead, effective mall anchors will be defined less by physical footprint and more by their capacity to maintain consistent, valuable foot traffic. While traditional department stores remain pivotal, smaller or niche brands can often rival – or surpass – large-format retailers. And by thinking out of the anchor box and choosing tenants that cultivate a balanced visitor flow and align with local preferences, operators can position their centers as true go-to destinations.


.svg)


.avif)


