With the holiday season just around the corner, we dove into the Placer.ai Mall Index to see how these shopping mainstays performed during the fall retail lull.
Shira Petrack
Nov 11, 2024
3 minutes
With the holiday season just around the corner, we dove into the Placer.ai Mall Index to see how these shopping mainstays performed during the fall retail lull.
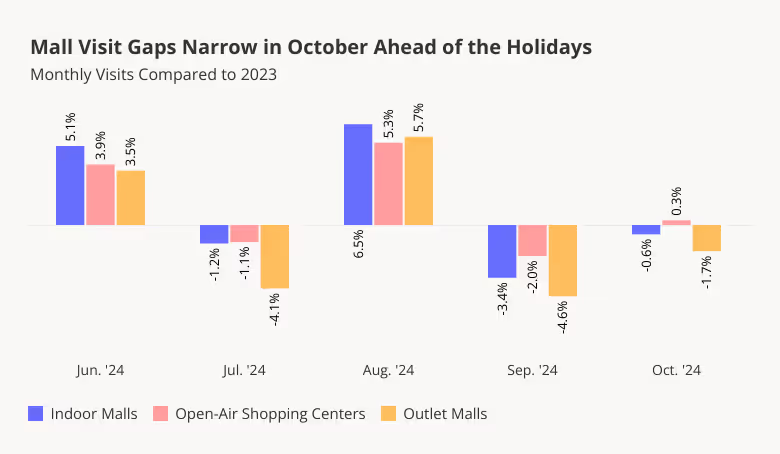
October Mall Visits on Par with 2023 Levels
Following several months of roller-coaster visit trends – as August visits surged compared to last year and September visits dipped year-over-year (YoY) – mall traffic stabilized in October: Last month’s visits to indoor malls, open-air shopping centers, and outlet malls generally matched 2023 visitation trends. The closing of the YoY visit gaps may indicate that consumers are once again ready to spend following the brief September slow-down – boding well for the upcoming holiday season.
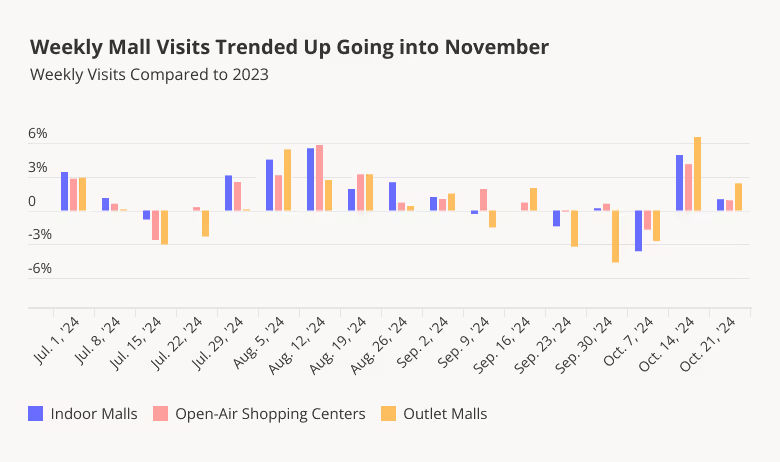
Weekly Trends Swing Positive Ahead of November
Diving into the weekly trends offers even further reasons for optimism: YoY visits over the last two full weeks of October were positive for all three mall categories, with outlet malls in particular seeing the largest YoY increases. Outlet malls’ positive performance during the second half of the month may signal a comeback for the format, which has generally lagged behind indoor malls and open-air shopping centers in recent months.
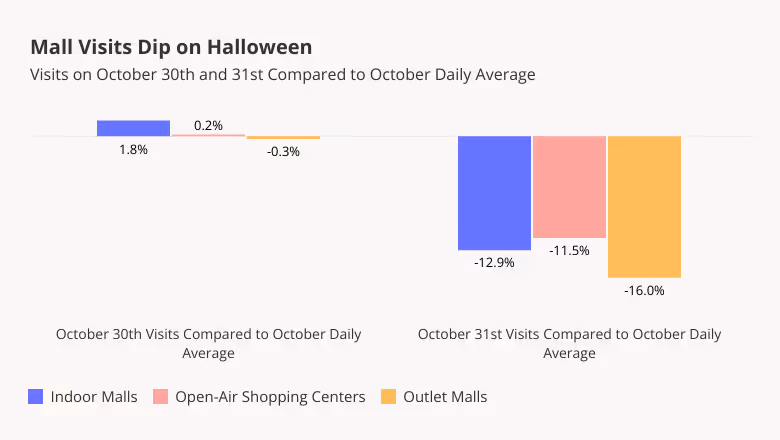
Mall Visits Dip on Halloween
Unlike certain retail categories that enjoy Halloween-driven visit surges either on the day itself or on October 30th, malls do not appear to benefit from the spooky holiday. Analyzing daily visits reveals that October 30th visits were on par with the daily October average, while October 31st traffic actually took a hit across the three mall formats in the Placer.ai Mall Index.
The dip is likely due to shoppers putting off their mall trips and instead choosing superstores and specialty retailers such as party supply stores and liquor shops for their holiday prep. Stores hoping to avoid the Halloween dip may want to offer special promotions around the day – and managers can also use this information to optimize their staffing schedules on October 31st.
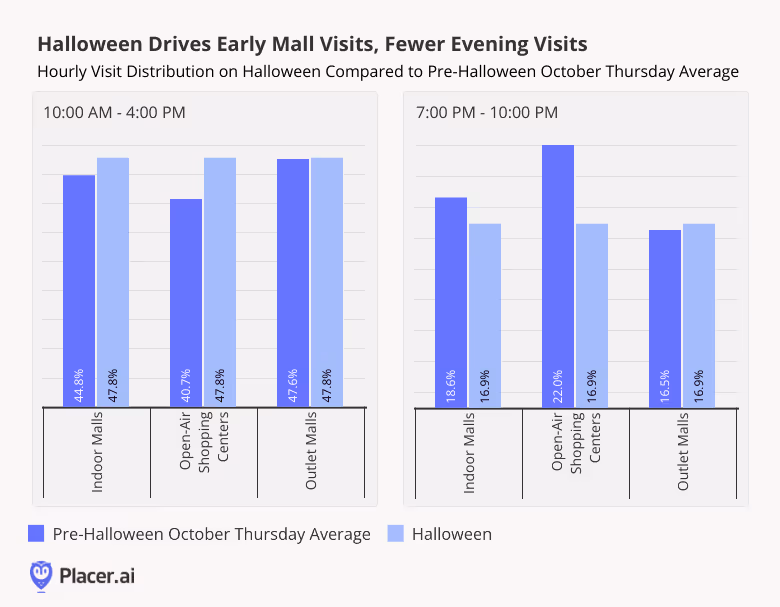
Shoppers Shop Early on Halloween
Diving into hourly visit distributions provides even more data for those looking to optimize store performance. On Halloween, indoor malls and open-air shopping centers received a larger share of their visits before 4:00 PM and relatively fewer visits in the evening when compared to an average Thursday in October. So while some consumers did come out to malls in the morning, by evening, many shoppers may have been too busy scrambling to complete their Halloween costume or stock up on candy for the evening. Meanwhile, the Halloween dip in visits to outlet malls appears to have been evenly spaced throughout the day, with hourly visit shares on October 31st closely matching the average Thursday visit distribution patterns.
Store managers operating in indoor malls or open-air shopping centers may use this data to optimize staffing for the afternoon and evening Halloween shifts, while those working at outlet malls may want to reconsider their manpower needs for the day as a whole. At the same time, those looking to draw in more foot traffic may try offering promotions that appeal to early birds or trick-or-treaters.
With October in the rearview mirror, the holiday season is kicking off. How will malls perform?
As essential sectors of retail face a slowdown in traffic momentum, the need for unique offerings and competitive advantages is more pressing than ever. Grocery retailers have benefited from increased visits, which has kept consumers engaged with chains and their offerings, even if it hasn’t always translated into larger basket sizes. In an increasingly competitive grocery market, retailers will need to consistently prove to consumers that they’re worth the extra visit.
Specialty grocers are better positioned to meet this challenge as value-focused grocery options become more constrained. Many local and regional chains have the added benefit of nimble operating models, enabling them to quickly adapt to consumer preferences. Beyond that, these specialty chains have deeply embedded themselves in the communities they serve. Looking ahead to 2025 and the growing recognition of physical stores’ importance, the strong relationships between specialty grocery retailers and consumers could help them thrive in this evolving environment.
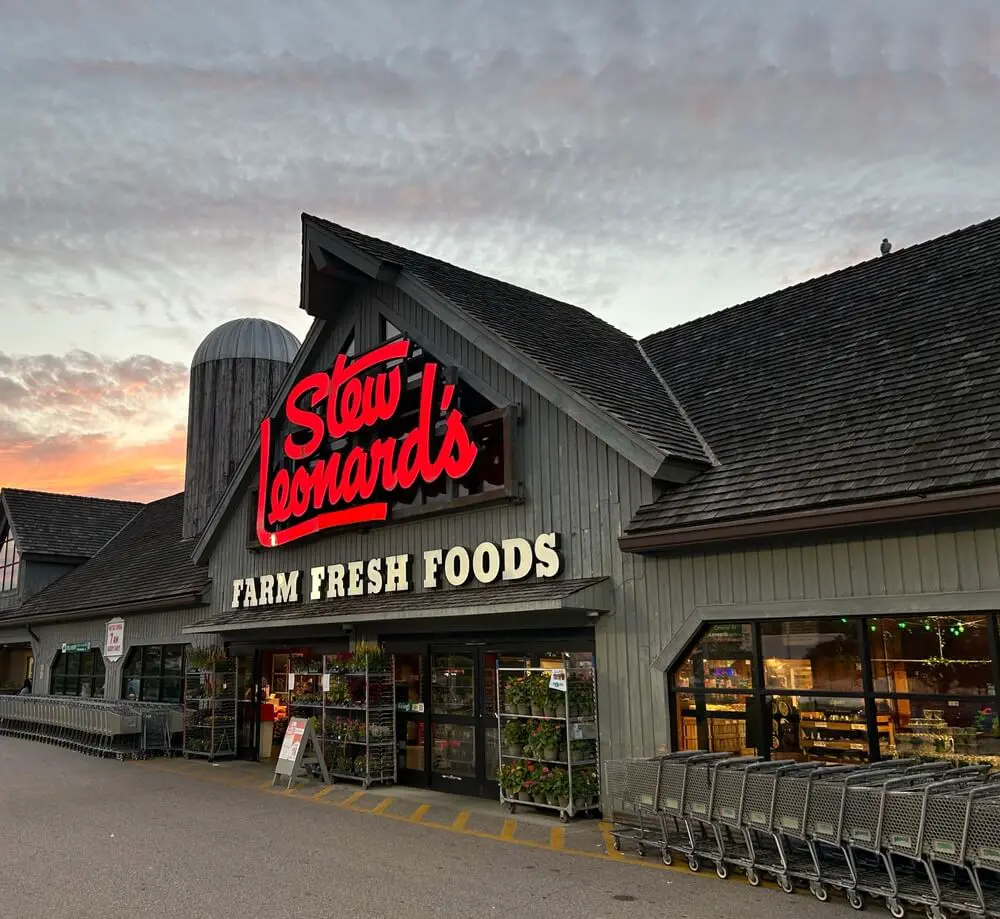
One specialty chain that stands out in this context is Stew Leonard’s. Beloved in the Tri-State area—an area known for outstanding grocery chains—Stew Leonard’s combines product expertise with a unique in-store experience, famously described by The New York Timesas “the Disneyland of Dairy Stores.” Imagine a grocery store with animatronics and birthday parties! In an era when we need more joy in retail, Stew Leonard’s sets the gold standard. With just eight locations, each with a large footprint and a strong connection to its local community, Stew Leonard’s offers a compelling package. A robust private label program, specialty departments, and high service levels make this chain stand out without relying on promotions or low prices.
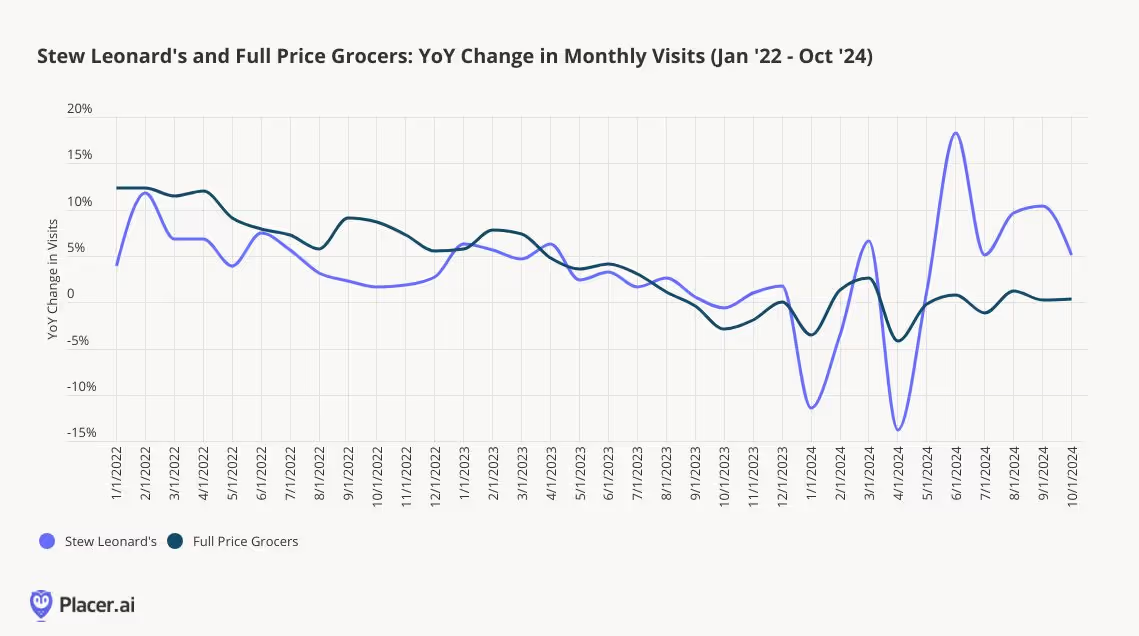
According to Placer’s foot traffic estimates, Stew Leonard’s has effectively hedged against the slowdown in growth seen by other full-price grocery chains this year. Year-to-date, the chain has experienced a 3% year-over-year increase, compared to flat growth for full-price chains. Examining trends over time, Stew Leonard’s has shown consistent, sustainable growth throughout 2022 and 2023, with an acceleration in visits in the latter half of this year, driven by the opening of its new store in Clifton, NJ.
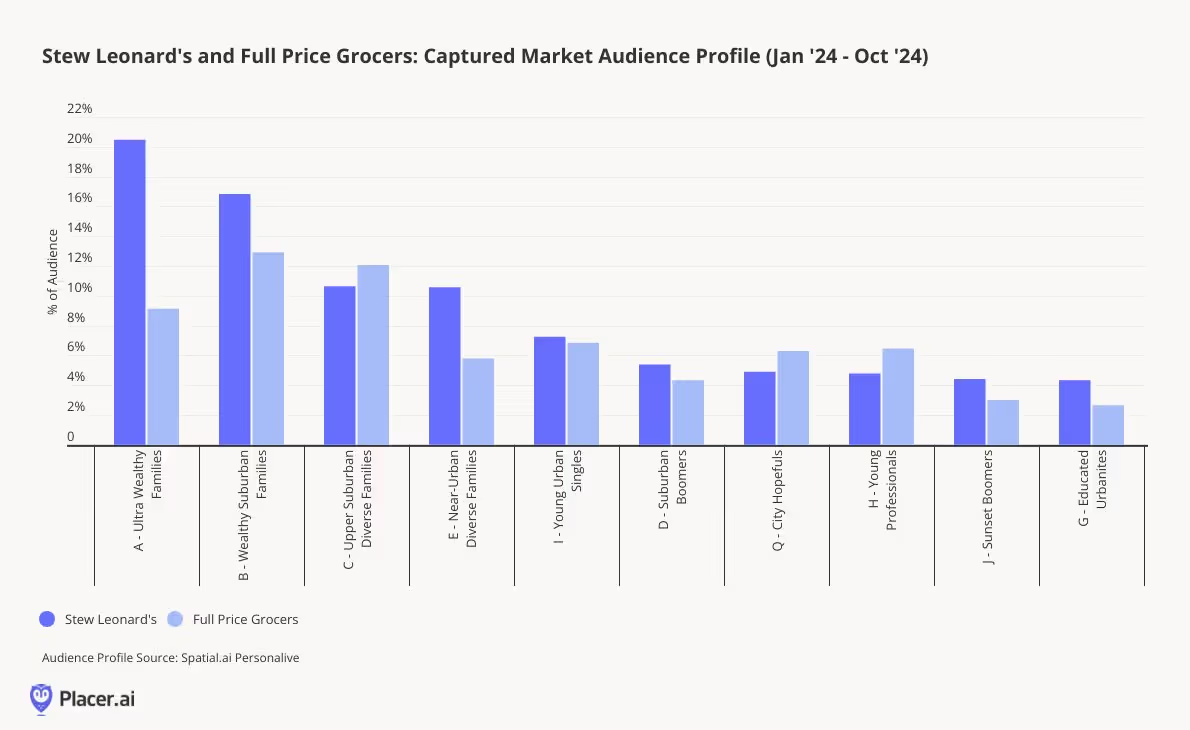
One reason for Stew Leonard’s success is the elasticity of its consumer base. Operating in the Tri-State area allows the chain to tap into wealthier consumer segments compared to national chains. According to PersonaLive audience segmentation, Stew Leonard’s has more than double the concentration of Ultra Wealthy Families compared to full-price grocery chains, along with a high percentage of Wealthy Suburban Families. The chain also attracts a notable share of Young Urban Singles, likely drawn by its strong offerings in prepared and specialty foods.
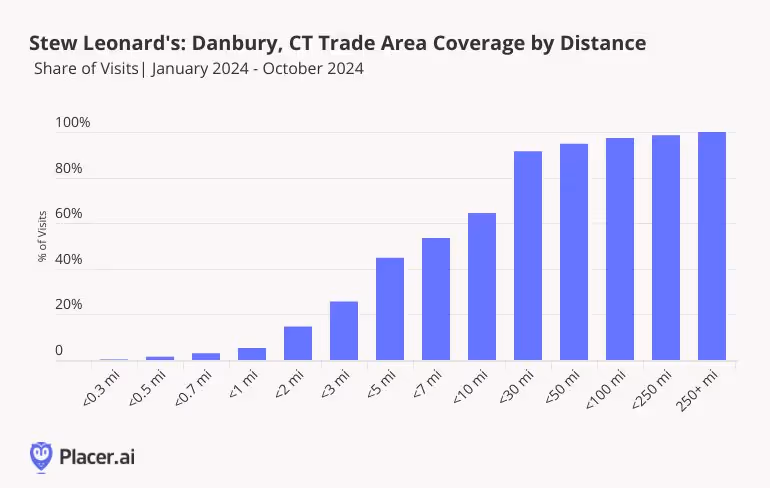
Stew Leonard’s Danbury, CT location offers insight into the brand’s appeal to shoppers. According to Placer’s trade area metrics, 35% of visitors to this store travel from more than 10 miles away, and nearly 10% come from over 30 miles, with clusters of visits from across the Northeastern corridor.
Store-level metrics also reveal strong loyalty among Stew Leonard’s visitors. Year-to-date in 2024, over a quarter of visitors to the Danbury location visited at least four times, and 35% visited three or more times. At the same time, there is a substantial share of visitors who appear to make special, less frequent trips to the store. These visitors show high cross-visitation rates with other grocers, such as Costco and ShopRite, as well as with Stew Leonard’s own operated Wine and Spirits locations.
Stew Leonard’s exemplifies a retailer that resonates with local consumers while offering an experience that attracts visitors from further away. Its combination of unique experiences, services, and products creates a shopping experience that goes well beyond traditional retail. Even as visits slow down across the sector, specialty grocers that remain hyper-focused on their unique offerings are likely to continue drawing in customers.
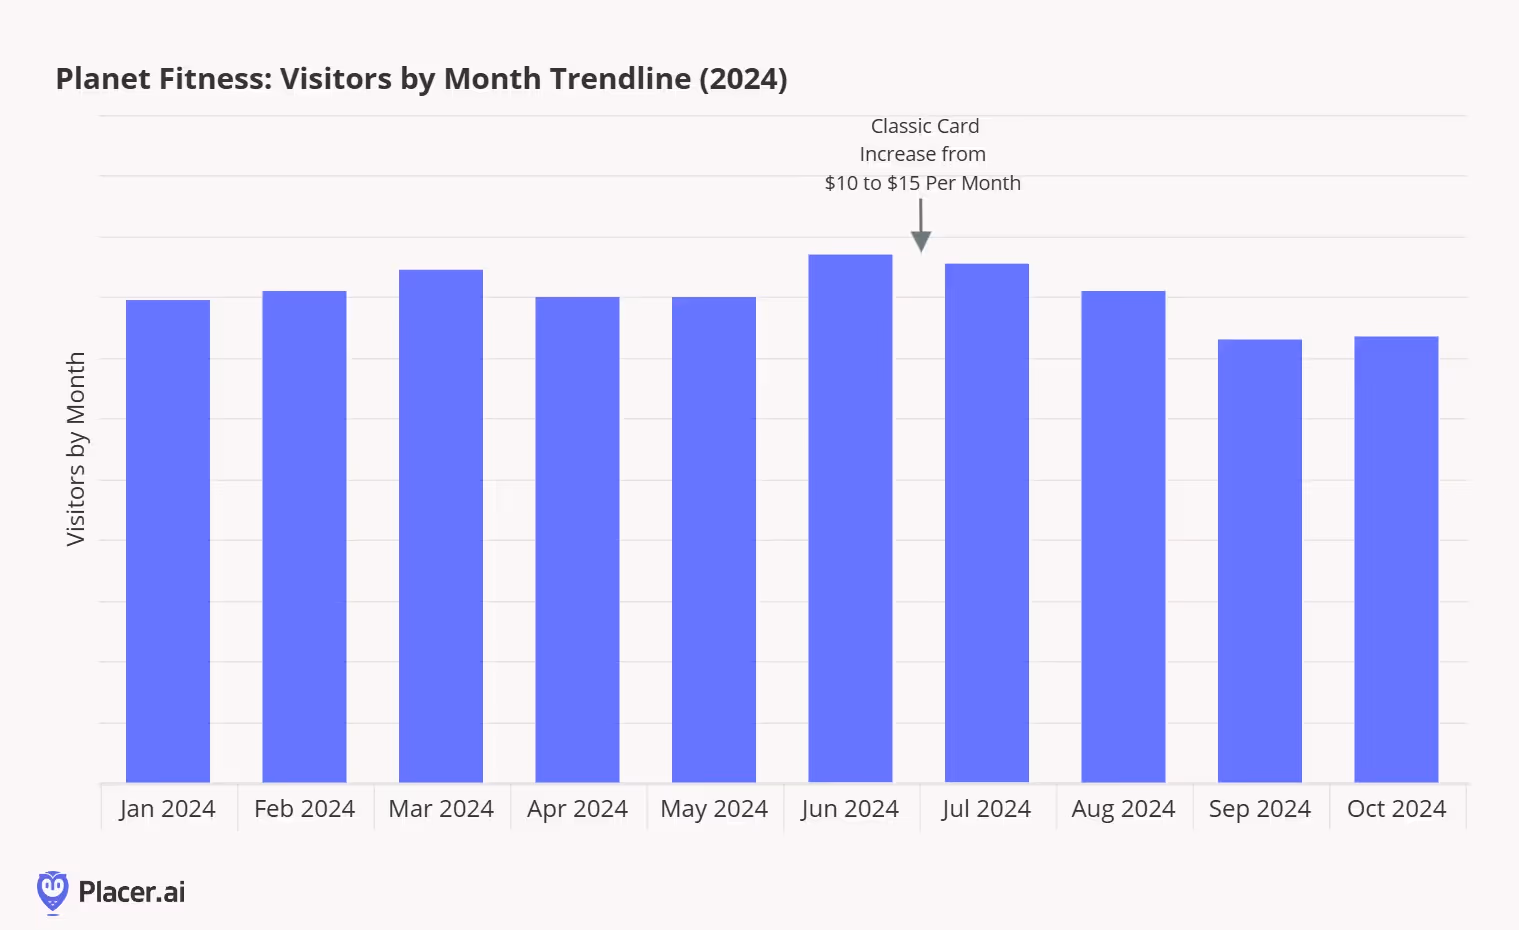
In the third quarter, Planet Fitness posted systemwide same-club sales growth of 4.3% (4.5% growth in franchisee clubs and 3.4% growth in corporate-owned clubs). Approximately 50% of the Q3 2024 comp increase was driven by net member growth, with the remaining balance attributed to rate increases. Our data indicates that the decline in visitors has been relatively modest since the Classic Card price hike. Management corroborated this, noting they “expected a slight decline in membership in Q3 2024, which was more than offset by the rate improvement on the Classic Card and a higher Black Card mix.”
During the quarter, 63.1% of Planet Fitness members were Black Card members (paying $25 per month), up from 62.1% in the same period last year. Management noted that new members are increasingly opting for the higher-priced Black Card membership, likely due to the added value of extra amenities, including access to all club locations, unlimited guest privileges, unlimited use of massage chairs and tanning beds, and discounts on cooler drinks, compared to the base membership.
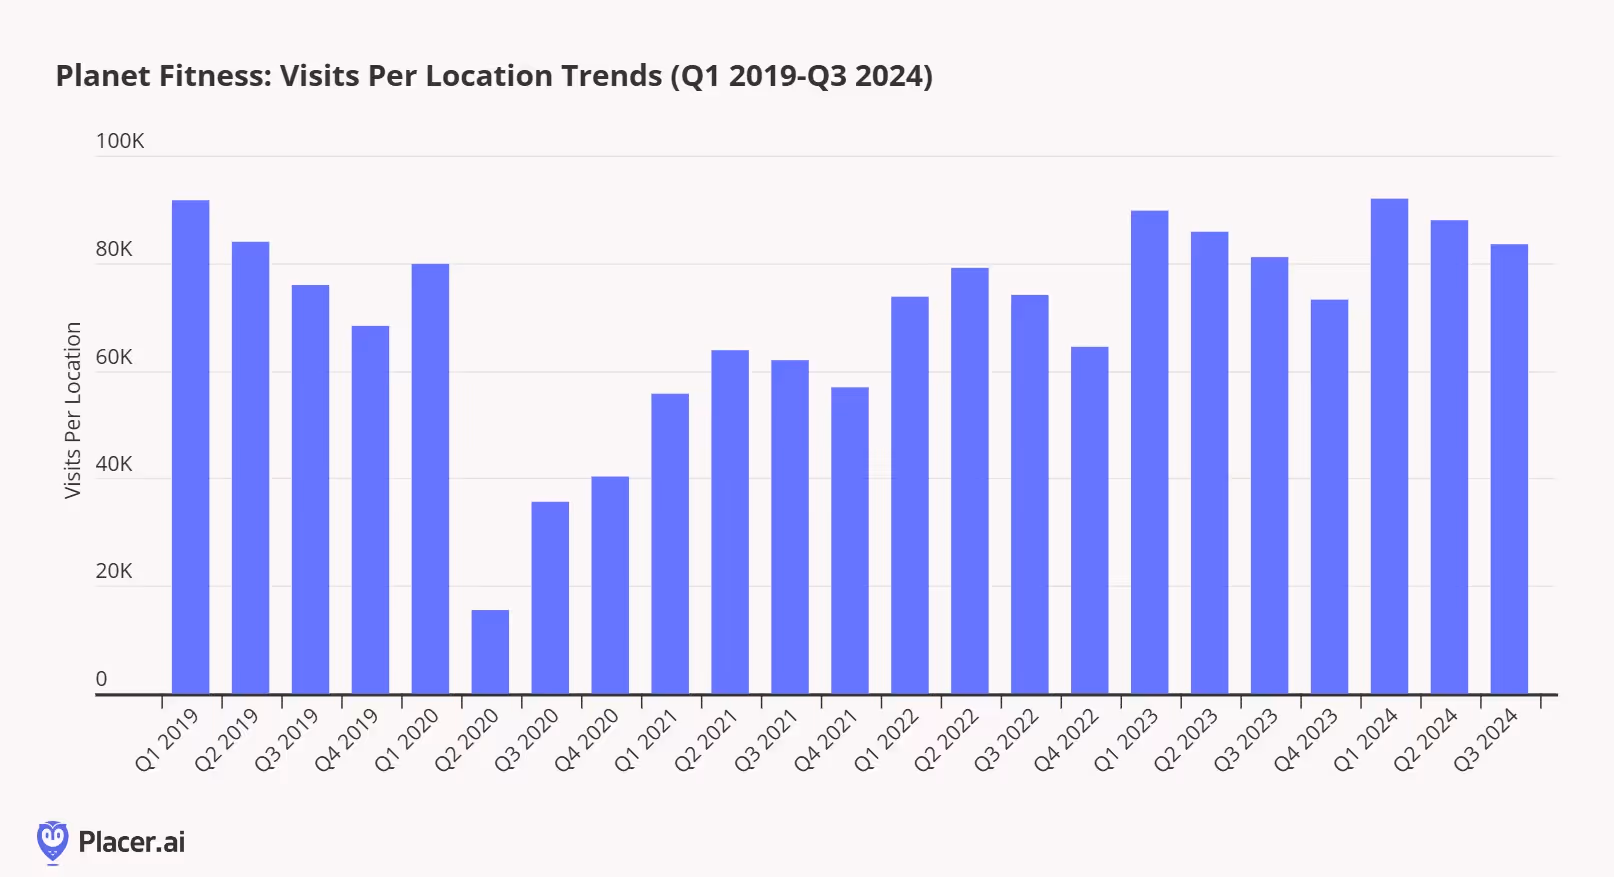
Planet Fitness’ visit-per-location trends further support our thesis that fitness clubs are more resilient to macroeconomic pressures than they were pre-pandemic. In 2019, Planet Fitness averaged nearly 92,000 visits per location in the first quarter, dropping to 68,000 in the fourth quarter—a 25% decrease. This year, Planet Fitness again began with 92,000 visits per location in the first quarter and is projected to close the year with 76,000-78,000 visits per location. This would represent a year-end decrease in the mid-teens, indicating a more stable membership base and lower churn rates than in past years.
Fitness clubs still face challenges in today’s consumer environment. For instance, Equinox-owned Blink Fitness filed for bankruptcy earlier this year, citing pandemic-related deferred rent payments and other factors in its filing. (On a related note, Planet Fitness reportedly made a bid for Blink Fitness this week.) Nonetheless, Planet Fitness' resilience underscores that fitness club unit economics have evolved over the past several years, potentially making them better equipped to handle diverse consumer environments.
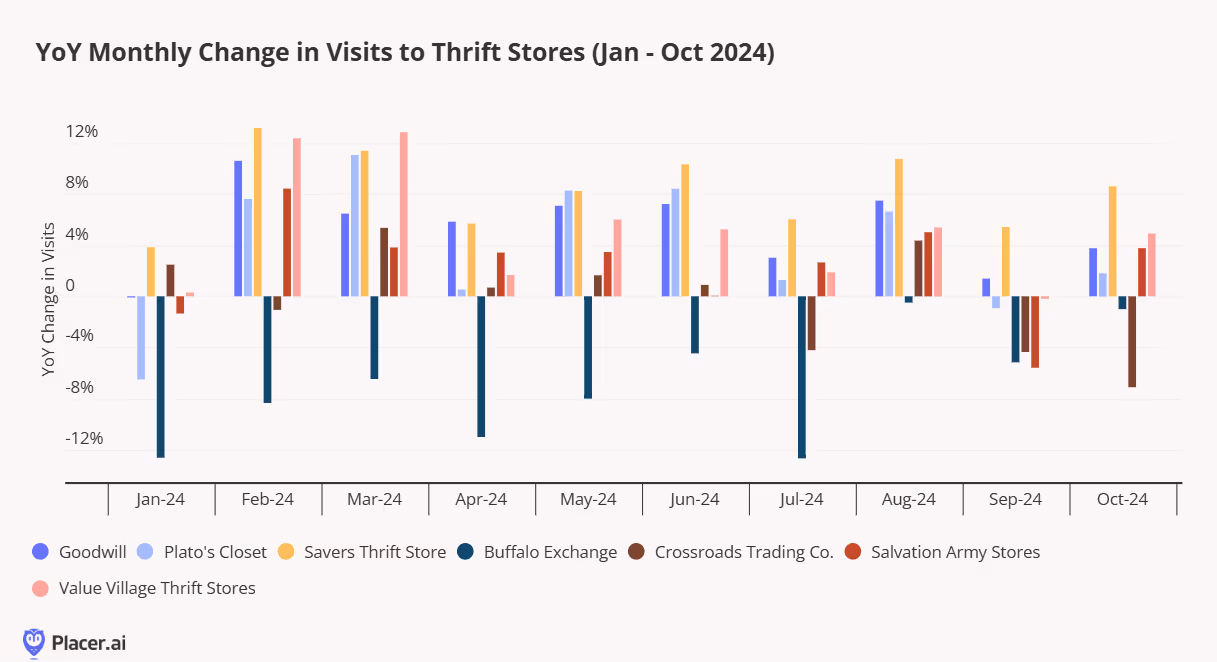
While consumer confidence appears optimistic heading into the holidays, and businesses are feeling more assured now that the election is over, thrifting continues to benefit from tailwinds driven by last year's inflationary pressures, the shift toward sustainability, and Gen Z’s desire for unique items.
We analyzed year-over-year traffic for well-established chains like Goodwill and Salvation Army, as well as for smaller chains like Buffalo Exchange and Crossroads Trading Co. Among these, Savers Thrift Store has experienced the highest growth rate in recent months, with Goodwill also showing consistent increases compared to last year.
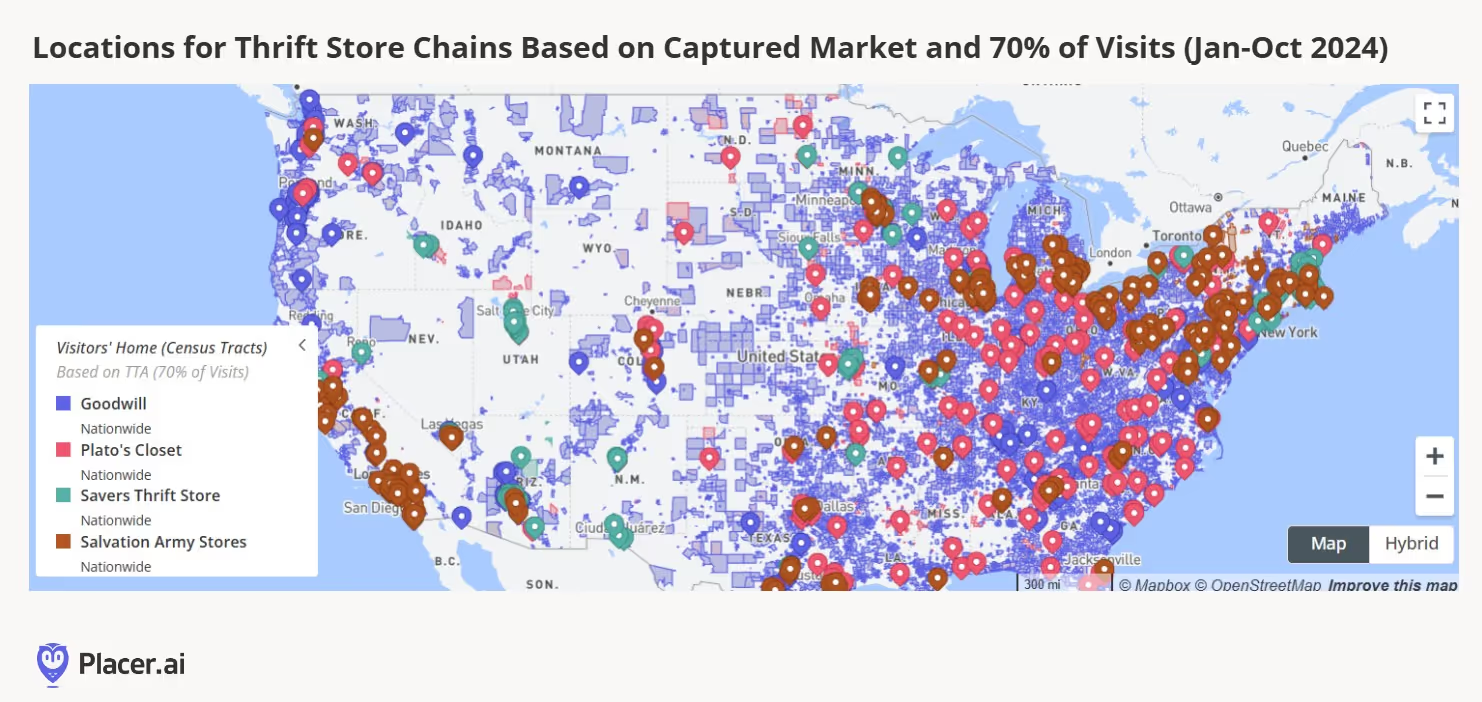
The thrift store footprint is quite strong nationwide, with a concentration of stores in the eastern half of the country and along the West Coast.
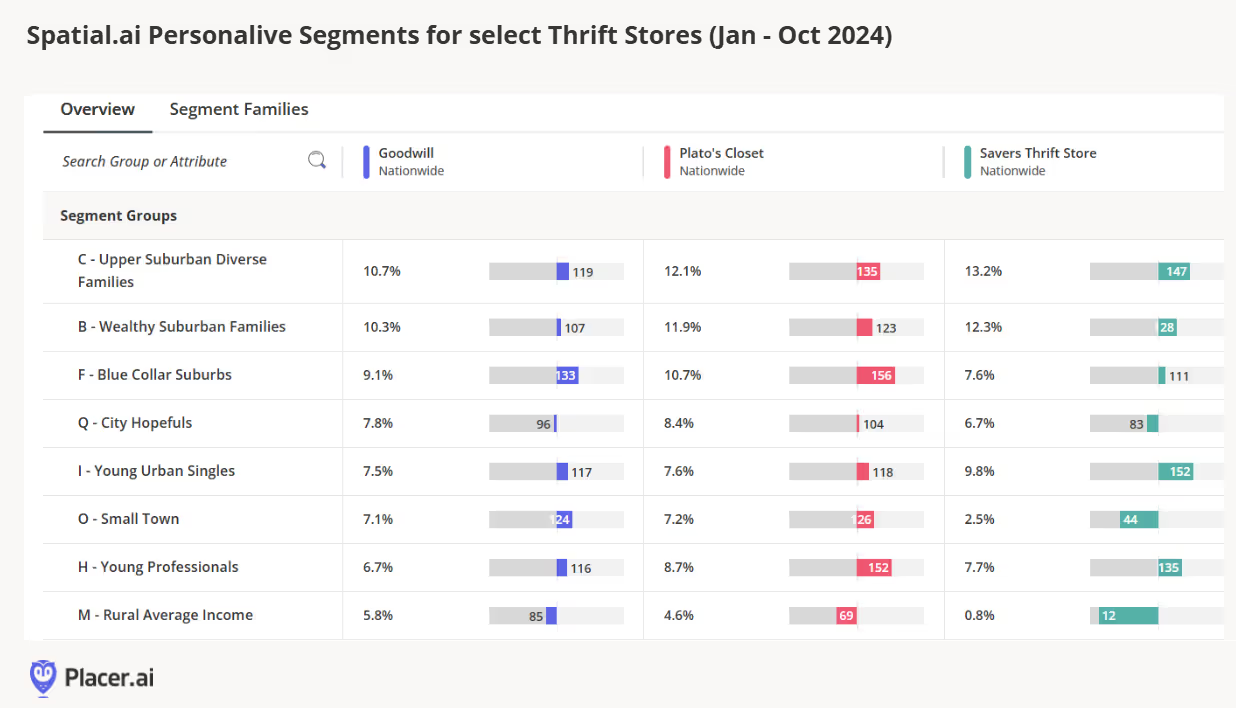
Thrifting is no longer just for lower-income households. In a sign of its upmarket appeal, over 1 in 10 of thrift store captured trade areas are now the "Upper Suburban Diverse Families" segment, and another 1 in 10 are from "Wealthy Suburban Families" according to PersonaLive customer segments. The chart below filters for visitors with a dwell time of at least 10 minutes, indicating that these segments aren’t merely dropping off donations—they’re sticking around to treasure hunt. The thrill of finding a hidden gem has been widely shared on social media platforms like TikTok, where one lucky shopper recently discovered a $6,000 couture wedding dress for the unbelievable price of $25 at Goodwill.
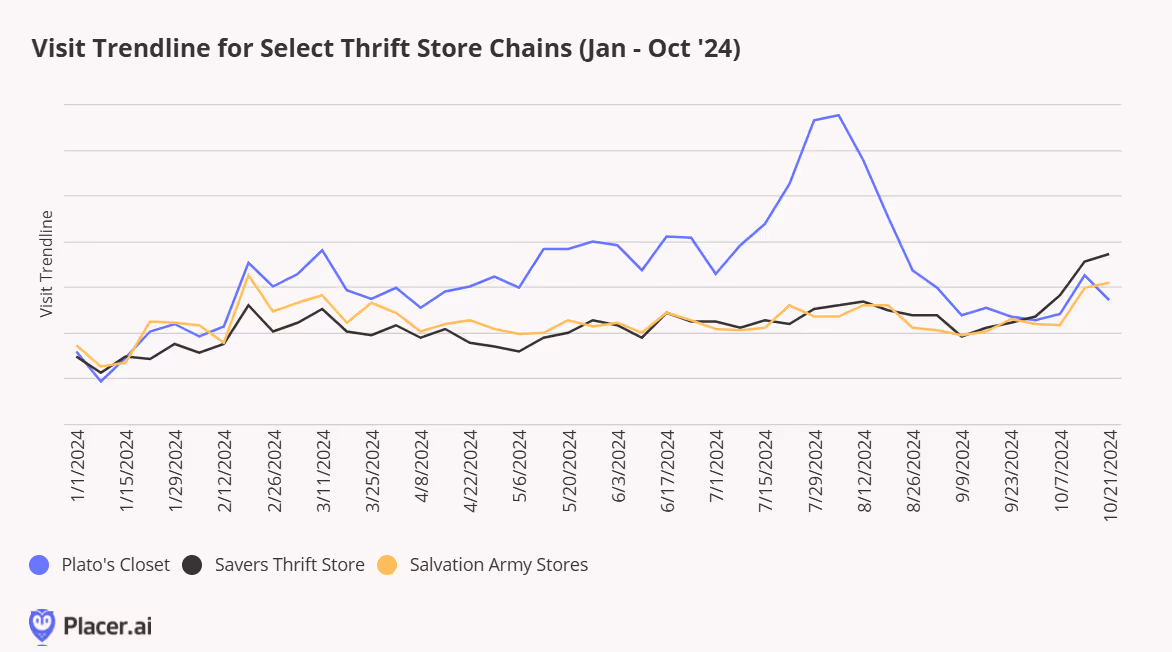
While Goodwill is undoubtedly the largest player in this field, with roughly ten times the visits of its nearest competitor, a substantial share of visits also goes to Plato’s Closet (with over 400 stores tracked by Placer), Salvation Army Stores (400+ tracked by Placer), and Savers Thrift Stores (100+ tracked by Placer). Interestingly, although Savers has just a quarter of the number of stores, its yearly visits nearly match those of Plato’s Closet and Salvation Army Stores during certain months of the year.
Plato’s Closet sees a notable spike in late July and early August, aligning with back-to-school shopping season. With its focus on teens and young adults and an emphasis on popular and fast-fashion brands, it’s no surprise that this chain resonates strongly with its youthful audience.
This past season, one of the major trends has been a love for all things '90s. Popular items include handkerchief hems, baby tees, crop tops, straight jeans, mom jeans, flared jeans (essentially anything but skinny jeans), and, of course, the essential graphic tee. Thrifters are on the hunt for that perfect vintage piece—something unique to wear to a concert or party and, most importantly, to showcase on social media.
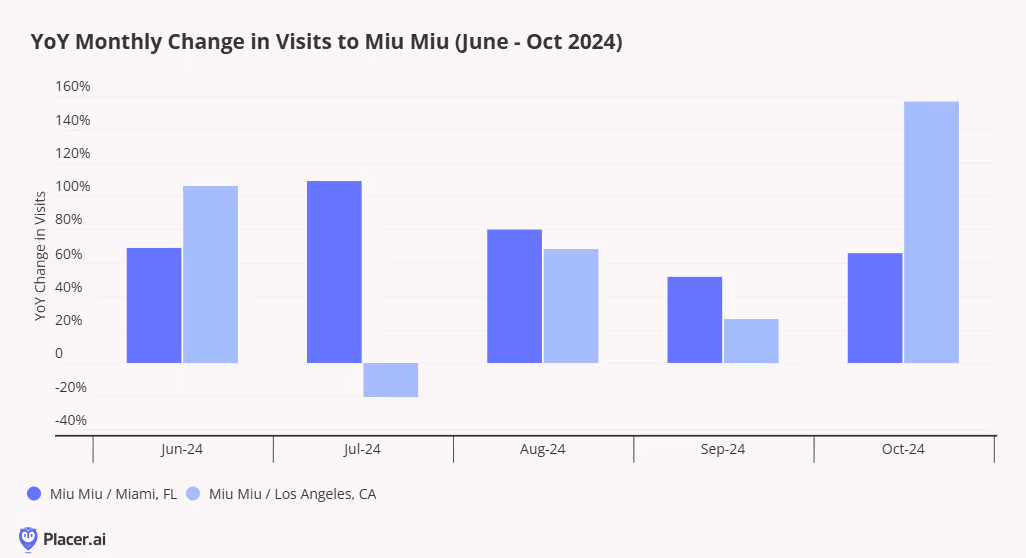
Fashion is cyclical, and often, if you hold onto something long enough, it just might come back into style. Hoarders can rejoice, as new generations are now seeking out biker boots, pedal pushers, Fendi baguettes, and satin slip dresses. Today’s teens are also drawn to brands their parents might have worn, like surfer favorites Stussy, Roxy, and O’Neill. Miu Miu, a current favorite in the fashion world despite a slight slowdown in luxury, even sent board shorts down their runway. Miu Miu has consistently been on-trend over the past few years, from micro miniskirts to last month’s playful twist on athleisure with foot warmers and leg warmers.
Other notable ‘90s throwbacks include Hypercolor shirts—T-shirts that change color with body heat, like when a handprint is left behind. For the colder months, surf fashion is evolving into styles suited for cozy bonfire nights at the beach. "Shackets" (shirt jackets) in soft flannels and plaids are trending, with stores like Faherty and Marine Layer offering pieces reminiscent of the fashion seen in The O.C.
From a retail perspective, popular '90s and 2000s brands like Mango and True Religion are making a strong return to brick-and-mortar. Mango, a Spanish fast-fashion brand similar to Zara, first entered the U.S. in the 2000s but later withdrew in 2015. Now, it’s back with a U.S.-focused strategy, opening a flagship store at 711 Fifth Avenue in New York—formerly home to iconic brands like NBC, Columbia Pictures, and Coca-Cola. Mango plans to have over 40 stores in the U.S. by the end of 2024 and 500 global stores by 2026.
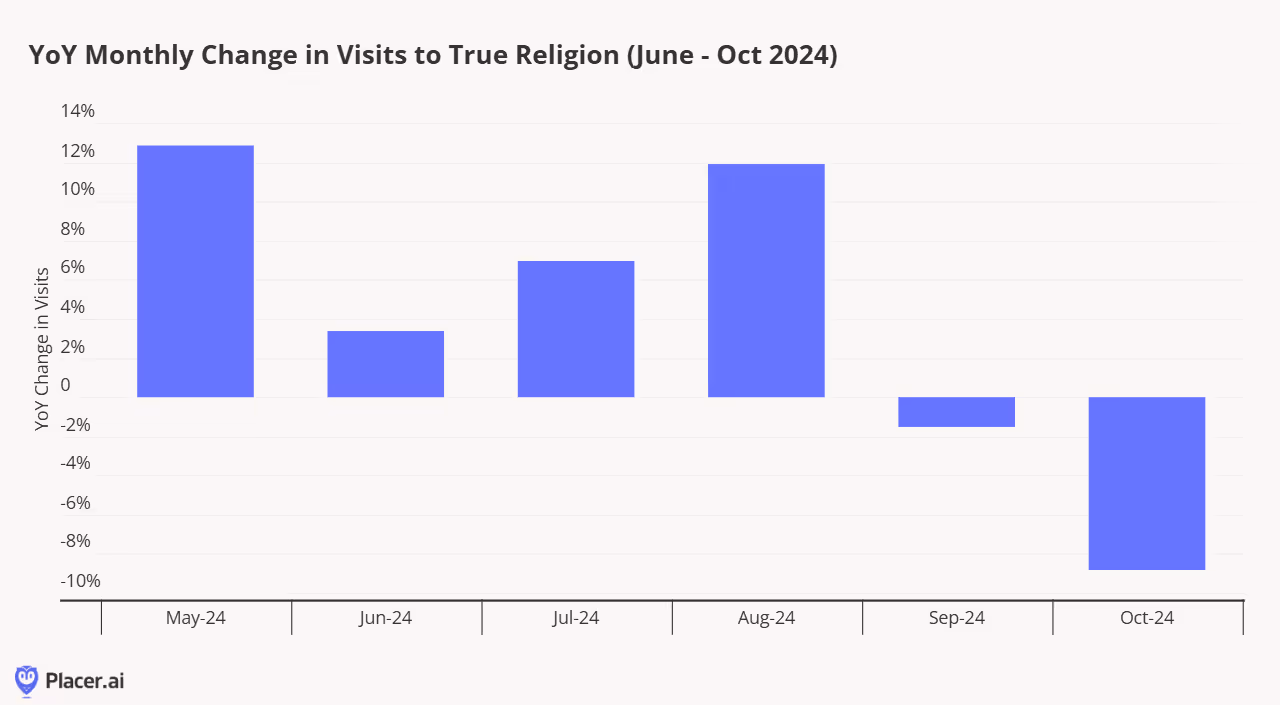
In the ‘90s, pop stars like Britney Spears and Christina Aguilera made low-rise jeans with the iconic True Religion horseshoe logo a staple. Now, True Religion has returned, with Megan Thee Stallion as a spokesperson. The brand saw strong performance in spring and summer, likely boosted by back-to-school shopping in August. Although year-over-year traffic dipped slightly in September and October, we anticipate a rise in traffic with the upcoming holiday season.
Every year, consumers head to the shops for costumes, spooky yard decorations, candy and Halloween supplies. Many dining chains also roll out Halloween-themed offers. We take a look at the data to find out how Halloween 2024 impacted retail and dining visits.
Shira Petrack
Nov 7, 2024
4 minutes
Every year towards the end of October, consumers head to the shops for costumes, spooky yard decorations, candy and Halloween supplies. At the same time, many national dining chains roll out Halloween-themed limited time offers (LTOs) to lure in revelers. So what was this year’s Halloween impact on retail and dining visits? We dove into the data to find out.
Retail for Halloween Prep, Dining for Holiday Fun
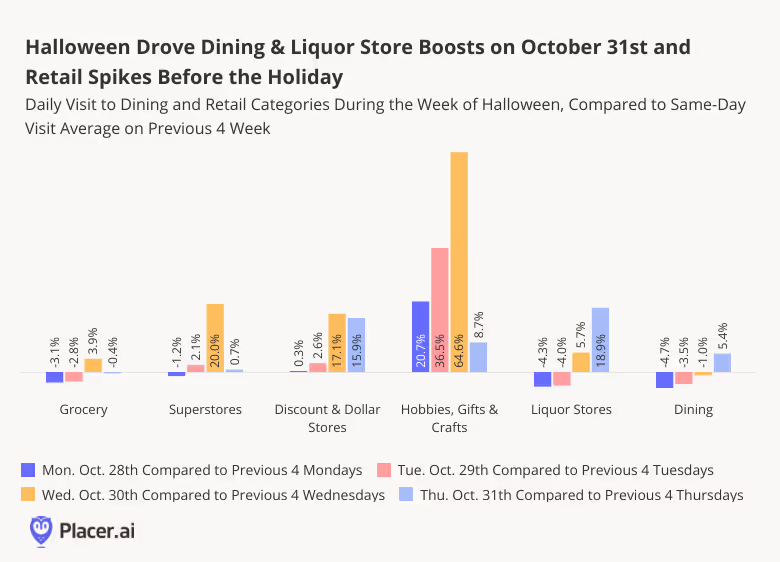
Halloween may not be Black Friday, but the ghostly holiday drives significant dining and retail visit spikes of its own. Comparing daily visit patterns during the week of Halloween to previous weeks’ averages reveals Halloween’s varied impact on the different brick-and-mortar sectors.
For most retail sectors – including grocery stores, superstores, discount & dollar stores, and hobbies, gift & craft stores – holiday visits peaked on October 30th, as consumers got their Halloween supplies before the holiday. Hobbies, gift & craft stores saw the biggest visit increases, with traffic on Monday, October 28th already up 20.7% compared to the average for the previous four Mondays, as patrons sought out the perfect costume piece or yard decoration. Meanwhile, liquor stores – where visits also increased the day before Halloween – got an even bigger boost on October 31st, likely thanks to party hosts and guests grabbing last minute refreshments ahead of the night’s festivities.
Unlike in the retail space, where visits increased prior to the holiday, the Halloween-driven dining visit spike was confined to October 31st. Dining visits on Halloween were up 5.4% compared to the previous four Thursdays’ average – impressive for a category not traditionally associated with Halloween spending. This spike was likely fueled by the many Halloween-themed LTOs across the category.
LTOs Drive Halloween Dining Spikes
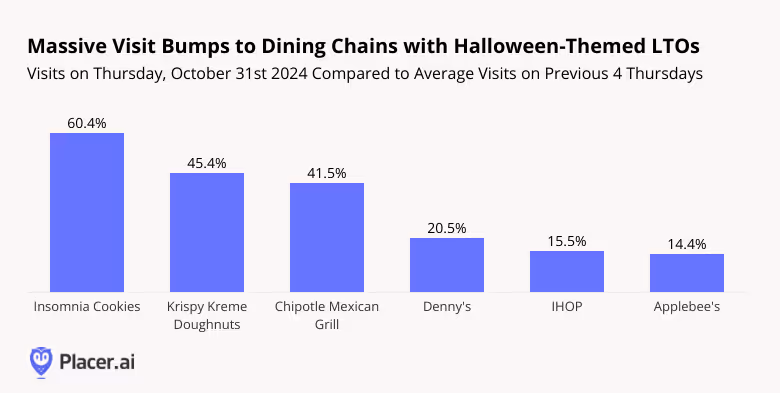
Indeed, many of the major dining chains that saw double-digit visit spikes on October 31st offered Halloween-related promotions. Insomnia Cookies gave away cookies and Krispy Kreme Doughnuts offered free donuts to customers who came in wearing costumes – and visits to the two chains jumped 60.4% and 45.4%, respectively, compared to the average of the previous four Thursdays. And the promise of discounts was almost as alluring as the promise of free stuff – Chipotle offered a deeply discounted entree to any Chipotle Rewards member coming in costume, leading to a 41.5% boost in Halloween foot traffic.
Full-service restaurants also got in on the Halloween action. Denny’s customers who dined on-site donning a costume received free Halloween pancakes, helping drive a 20.5% increase in Thursday visits on October 31st. IHOP, which offered a free “Scary Face Pancake” for kids 12 and under with the purchase of an adult entree, saw its visits rise 15.5% compared to its recent Thursday average. And Applebee’s “Dollar Zombie” cocktail – available throughout the month of October – may have contributed to the 14.4% Halloween visit increase from customers looking to consume the themed drink during the holiday.
Superstores for pre-Halloween Prep, Dollar & Discount Stores for Last Minute Touches
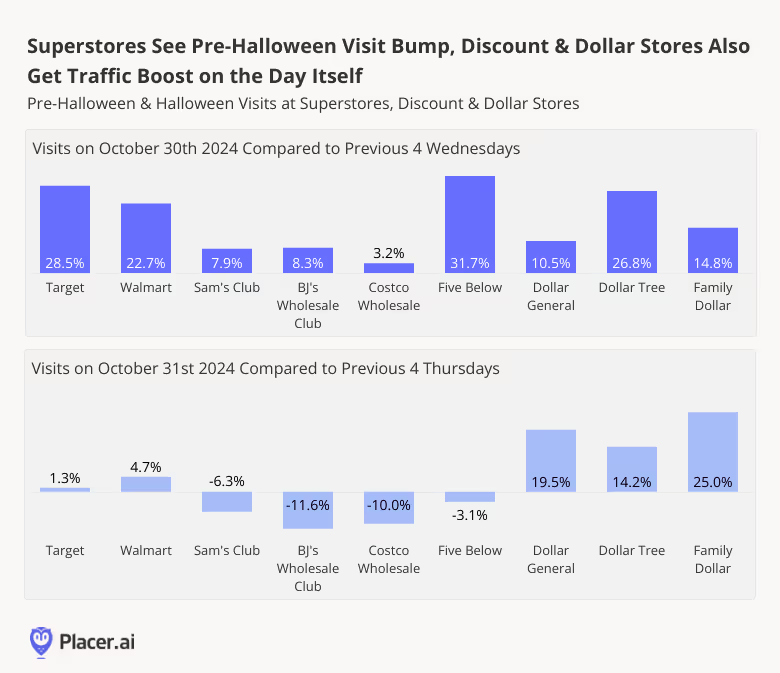
Halloween prep often requires a trip to the store – so unlike dining chains, where traffic peaked on Halloween itself, most retail sectors received the largest holiday-driven boost on October 30th. Visits to Target, Walmart, Sam’s Club, BJ’s Wholesale Club, and Costco Wholesale were up on Wednesday, October 30th compared to a recent Wednesday average – but by October 31st, foot traffic was mostly back to normal (although Walmart visits were still slightly elevated).
Meanwhile, discount & dollar leaders Dollar General, Dollar Tree, and Family Dollar experienced foot traffic jumps on both October 30th and October 31st – with the Halloween spikes at Dollar General and Family Dollar even surpassing the pre-Halloween boosts at those retailers. These visitation patterns indicate that consumers likely visit both superstores and dollar stores for pre-Holiday prep but are more likely to head to discount & dollar chains for last minute Halloween purchases.
Party City Receives Largest Pre-Halloween Visit Boost
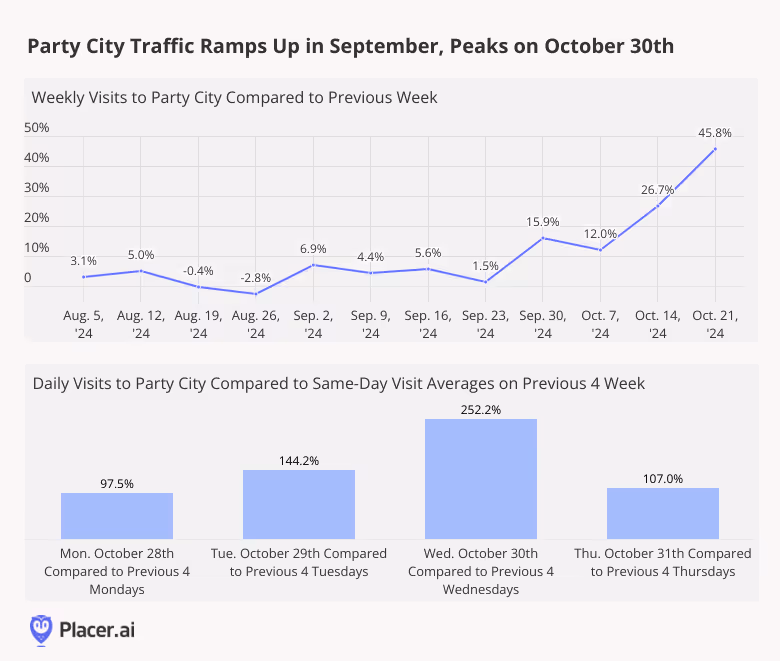
While superstores and discount & dollar stores receive a significant share of Halloween-driven retail foot traffic, the biggest beneficiaries of the season appear to have been party supply stores – with Party City in the lead. Visits to the retailer began steadily increasing week-over-week in the beginning of September, with Wednesday, October 30th seeing a whopping 252.2% increase in visits compared to the average on the previous four Wednesdays.
Party City’s Halloween success indicates that, when it comes to special occasions, specialized retailers still play an important role in the brick-and-mortar retail landscape.
Halloween brought consumers out to stores and restaurants, highlighting an appetite for celebrating special occasions which may bode well for the upcoming holiday season. How will the rest of Q4’s retail milestones perform?
Follow Placer.ai’s data-driven retail analyses to find out.
Dive into the data to find out how the dining category is performing in 2025, which segments are coming out on top, and how dining consumer behavior has shifted in recent years.
June 26, 2025
10 minutes
Key Takeaways:
1. Overall dining traffic is mostly flat, but growth is concentrated in specific areas.
While nationwide dining visits were nearly unchanged in early 2025, western states like Utah, Idaho, and Nevada showed moderate growth, while states in the Midwest and South, along with Washington D.C., saw declines.
2. Fine dining and coffee chains are growing through expansion, not just busier locations.
These two segments were the only ones to see an increase in total visits, but their visits-per-location actually decreased, indicating that opening new stores is the primary driver of their growth.
3. Higher-income diners are driving the growth in resilient categories.
The segments that saw visit growth—fine dining and coffee—also attracted customers with the highest median household incomes, suggesting that affluent consumers are still spending on dining despite economic headwinds.
4. Remote work continues to reshape dining habits.
The share of suburban customers at fine dining establishments has increased since 2019, while it has decreased for coffee chains. This reflects a shift towards "destination" dining closer to home and away from commute-based coffee runs.
5. Limited-service restaurants own the weekdays; full-service restaurants win the weekend.
QSR, fast casual, and coffee chains see the majority of their traffic from Monday to Friday, whereas casual and fine dining see a significant spike in visits on weekends.
6. Each dining segment dominates a specific time of day.
Consumer visits are highly predictable by the hour: coffee leads in the early morning, fast casual peaks at lunch, casual dining takes the afternoon, fine dining owns the dinner slot, and QSR captures the late-night crowd.
Year-over-Year Dining Traffic Trends
Dining Visits Mostly Up in the West, Down in Most of Midwest and East
Overall dining visits held relatively steady in the first five months of 2025, with year-over-year (YoY) visits to the category down 0.5% for January to May 2025 compared to the same period in 2024. Most of the country saw slight declines (less than 2.0%), though some states and districts experienced larger drops: Washington, D.C, saw the largest visit gap (-3.6% YoY), followed by Kansas and North Dakota (-2.9%), Arkansas (-2.8%), Missouri and Kentucky (-2.6%), Oklahoma (-2.1%), and Louisiana (-2.0%).
Still, there were several pockets of moderate dining strength, specifically in the west of the United States. January to May 2025 dining visits in Utah, Idaho, and Nevada increased 1.8% to 2.4% YoY, while the coastal states saw traffic rise 0.6% (California) to 1.2% (Washington). Vermont also saw a slight increase in dining visits (+1.9%).
Coffee & Fine Dining See Strongest Overall Visit Growth
Diving into visit trends by dining segment shows that fine dining and coffee saw the strongest overall visit trends, with visits to the segments up 1.3% and 2.6% YoY, respectively, between January and May 2025. But visits per location trends were negative for both segments – a decline of 0.8% YoY for fine dining and 1.8% for coffee during the period – suggesting that much of the visit strength is due to expansions rather than more crowded restaurants and coffee shops.
In contrast, full-service casual dining saw overall visits decrease by 1.5%, while visits per location remained stable (+0.2%) YoY between January and May 2025. Several casual dining chains have rightsized in the past twelve months – including Red Lobster, TGI Fridays, and Outback Steakhouse – which impacted overall visit numbers. But the data seems to show that their rightsizing was effective, as the remaining locations successfully absorbed the traffic and maintained performance levels from the previous year. And the monthly data also provides much reason for optimism, with May traffic up both overall and on a visit per location basis – suggesting that the casual dining segment is well positioned for growth in the second half of 2025.
Meanwhile, QSR and fast casual chains saw similar minor visits per venue dips (-1.5% and -1.2%, respectively). At the same time, QSR also saw an overall visit dip (-0.8%) while traffic to fast casual chains increased slightly (+0.3%) – suggesting that the fast casual segment is expanding more aggressively than QSR. But the two segments decoupled somewhat in May, with overall traffic and visits per venue to fast casual chains up YoY while traffic remained flat and visits per venue fell slightly for QSR – perhaps due to the relatively greater affluence of fast casual's consumer base.
Dining Demographics
Visitor Income Levels Hold Steady in Most Segments
Analyzing the income levels of visitors to the various dining segments over time shows that each segment followed a slightly different trend – and the differences in visitor income may help explain some of the current traffic patterns.
The only three segments with YoY visit growth – casual dining, fine dining, and coffee – also had the highest captured market median household income (HHI). Although the median HHI in the captured market of upscale and fine dining chains fell after COVID, it has risen back steadily over time and now stands at $98.0K – slightly higher than the $97.1K median HHI between January to May 2019. This may explain the segment's resilience in the face of wider consumer headwinds. Meanwhile, the median HHI at fast casual and coffee chains has fallen slightly, perhaps due to aggressive expansions in the space – including Dave's Hot Chicken and Dutch Bros – which likely broadened the reach of the segments, driving visits up and trade area median HHI down.
Like fine dining, casual dining also saw its trade area median HHI increase slightly over time – but the segment has still been facing visit dips. This could mean that, even though consumers trading down to casual dining may have boosted the trade area median HHI for the segment, it still might not have been enough to make up for the customers lost to tighter budgets.
The QSR segment saw its trade area median HHI remain remarkably steady – and visits to the segment have also been quite consistent – staying between $70.6K and $70.9K between 2019 and 2025 – which may explain why the segment's visits remained relatively stable YoY.
Suburban Dining Patterns
Diving into the psychographic segmentation shows that, although the fine dining segment attracted visitors from the highest-income areas between January and May 2025, fast casual chains drew the highest share of visitors from suburban areas, followed by casual dining and coffee. QSR attracted the smallest share of suburban visitors, with just 30.5% of the category's captured market between January and May 2025 belonging to Spatial.ai: PersonaLive suburban segments.
But looking at the data since 2019 reveals small but significant changes in the shares of suburban audiences in some categories' captured markets. And although the percentage changes are slight, these represent hundreds of thousands of diners every year.
The data shows that shares of suburban segments in the captured markets of fine dining chains have increased, while their share in the captured market of coffee chains has decreased. The shares of suburban visitors to QSR, fast casual, and casual chains have remained relatively steady.
This may suggest that the COVID-19 pandemic and the subsequent rise of remote and hybrid work models are still impacting consumer dining habits, benefiting destination-worthy experiences in suburban locales such as fine dining chains while reducing the necessity of daily coffee runs that were often tied to commuting and office work. Meanwhile, the stability in QSR, fast casual, and casual dining segments could indicate that these categories continue to meet consistent suburban demand for convenience and everyday dining, largely unaffected by the redistribution seen in the fine dining and coffee sectors.
Dining Consumer Behavior Trends
Although QSR, fast casual, casual dining, fine dining, and coffee all fall under the wider dining umbrella, the data shows distinct consumer behavior patterns regarding visits to these five categories.
Limited Service Leads Weekday Visit Share, Full Service Rules the Weekend
Limited service segments, including QSR, fast casual, and coffee tend to see higher shares of visits on weekdays, while full service segments – casual dining and fine dining – receive higher shares of weekend visits. Diving deeper shows that QSR has the largest share of weekday visits, with 72.3% of traffic coming in between Monday and Friday, followed by fast casual (69.8% of visits on weekdays) and coffee (69.4% of visits on weekdays.) Looking at trends within the work week shows that QSR receives a slightly larger visit share between Monday and Thursday compared to the other limited service segments. Meanwhile, coffee seems to receive the smallest share of Friday visits – 16.3% compared to 17.0% for fast casual and 17.2% for QSR.
On the full-service side, casual dining and fine dining chains have relatively similar shares of weekend visits (39.0% and 38.8%, respectively), but fine dining also sees an uptick of visits on Fridays (with 19.1% of weekly visits) as consumers choose to start the weekend on a festive note.
Each Segment Owns a Different Daypart
Hourly visit patterns also show variability between the segments. Coffee is the unsurprising leader of early visits, with 14.6% of visits taking place before 8 AM and, almost two-thirds (64.9%) of visits taking place before 2 PM. Fast casual leads the lunch rush (29.4% of visits between 11 AM and 2 PM), casual dining chains receive the largest share of afternoon (2 PM to 5 PM) visits, and fine dining chains receive the largest share of dinner visits, with almost 70% of visits taking place between 5 PM and 11 PM. QSR leads the late night visit share – 4.1% of visits take place between 11 PM and 5 AM – followed by casual dining chains (3.2% late night and overnight visit share), likely due to the popularity of 24-hour diners.
This suggests that each dining segment effectively "owns" a different part of the day, from the morning coffee ritual and the quick lunch break to the leisurely evening meal and late-night cravings.
Shorter Visits in Most Segments
An analysis of average visit duration also reveals a small but lasting shift in post-pandemic dining behavior. Between January and May 2025, the average dwell time for nearly every dining segment was shorter than during the same period in 2019. This efficiency trend is evident across limited-service categories like QSR, fast casual, and coffee shops, suggesting a continued emphasis on speed and convenience.
The one notable exception to this trend is upscale and fine dining, where the average visit duration has actually increased compared to pre-COVID levels. This may suggest that, while visits to most segments have become more transactional, consumers are treating fine dining more as an extended, deliberate experience, reinforcing its position as a destination-worthy occasion.
Dive into the data to see how consumer response to major promotional events – from Black Friday and the back-to-school shopping rush to brand-crafted LTOs – varies by market.
June 19, 2025
Key Takeaways
1. The Midwest is the only region where Black Friday retail visits outpace Super Saturday.
But several major Midwestern markets, including Chicago and Detroit, actually see higher shopper turnout on Super Saturday.
2. Holiday season demographic shifts also vary across regions.
Nationwide, electronics stores see a slight uptick in median household income (HHI) in December – yet in certain markets, electronics retailers such as Best Buy see a drop in captured market median HHI during this period.
3. Back-to-school shopping starts earliest for clothing and office supplies retailers in the South Central region, likely tied to earlier school schedules.
But back-to-school visits surge higher for these retailers in the Northeast later in the season.
4. The share of college students among back-to-school shoppers varies by region.
In August 2024, “Collegians” made up the largest share of Target’s back-to-school shopping crowd in New England, and the smallest in the West.
5. Mother’s Day drives the biggest restaurant visit spikes in the Middle Atlantic Region, while Father’s Day sees its biggest boosts in the South Atlanticstates.
Mother’s Day diners also tend to travel farther to celebrate, suggesting an extra effort to treat mom.
6. Western states proved particularly responsive to McDonald’s recent Minecraft promotion.
During the week of A Minecraft Movie’s release, the promotion drove significantly higher visit spikes in the West than in the Eastern U.S.
Zooming in on Local Trends
Retailers rely on promotional events to fuel sales – from classics like Black Friday and back-to-school sales to unique limited-time offers (LTOs) and pop-culture collaborations. Yet consumer preferences and behavior can vary significantly by region, making it critical to tailor campaigns to local markets.
This report dives into the data to reveal how consumers in 2025 are responding to major retail promotions, exploring both broad regional trends and more localized market-level nuances. Where is Black Friday most popular, and which areas see a bigger turnout on Super Saturday? Where are restaurants most packed on Mother’s Day, and where on Father’s Day? Which region kicks off back-to-school shopping – and where are August shoppers most likely to be college students? And also – which part of the country went all out on McDonald’s recent Minecraft LTO?
Read on to find out.
The Holiday Season: A Regional Story
Promotions aimed at boosting foot traffic on key holiday season milestones like Black Friday and Super Saturday are central to retailers’ strategies across industries. The day after Thanksgiving and the Saturday before Christmas typically rank among in-store retail’s busiest days, last year generating foot traffic surges of 50.1% and 56.3%, respectively, compared to a 12-month daily average. And
But a closer look at regional data shows that these promotions land differently across the country. In the Midwest, Black Friday outperformed Super Saturday last year, fueling the nation’s biggest post-Thanksgiving retail visit spike – a testament to the milestone’s strong local appeal. Meanwhile, in the Western U.S. Black Friday trailed well behind Super Saturday, though both milestones drove smaller upticks than in other regions. And in New England and the South Central states, Super Saturday achieved its biggest impact, suggesting that last-minute holiday specials may resonate especially well in that area.
Plenty of Local Variety
Digging deeper into major Midwestern hubs shows that even within a single region, holiday promotions can produce widely different responses.
In St. Louis, Indianapolis, and Minneapolis, for example, consumers followed the broader Midwestern pattern, flocking to stores on Black Friday exhibiting less enthusiasm for Super Saturday deals. By contrast, Chicago and Detroit saw Super Saturday edge ahead, with Chicago’s Black Friday peak falling below the nationwide average of 50.1%. examples highlight the power of local preferences to shape holiday campaign results.
Differing Demographic Shifts Across Regions
Holiday promotions don’t just drive visit spikes; they also spark subtle but significant changes in the demographic profiles of brick-and-mortar shoppers, expanding many retailers’ audiences during peak periods. And these shifts, too, can vary widely across regions.
Outlet malls, department stores, and beauty & self-care chains, for instance, which typically attract higher-income consumers, tend to see slight declines in the median household incomes (HHI) of their visitor bases in December. This dip may be due to promotions drawing in more mid- and lower-income shoppers during the peak holiday season. Electronics stores and superstores, on the other hand, which generally serve a less affluent base, see modest upticks in median HHI in the lead-up to Christmas.
But once again, drilling further down into regional chain-level data reveals more nuanced regional patterns. Take Best Buy, a leading holiday season electronics destination. In some of the chain’s biggest, more affluent markets – including New York, Los Angeles, and Chicago – the big-box retailer sees small dips in median HHI during December. But in Atlanta and Houston – also relatively affluent, but slightly less so – December saw a minor HHI uptick, hinting at a stronger holiday rush from higher-income shoppers in those cities.
Back-to-School Bonanzas
Back-to-school promotions also play a pivotal role in the retail calendar, with superstores, apparel chains, office supply stores and others all vying for shopper attention. And though summer markdowns drive increased foot traffic nationwide, both the timing of these shifts and the composition of the back-to-school shopping crowd differ among regions.
A Southern Head Start
Analyzing weekly fluctuations in regional foot traffic to clothing and office supplies stores shows, for example, that back-to-school shopping picks up earliest in the South Central region, likely due to earlier school start dates.
But the biggest visit peaks occur in the Northeast – with clothing retailer foot traffic surging in New England in late August, and office supplies stores seeing an even bigger surge in the Middle Atlantic region in early September. Retailers and advertisers can plan their back-to-school deals around these differences, targeting promotions to local trends.
A New England Collegian Affair
Though K-12 families drive much of the back-to-school rush, college student shoppers also play a substantial role. And here, too, their participation varies by region.
For instance, the “Collegians” segment accounted for 2.2% of Target’s shopper base nationwide over the past year – rising to 3.0% in August 2024. But regionally, the share of “Collegians” soared as high as 4.0% in New England versus just 2.2% in the West. So while retailers in New England may choose to lean into the college vibe, those in Western states may place greater emphasis on families with children.
Mother’s Day and Father’s Day: Differing Dining Peaks
When it comes to dining, Mother’s Day and Father’s Day are the busiest days of the year for the full-service restaurant (FSR) category, as families treat their parents to a hassle-free meal out. And eateries nationwide capitalize on this trend by offering a variety of deals and promotions that add a little extra charm (and value) to the experience.
Atlantic Specials
Nationwide, Mother’s Day drives more FSR foot traffic than Father’s Day – except in parts of the Pacific Northwest, where Father’s Day traditions run especially deep. Still, the size of these holiday boosts varies substantially by region.
This year, for instance, Mother’s Day (May 11, 2025) drove the largest FSR surge in the Middle Atlantic, with the South Atlantic and Midwest not far behind. Father’s Day, by contrast, saw its biggest lift in the South Atlantic. Mother’s Day proved least resonant in the West, whereas Father’s Day had its smallest impact in New England.
Going the Extra Mile for Mom
Dining behavior also differs between the two occasions. Mother’s Day celebrants display a slight preference for morning FSR visits and a bigger one for afternoon visits, while Father’s Day crowds favor evenings – perhaps reflecting a preference for sports bars and later dinners with dad. Another interesting nuance: On Mother’s Day, a larger share of FSR visits originate from between 3 and 50 miles away compared to Father’s Day, suggesting that families go the extra mile – sometimes literally – to celebrate mom.
Self-Styled Celebrations: Driving Traffic with DIY Milestones
While established dates like Black Friday or Mother’s Day naturally spur promotions, brands can also craft their own moments with limited-time offers (LTOs). And much like holiday campaigns, these retailer-led events can produce varied outcomes across different regions.
Fast food restaurants, for example, have leaned heavily on limited-time offers (LTOs) and pop-culture tie-ins to fuel buzz in what remains a challenging overall market. And McDonald’s recent Minecraft promotion, launched on April 1, 2025 to coincide with the April 3 release of A Minecraft Move, shows just how impactful the practice can be.
Nationally, the Minecraft promotion (featuring offerings for both kids and adults) drove a 6.9% lift in visits during the movie’s opening week. But the impact of the promotion was far from uniform across the U.S. Many of McDonald’s Western markets – including Utah, Idaho, Nevada, California, Texas, Arizona, Colorado, and Oregon – recorded visit lifts above 10.0%. Meanwhile, Kentucky saw a 2.1% dip, and several other Eastern states registered modest gains below 3.0%. The McDonald’s example illustrates the power of regional tastes to shape the success of even the most creative pop-culture collabs.
Adopting a Regional Lens
Whether it’s properly timing holiday and back-to-school discounts, recognizing where Mother’s Day or Father’s Day will resonate more, or pinpointing markets that respond best to pop-culture tie-ins, the data reveals that effective promotions depend heavily on local nuances. And by analyzing regional and DMA-level trends, retailers and advertisers can craft compelling, relevant campaigns that heighten engagement where it matters most.
Discover how mall anchors are transforming in 2025 – and how a foot-traffic-focused approach to choosing key tenants can drive visits and shopper engagement.
May 29, 2025
8 minutes
Key Takeaways
1. Experiential and niche retailers can deliver anchor-level traffic. At Towne East Square Mall, the addition of a Scheels in 2023 significantly increased foot traffic and long-distance travelers, while Barnes & Noble at Coronado Center in Albuquerque has become a key driver of both foot traffic and higher-spend demographics.
2. Size isn’t everything – especially for dining venues. At Glendale Galleria and Northridge Fashion Center, smaller restaurants attracted more foot traffic than some traditional anchors.
3. Refocusing on tenants’ actual traffic contributions enables a flexible anchor approach. Balancing weekend draws like Scheels with weekday favorites such as Costco or Chick-fil-A can help maintain steady visitor flow throughout the week. Similarly, onsite fitness clubs can shift traffic to earlier in the day – an opportunity to adjust store hours and capture additional morning shoppers.
4. Temporary pop-ups can form an integral part of a visit-focused anchor strategy. The Barbie Dreamhouse Living Truck Tour generates mall visit spikes well above typical Saturday levels. Operators can integrate these events into their overall anchor strategies, offering preferential terms to high-performing pop-ups.
5. New tenants can boost traffic for existing stores in similar categories. After Aldi joined Green Acres Commons in February 2020, visits to an existing BJ’s Wholesale Club trended upwards. This synergy highlights how overlapping audiences can become a strength, creating a larger overall customer base.
The Retail Comeback Kid
Malls, it seems, are cool once again. After languishing in the wake of the pandemic, shopping centers across the country are thriving – reinventing themselves as prime “third places” where people can hang out, shop, and grab a bite to eat.
One key driver behind this resurgence is a shift in how malls view their anchor tenants. While traditional mainstays like Macy’s and JCPenney still play an important role, specialized offerings – from popular eateries to fitness centers and immersive retailtainment destinations – are increasingly taking center stage. These attractions maximize the experiential value that brick-and-mortar venues can deliver, driving visits and sales for the center as a whole.
Against this backdrop, this report leverages the latest location intelligence data to explore the types of tenants that can function as mall anchors in 2025. Should mall operators still focus on general merchandisers to draw crowds, or can dining chains and more niche retailers also do the job? How important is square footage in identifying the anchor-like tenants in a shopping center? And how can a visit-focused approach help mall operators select effective anchor or anchor-like tenants – whether to fill big-box spaces or to leverage the leasing perks traditionally reserved for major large-format chains?
Out-of-the-(Big)-Box Visit Drivers
One of the most important functions of a mall anchor is to ensure steady visitation – providing its smaller tenants with a constant flow of potential customers. And as the role of the mall continues to evolve, analyzing the actual foot traffic impacts of different types of businesses can help identify the kinds of non-traditional anchors best suited to fulfill that purpose.
The Power of a Well-Placed Scheels
Experiential venues, for example, are particularly well-poised to serve as powerful anchors in today’s retail environment – as illustrated by the visit surge experienced by Towne East Square Mall in Wichita, KS following the addition of a Scheels in July 2023.
By blending traditional retail with immersive experiences, Scheels has emerged as a true experiential destination. And this pull has also helped the mall draw more long-distance visitors willing to travel to enjoy Scheels’ offerings. In 2024, 41.9% of the mall’s customers traveled more than 50 miles to visit, compared to 35.8% back in 2018 when Sears occupied the same lot.
Scheels Anchor Brings Substantial Visit Boost to Towne East Square Mall in Wichita, KS, Attracting Visitors From Further Away
Visits to Towne East Square Mall Compared to Q1 2018 Baseline
Share of Visitors From 50+ Miles Away
Share
Embed:
The Barnes & Noble Effect
Traditionally, anchors aimed to please the widest possible audiences – with department stores, big-box chains, and grocery stores leading the way. But visitation data shows that niche concepts can also deliver anchor-level traffic if they’re compelling enough to attract dedicated fans.
The experience of the Barnes & Noble at Coronado Center in Albuquerque, NM is a case in point. After being written off as all but obsolete, Barnes & Noble has staged an impressive comeback in recent years, finding success through a more curated, localized approach to book selling. And despite not being a formal anchor, the Coronado Center Barnes & Noble accounted for 7.9% of visits to the mall in 2024 – outperforming both Macy’s and JCPenney.
Year-over-year data also shows foot traffic surging at the Coronado Center Barnes & Noble, lifting overall visitation to the mall. And demographic data reveals that the bookstore draws a more affluent audience than either the center as a whole or the two department stores – attracting a crowd with more spending power.
This example also illustrates how smaller tenants can sometimes draw larger crowds. Even though Barnes & Noble occupies a smaller onsite space than either Macy’s or JCPenney, it is proving a powerful visit driver out of proportion to its physical size.
Dining Chains Punching Above Their Size
Dining chains are also adept at punching above their square footage – often attracting crowds disproportionate to their size.
Despite its relatively small footprint, for example, the In-N-Out Burger at Glendale Galleria drew an impressive 8.6% of visits to the mall complex in 2024, outpacing some of the mall’s official anchors like DICK’s Sporting Goods, Macy’s, and JCPenney. Still, the onsite Target drew even larger crowds at 14.4% of visits.
A similar pattern emerged at Northridge Fashion Center, where Porto’s Bakery and Cafe captured a notable 15.6% of visits to the complex in 2024 – more than some of the center’s traditional department stores.
These examples underscore the potential for dining chains, which typically require less space, to serve as micro-anchors by consistently attracting outsized crowds – a key consideration for mall operators looking to sustain visitor traffic.
Choosing a Mall Anchor in 2025
Refocusing on tenants’ actual foot traffic contributions also opens the door to a more flexible and dynamic approach to anchor selection and management – one that considers each venue’s unique visitation patterns.
The Weekend/Weekday Divide
Seasonal factors, for example, can make certain anchors more powerful at specific times of the year, while different venues shine on particular days of the week.
At Jordan Creek Town Center in West Des Moines, Iowa, for instance, Scheels and Costco each delivered just under 20.0% of the complex’s overall visits in 2024. But the two retailers’ daily patterns differed significantly: Scheels saw bigger crowds on weekends, while Costco was the primary weekday destination.
Understanding differences like these can help operators optimize their tenant mix to maintain a balanced flow of shoppers throughout the week.
Another example of the impact of differing weekday traffic patterns is offered by the impact of mall-based Chick-fil-A locations on the distribution of mall visits throughout the week.
Despite its relatively small size, Chick-fil-A draws substantial traffic to malls. And after adding Chick-fil-A locations, both Northridge and Miller Hill Malls saw meaningful drops in the share of visits to the centers taking place on Sundays – even as the wider indoor mall segment saw slight upticks.
Recognizing this trend could prompt mall operators to compensate by adding more weekend-friendly traffic drivers – or to lean into this distinction by taking additional steps to bolster the mall’s role as a go-to weekday destination.
The Early-Morning Fitness Advantage
The power of different mall traffic magnets also varies throughout the day. Increasingly, shopping centers are turning to fitness centers as experiential anchors. And since many people work out early in the morning, these gyms are having a significant impact on the distribution of mall visits across dayparts.
The addition of gyms to Northshore Mall in Peabody, MA and Jackson Crossing in Jackson, MI, for instance, led to a significant rise in visits between 7:00 AM and noon. And though the rest of the stores in these malls typically open at 10:00 or 11:00 AM, this shift presents the centers with a significant opportunity.
By adjusting opening hours to accommodate these early-morning patrons, malls can capitalize on this added traffic, driving up visits and sales for relevant tenants – especially health-focused retailers such as juice bars and sporting goods stores.
Adding Temporary Pop-Ups Into the Mix
Adopting a broader, visit-focused view of anchoring also allows mall operators to apply some of the strategies typically reserved for anchors to non-conventional traffic-generating businesses, to ensure a consistent flow of traffic year-round.
Pop-up stores and events, for example, generally don’t follow the same seasonal trends as other retailers – instead, they generate short-term visit boosts during their runs, whenever in the year that may be. And a visit-focused anchor strategy can leverage some of the perks traditionally reserved for anchor tenants – such as preferential leasing terms – to complement traditional full-time anchors during slower retail periods.
The Barbie Dreamhouse Living Truck Tour is a prime example of a traffic-driving pop-up. By bringing exclusive merchandise to malls across the U.S., the truck generates plenty of buzz, drawing crowds eager to snatch up limited-edition items and immerse themselves in all things Barbie. As a result, malls hosting the tour often see significant visit spikes, with foot traffic surging well above typical Saturday levels. Well-timed pop-ups like these can help balance out traffic throughout the year, offsetting traditional slow periods.
Creating a Bigger Visit Pie
A visit-focused approach to anchor management can also help mall operators assess the potential impact of new tenants on existing stores operating in similar categories. For example, mall owners often worry that new tenants operating in similar categories might cannibalize existing businesses. But a visit-focused anchor approach reveals that a well-chosen addition can sometimes benefit current tenants – especially if they cater to similar audiences.
In February 2020, for instance, value supermarket Aldi opened at Green Acres Commons in Valley Stream, NY – a center that already hosted budget-friendly BJ’s Wholesale Club. While BJ’s visits were relatively flat in 2018 and 2019, they began to rise after Aldi’s opening (and following a pandemic-induced dip). Cross-shopping data also shows that Aldi customers were more likely to visit BJ’s than the average Green Acres patron last year.
This synergy may be due in part to the two retailers’ similar visitor bases: In 2024, the Aldi and BJ’s stores in Green Acres Common drew shoppers with comparable economic profiles. This suggests that overlapping audiences can become a strength if aligned brands attract new shoppers, who then explore multiple stores in the same center.
Visits to BJ's Wholesale Club Took Off After Addition of Aldi to Green Acres Commons – Perhaps Buoyed by Audience Similarity
Visits to Green Acres Commons BJ's Wholesale Club, Compared to Q1 2018 Baseline
Median HHI, 2024*
Cross-Shopping, 2024
*Median HHI based on STI: PopStats dataset combined with Placer.ai data for captured trade areas.
Looking ahead, effective mall anchors will be defined less by physical footprint and more by their capacity to maintain consistent, valuable foot traffic. While traditional department stores remain pivotal, smaller or niche brands can often rival – or surpass – large-format retailers. And by thinking out of the anchor box and choosing tenants that cultivate a balanced visitor flow and align with local preferences, operators can position their centers as true go-to destinations.


.svg)


.avif)


