Hybrid work is here to stay, and many office buildings are below capacity, while others are thriving. We take a look at outperforming office buildings in New York, Chicago, San Francisco, and Dallas to find out what is driving foot traffic to these buildings.
Ben Witten
May 2, 2024
5 minutes
The widespread adoption of hybrid work continues to be one of the most significant paradigm shifts since the COVID pandemic. As employees visit offices less frequently, or not at all, corporate users are opting for less but better space which is driving office vacancy rates to record highs.
But even as utilization for many office buildings remains below capacity, some buildings are clearly prospering. So what sets these thriving properties apart from the pack? We looked at outperforming office buildings in four major metro areas – New York, Chicago, San Francisco, and Dallas – to find out.
Buildings where Visits Exceed 2019 Levels
The post-pandemic office recovery has been uneven across the country. As of February 2024, a significantly larger share of workers in the New York-Newark-Jersey City and Dallas-Fort Worth CBSAs were back in the office, while office visits in the Chicago-Naperville-Elgin and San Francisco-Oakland-Berkeley CBSAs remained subdued.
But throughout the country, the reality is much more nuanced as some office buildings struggle to maintain occupancy,others are thriving. We identified four office buildings in four major metropolitan areas where the recovery in utilization was significantly stronger than the respective metro:
What sets these buildings apart from the pack?
Similar Visit Patterns in High-Occupancy Office Buildings
One factor that isn’t driving the office recovery at these high-occupancy office buildings is different weekly visitation patterns.
Location intelligence for offices nationwide indicates that hybrid workers appear to prefer coming to the office mid-week: The bulk of weekly visits occur on Tuesdays, Wednesdays, and Thursdays, with fewer visits taking place on Monday and even less visits on Fridays. And this was also the weekly visitation pattern in the four CBSAs analyzed as well as in the high-occupancy office buildings. In fact, the outperforming office buildings had even more of their visits concentrated mid-week compared to the visit patterns in the wider CBSA.
It seems, then, that the higher visits to these outperforming offices is not due to more employees coming in on typical WFH days. Instead, more workers are likely coming in mid-week to make up for the lull on Mondays and Fridays.
So who are these visitors? And could they hold the key to these buildings' strong recovery numbers?
High-Occupancy Office Buildings Draw Visitors From Areas with Higher Income & Fewer Families
Focusing on the period between March 2023 and February 2024 reveals that in all the labor catchment areas of the analyzed Office Indexes, the share of one-person households was larger than the nationwide share of 27.5%. And during the same period, the share of one-person households in the catchment areas of the high-performing office buildings was even greater – almost 50% of households in the captured market of 2010 Flora St. in Dallas consisted of one-person households.
On the other hand, families with children were underrepresented in the catchment areas of the office indexes relative to the nationwide average of 27.1% – and the share of households with children was even lower in the catchment areas of the high-occupancy office buildings.
This indicates that those with young children at home were generally less likely to go into the office – and so the office buildings seeing the strongest post-COVID recovery are those that serve a large contingent of single employees. On the flip side, there is often a motivation for young singles to visit the office more frequently, whether driven by the desire for training and mentorship or the prospect of meeting a significant other in or around the workplace.
Muchhasbeenwritten on the challenging impact that return-to-office mandates can have on working parents – and especially on working mothers – so it may not come as a surprise that employees from family households are underrepresented in office buildings in 2024.
But the fact that one-person households are even more prevalent in the labor markets of the overperforming buildings (as compared to the wider CBSA Office Index) indicates that businesses and office assets can thrive even without wooing working parents back to the office.
Outperforming Office Buildings See Larger Share of Visits from Managers & Executives
So who are these singles driving the return to the office? Some of this segment may be made up of Gen-Zers seeking the networking and mentorship opportunities provided by an in-person office setting. But it’s not just younger workers leading the return to the office – the data indicates that executives and managers also make up an outsized portion of the outperforming buildings’ catchment areas. In all four CBSAs analyzed, the catchment area of the high-occupancy building included a significantly larger share of people in a managerial or executive role compared to the average catchment area composition of the wider CBSA Office Index.
Many of these executives are likely choosing – rather than being forced – to work on-site. Some might be looking to encourage their staff to return to the office by leading by example, while many are likely leveraging their space to host clients, driving foot traffic to these locations higher. But whatever factors are driving the trend – it appears that office buildings looking to bounce back in the new normal need to make sure they are drawing back the managerial ranks.
Overperforming Offices Serve More Finance & Tech Workers
Analyzing the popular industries and occupations in the catchment areas of the office buildings and industries also reveals that the overperforming buildings serve a much higher share of employees working in finance, insurance, and real estate. A larger share of the catchment area population of the high-occupancy office complexes also works in professional services – including high-tech jobs – compared to the office index in the wider CBSA.
Many financial institutions and tech companies have asked employees to return to the office at least three days a week, which could explain why these industries are overrepresented in the catchment area of the high-occupancy buildings. This data may indicate, then, that while some of the foot traffic is coming from executives choosing to return to their pre-COVID work habits, the return-to-office mandates – whether full or part-time – are likely also helping these buildings stay ahead of the curve.
Return to Office Story Still Being Written
Although the proliferation of office vacancies across the country can make it seem like the return to office battle has already been lost, several buildings are bucking the trend. Location intelligence indicates that a combination of partial return-to-office mandates along with a larger-than-usual share of visitors from executives and non-parental households is helping these office complexes thrive.
Expansions are helping sweetgreen & First Watch receive more visits and expand their reach with new audiences.
Samuel Roche
May 1, 2024
3 minutes
Sweetgreen and First Watch both went public in 2021 and have since steadily increased in popularity – and in store count. So with 2024 well underway, we checked in with the two brands to see how they fared in Q1 and to explore some of the factors underlying their success.
Sweetgreen’s Successful Expansion
Despite the dining challenges of much of 2023 and early 2024, sweetgreen posted impressive visits between April 2023 and March 2024, with the chain’s YoY traffic increases ranging from 21.4% to 51.6%.
The remarkable visit surge was partially driven by the sweetgreen’s significant expansion, which could explain the slight dips in average visits per location for much of 2023 while consumers around sweetgreen’s newer restaurantes familiarized themselves with the brand’s offerings. But since December 2023, YoY visits per location have been positive – with the exception of a weather-induced slump in January – indicating that the chain’s newer venues have established themselves within their community.
This narrowing of the gap between visits and visits per location may also signal the success of sweetgreen’s strategic shift towards prioritizing "quality over quantity” – slowing down expansion and investing in an enhanced customer experience.
Healthy Salads for Everyone
As a salad and grain-bowl chain, sweetgreen holds special appeal for wellness-focused younger consumers, including singles and members of the coveted Gen Z demographic. But as the chain has expanded, it has also succeeded in reaching new audiences.
Sweetgreen has been explicit about its goal of reaching Gen Z consumers. And analyzing the demographic makeup of the chain’s captured market reveals that sweetgreen’s trade area includes a relatively large share of one-person households (that tend to be on the younger side) But analyzing shifts in the chain’s captured market composition over the past five years also reveals that the share of one-person households has been decreasing – while remaining above the nationwide average of 28.0% – and the share of households with children has increased. So even as sweetgreen continues serving its core consumers, the chain’s expansion has also allowed sweetgreen to reach new audiences.
First Watch’s Never-Ending Expansion
First Watch is also in expansion mode, and with plans to open some 50 more restaurants this year the chain shows no signs of slowing down. And, like sweetgreen, First Watch’s expansion has driven significant growth to the chain’s overall visits – and the chain’s average visits per location numbers are up as well, indicating that the new venues are finding a receptive audience.
By staying nimble on its feet and continually changing up its menu offerings, First Watch has succeeded in differentiating itself from other breakfast chain giants – and appears poised to enjoy continued success throughout the year.
Expanding Its Reach
First Watch’s expansion has also helped the company reach new types of diners even as the chain continues catering to its core audience. The share of the Spatial.ai: PersonaLive’s “Upper Suburban Diverse Families” segment in First Watch’s captured market has held steady over the past five years, even as the share of the “Blue Collar Suburbs” and “Urban Low Income” segments increased. It seems, then, that First Watch has also succeeded in leveraging its store fleet expansion to reach new audience segments – without sacrificing its core patrons.
Sweetgreen and First Watch Head into 2024 on an Upswing
Sweetgreen and First Watch’s expansions have helped the companies increase visits and reach new segments – without sacrificing their core audiences. What does the rest of 2024 have in store for the chains?
Q1 2024 visits data for leading chains like Texas Roadhouse, Applebee's, and Fleming Steakhouse shows that full-service restaurants traffic is recovering.
Lila Margalit
Apr 30, 2024
4 minutes
Dining took a hit over the past few years, with major challenges from COVID to rising costs weighing on the category. And perhaps no food-away-from-home segment was more impacted than Full Service Restaurants (FSR) – which stagnated as consumers traded down and sought out more affordable ways to treat themselves.
But new years present new opportunities – and there are signs that sit-down restaurants may be springing back to life. So with 2024 underway, we dove into the data to explore the current state of FSR. Is cooling inflation prompting a rise in Full Service Restaurant activity? How did FSR leaders like Dine Brands (owner of casual dining favorites Applebee’s and IHOP), Bloomin’ Brands (owner of popular grill and steak chains like Outback Steakhouse and Carrabba’s Italian Grill along with high-end Fleming’s Prime Steakhouse & Wine Bar), and Texas Roadhouse fare in Q1?
Restaurants To Dine For: Applebee’s and IHOP
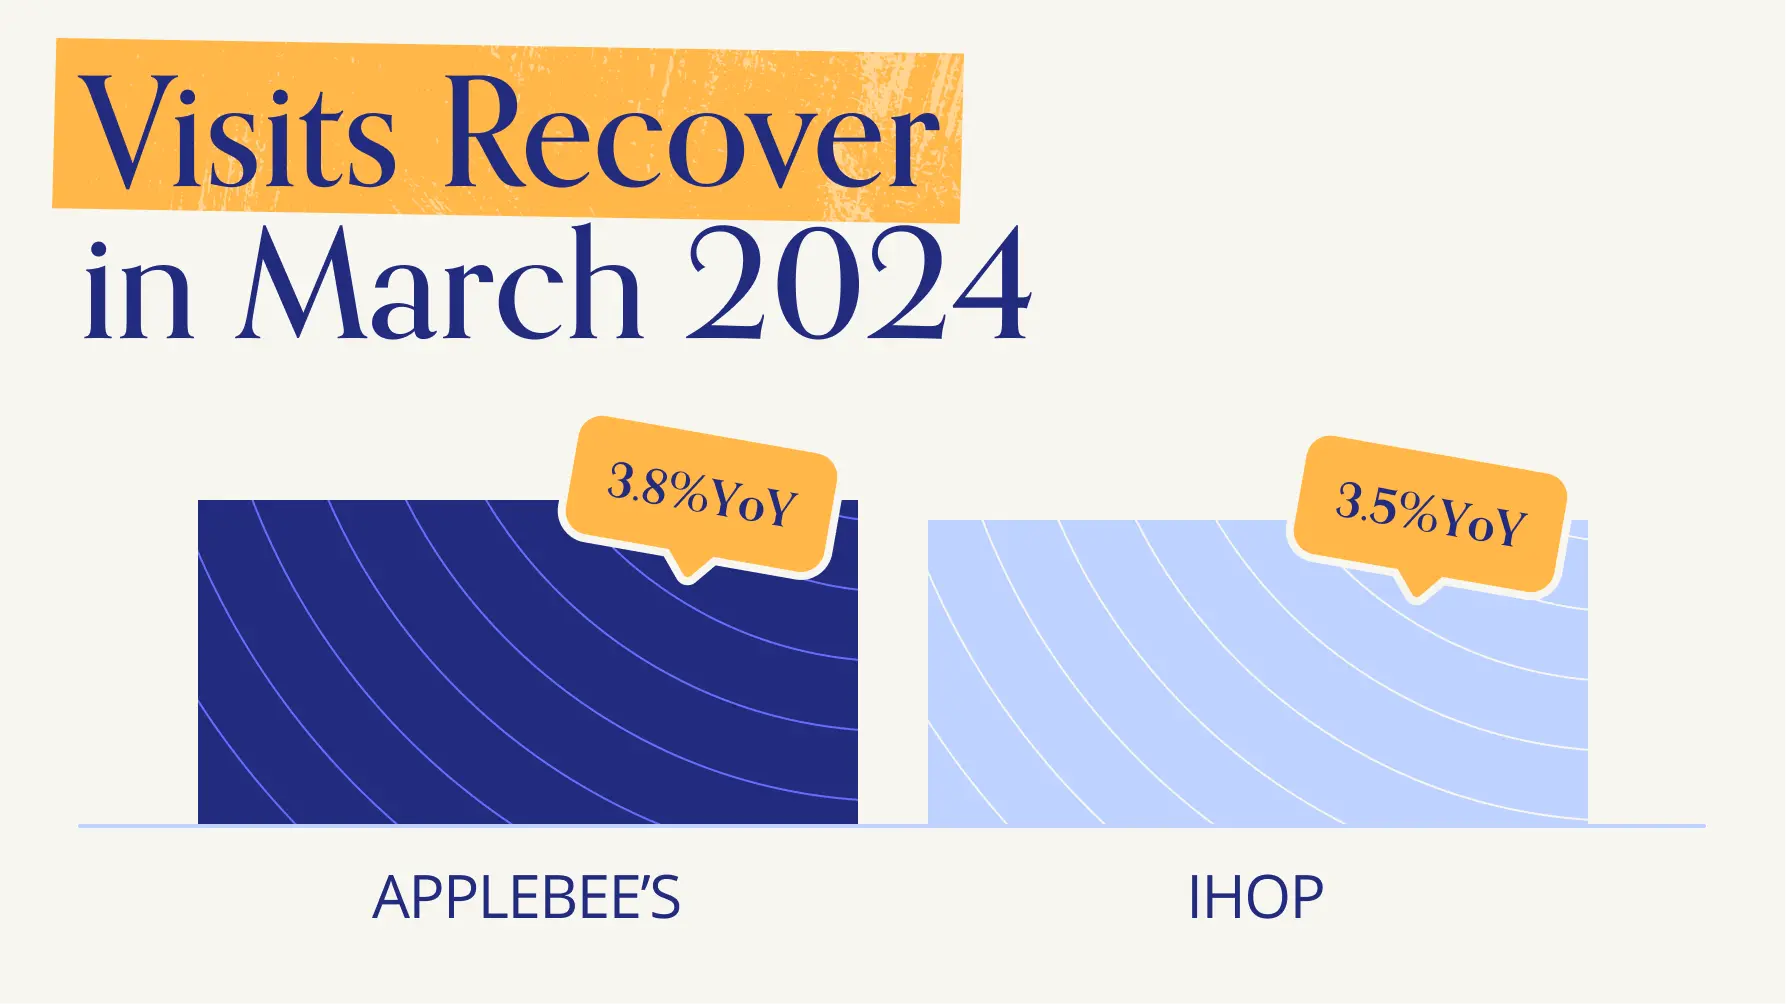
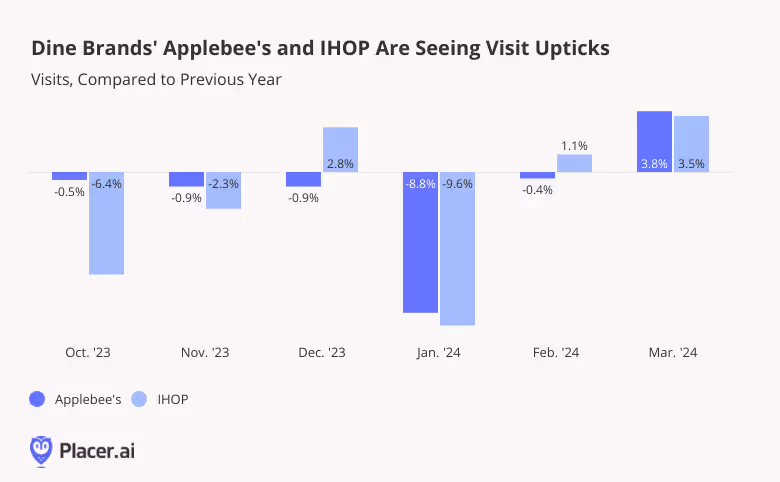
With some 1500 locations nationwide, Applebee’s has long been a mainstay of the American casual dining scene. Like other FSR chains, Applebee’s experienced a setback during the pandemic and has since faced industry-wide headwinds. But even though the brand’s store fleet shrunk by around 30 stores last year, overall YoY visits to Applebee’s declined just slightly between October 2023 and February 2024 (January’s weather-driven slump aside). And in March, the chain saw a promising 3.8% YoY visit uptick.
Breakfast leader IHOP also experienced negative YoY visits in October and November 2023, but in December – when the pancake chain traditionallyenjoys a major holiday boost – visits jumped 2.8% YoY. Like Applebee’s, IHOP felt the effects of January’s Arctic blast, but saw its visits recover quickly in February and March 2024.
Bloomin’s Grill and Steak Chains on a Comeback
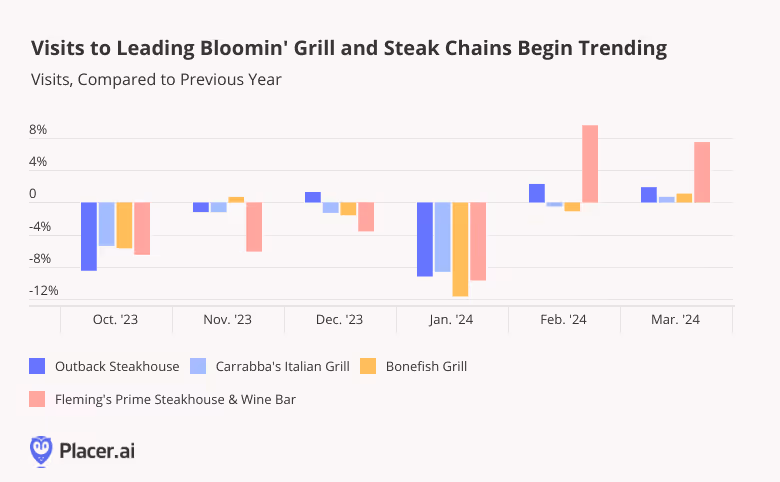
Bloomin’ Brands’ leading casual dining chains Outback Steakhouse, Carrabba’s Italian Grill, and Bonefish Grill appear to be following largely similar trajectories.
Though the brands experienced YoY visit gaps through most of Q3 2023 – and were whalloped by January’s inclement weather – all three chains experienced YoY visit increases in March 2024. Given the fact that the restaurants’ store counts didn’t change significantly last year, this visit growth appears to portend good things for Bloomin’s fast casual portfolio in the year ahead.
But it is Bloomin’ Brands’ fine dining concept, Fleming’s Prime Steakhouse & Wine Bar, that really seems to be hitting it out of the park. While Fleming’s also saw visit gaps between October 2023 and January 2024, the chain experienced 9.6% and 7.5% visit growth, respectively, in February and March 2024 – closing out Q1 with a bang.
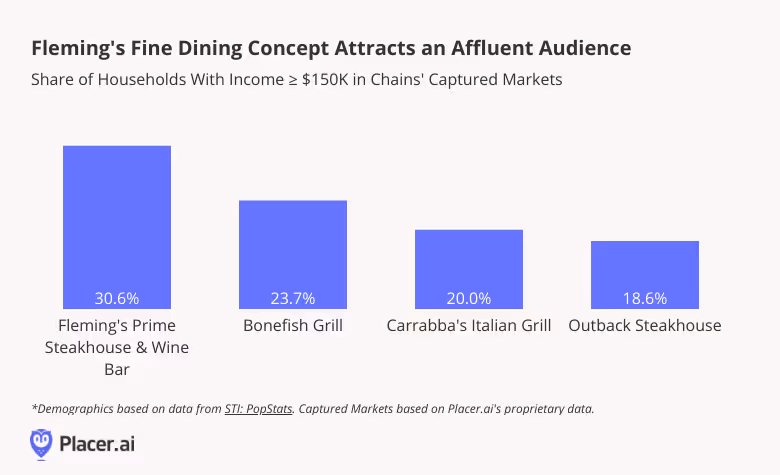
Fleming’s particularly robust recent performance may be due in part to its relatively affluent customer base. Nearly one-third of households in Fleming’s captured market have an annual income of $150K or more – compared to just 18.6% to 23.7% for Bloomin’s casual dining concepts. Though a night out at the fine-dining steakhouse can be expensive, Fleming’s well-heeled visitor base is better positioned to absorb price increases than other consumers.
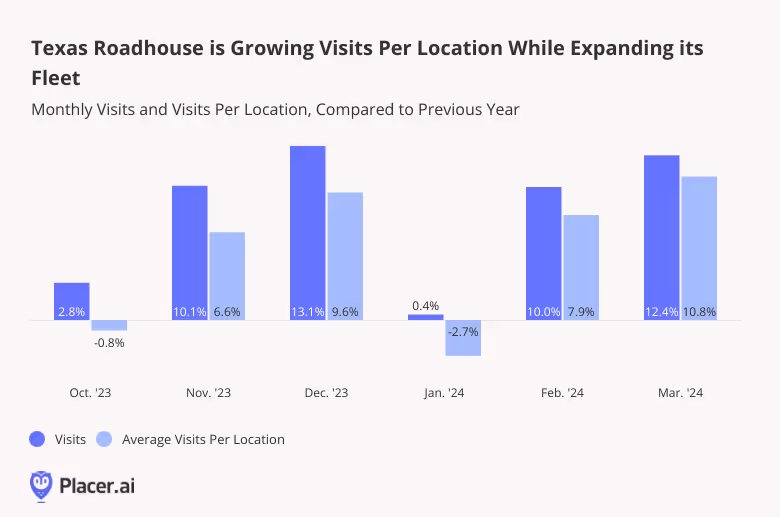
Texas Roadhouse’s Sizzling Success
Appealing to affluent consumers, however, isn’t the only way to go. Texas Roadhouse is firmly in the casual dining space and tends to cater to average-income diners. (In Q1 2024, just 15.2% of its captured market had a household income ≥$150K.) But the steakhouse’s strategy of satisfying steak lovers with high-quality, affordable offerings is working: Throughout Q1, Texas Roadhouse experienced strongly positive YoY visit growth. And while some of this growth is attributable to the brand’s increasing unit count, the average number of visits per location is generally keeping pace – showing that Texas Roadhouse’s expansion continues to meet strong demand.
Poised for Further Growth
Though more affordable Dining segments like QSR and Fast Casual began to spring back to life last year, FSR has yet to fully recover from the double whammy of COVID and inflation. But if March 2024’s promising numbers are any indication, the category may be in for a turnaround. How will FSR continue to perform as 2024 progresses?
Breakfast boosted visits at Denny's and Wendy's in Q1 2024.
Lila Margalit
Apr 29, 2024
3 minutes
Restaurants continue to face headwinds, from still-high food-away-from-home prices to rising labor costs. But despite these challenges, there are promising signs that the industry may be in for an upturn. And increasingly, chains are leaning into breakfast and late night offerings to maximize revenue and foster customer loyalty.
So with Q1 2024 under our belts, we checked in with Wendy’s and Denny’s, two dining leaders with very different offerings in the breakfast space. How did they weather the first quarter of 2024 (pun intended)? And which dayparts experienced the biggest visit boosts in Q1?
Key Takeaways
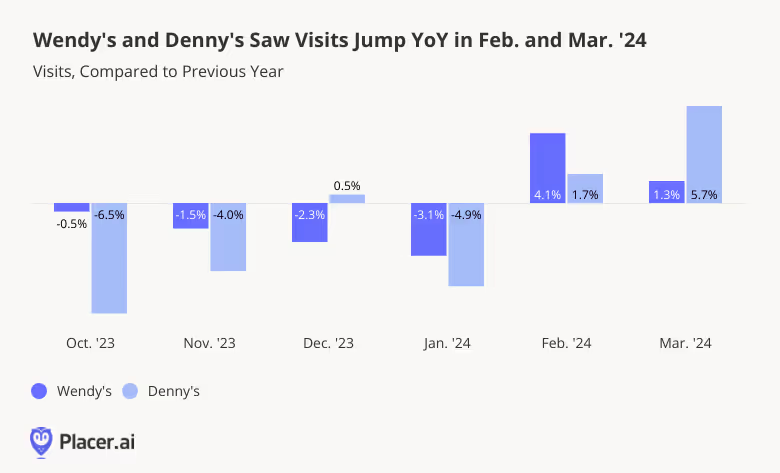
After dipping in January, year-over-year (YoY) visits to Wendy’s and Denny’s picked up in February and March 2024 – driving a YoY increase in quarterly visits for both chains.
For Wendy’s, the breakfast daypart experienced the biggest visit increase, followed by the 8:00 PM to 12:00 AM time slot.
Denny’s, which famously offers breakfast 24 hours a day, saw the biggest YoY visit increases midday and during the late night hours.
A Strong Start to the Year
After a tough Q4 2023 – and a January 2024 dragged down by cold and stormy weather – YoY visits to Wendy’s and Denny’s began to pick up in February and March 2024. And even accounting for January’s Arctic blast, Wendy’s and Denny’s came out ahead on a quarterly basis, with YoY visits up 0.7% and 1.0% respectively.
Wendy’s Ups its Breakfast and Nighttime Game
Wendy’s first launched its breakfast menu in March 2020, just before COVID sent the dining industry into a tailspin. But despite a rocky start, Wendy’s doubled down on the morning daypart, continuallytweaking its breakfast offerings and investing ad dollars to boost breakfast sales.
Drilling down into hourly visit data shows that this strategy is paying off. Visits to Wendy’s during the morning daypart (between 6:00 AM and 11:00 AM) jumped 9.3% in Q1 2024 compared to Q1 2023. The chain’s nighttime daypart – which the burger giant began advertising in 2023 for the first time in four years – also saw a YoY boost. Meanwhile, Wendy’s traditional lunch and dinner time slots held steady, with just minor quarterly visit gaps, indicating that the chain’s overall YoY visit growth in Q1 was driven by its breakfast and nighttime push.
Denny’s Anytime Breakfast Drives Lunch Time and Late Night Visits
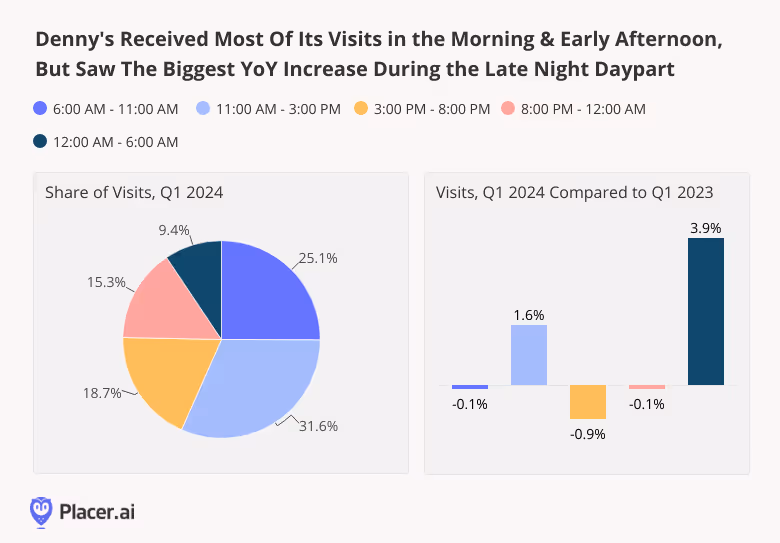
Denny’s has always been all about breakfast. And with some 75.0% of Denny’s locations open 24/7 (even on Christmas), hungry diners frequent the chain day and night to satisfy their cravings for hash browns, eggs, pancakes, and other breakfast favorites.
Unsurprisingly, the chain gets most of its visits in the morning and early afternoon. But in Q1 2024, it was the late night daypart that experienced the biggest YoY visit bump – perhaps driven in part by Denny’s push last year toincrease the number of locations open in the wee hours.
But Denny’s busiest time slot, between 11:00 AM and 3:00 PM, also experienced a YoY visit increase – showing that even as the chain cements its role as a go-to nighttime destination, it continues to face healthy demand during more traditional dining dayparts.
The Most Important Meal(s) of the Day
Breakfast and late night dining offerings have emerged as important drivers of dining success. How will these dayparts continue to fare as the year wears on? And which other brands will make inroads into the breakfast and nighttime dining game?
At a time when retail loyalty appears to be low, warehouse clubs remain the exception. Bulk is big business in the U.S. retail market, and clubs have found a way to deliver on a combination of value, convenience and experience, and sometimes $1.50 hot dogs. The allure of the warehouse club defies some current consumer logic; U.S. households are not growing according to the U.S. Census Bureau. But, clubs also represent much of what is good in retail today: a broad combination of goods and services, inherent value and high quality private labels.
These factors have aided warehouses in growing store traffic compared to their mass merchant counterparts, particularly in the first quarter of 2024. Clubs--including BJ’s Wholesale Club, Sam’s Club and Costco Wholesale--saw visits increase by almost 8% year-over-year, almost double the combined growth of Walmart and Target during the same period. Mass merchants have been squeezed by other value sectors, clubs have been able to hold their own and continue to provide “perceived” value to shoppers, contributing to their traffic volumes.
Beneath the umbrella of growth, each chain has some surprising competitive advantages, and it’s clear that each club serves a distinct purpose to its visitors. In reviewing daily visits, Sam’s Club owns Saturdays, with 22% of visits occurring that day (as shown below), the highest percentage of visits compared to its competition. In contrast, Costco sees a higher percentage of visits on weekdays, specifically Tuesday through Thursday, compared to the other chains.
While Sam’s Club and Costco stand out in terms of their daily visits, BJ’s excels in the time of day that it attracts higher levels of visitors to its locations. BJ’s draws 7% of visits between 8:00-10:00 AM (show below), which is two points higher than Sam’s Club and more than double Costco’s percentage of visits. Not only does BJ’s attract the morning shopper, but also the afterhours customer. BJ’s over indexes in the percentage of visits between 7:00-10:00 PM, with almost 11% of visits occurring during those later hours. BJ’s locations tend to open earlier and stay open later than their Sam’s Club and Costco counterparts, which vary in operational hours for the clubs themselves outside of gas stations. This creates a distinct advantage for BJ’s, especially in areas of direct competition, as visitors looking to shop at off-hours are likely to visit BJ’s.
It’s clear that each club chain has its key day and time to attract visitors that doesn’t overlap too much with its competitors. Warehouse clubs are doing a fantastic job at meeting their consumers where they are and when they prefer to shop. Clubs benefit from increased loyalty due to membership, but it appears that visitors flock to these clubs no matter the day or time. Maybe it’s time to bring breakfast to the Costco & Sam’s Club food courts?
Arrowhead Towne Centre in Glendale, AZ recently opened the newest family fun entertainment center with both a ROUND1 Bowling & Arcade as well as a Spo-Cha. Taking over an erstwhile Mervyn’s, the former includes eight bowling lanes, a variety of favorite games like a claw machine, and two party/karaoke rooms. Upstairs is Spo-Cha, short for Sports Challenge, which is an indoor sports complex where one pays a flat fee for 90 minutes to access activities like riding a mechanical bull, batting cages, a trampoline park, basketball, different sport courts, and billiards.
Spo-Cha is currently in five mall locations in the United States, with plans for more. Overall foot traffic at the malls where it’s currently operational has been positive year-over-year for the month of March.
In addition to the mechanical bull, there is also a Kids Spo-Cha climbing gym and obstacle course.
Dive into the data to find out how the dining category is performing in 2025, which segments are coming out on top, and how dining consumer behavior has shifted in recent years.
June 26, 2025
10 minutes
Key Takeaways:
1. Overall dining traffic is mostly flat, but growth is concentrated in specific areas.
While nationwide dining visits were nearly unchanged in early 2025, western states like Utah, Idaho, and Nevada showed moderate growth, while states in the Midwest and South, along with Washington D.C., saw declines.
2. Fine dining and coffee chains are growing through expansion, not just busier locations.
These two segments were the only ones to see an increase in total visits, but their visits-per-location actually decreased, indicating that opening new stores is the primary driver of their growth.
3. Higher-income diners are driving the growth in resilient categories.
The segments that saw visit growth—fine dining and coffee—also attracted customers with the highest median household incomes, suggesting that affluent consumers are still spending on dining despite economic headwinds.
4. Remote work continues to reshape dining habits.
The share of suburban customers at fine dining establishments has increased since 2019, while it has decreased for coffee chains. This reflects a shift towards "destination" dining closer to home and away from commute-based coffee runs.
5. Limited-service restaurants own the weekdays; full-service restaurants win the weekend.
QSR, fast casual, and coffee chains see the majority of their traffic from Monday to Friday, whereas casual and fine dining see a significant spike in visits on weekends.
6. Each dining segment dominates a specific time of day.
Consumer visits are highly predictable by the hour: coffee leads in the early morning, fast casual peaks at lunch, casual dining takes the afternoon, fine dining owns the dinner slot, and QSR captures the late-night crowd.
Year-over-Year Dining Traffic Trends
Dining Visits Mostly Up in the West, Down in Most of Midwest and East
Overall dining visits held relatively steady in the first five months of 2025, with year-over-year (YoY) visits to the category down 0.5% for January to May 2025 compared to the same period in 2024. Most of the country saw slight declines (less than 2.0%), though some states and districts experienced larger drops: Washington, D.C, saw the largest visit gap (-3.6% YoY), followed by Kansas and North Dakota (-2.9%), Arkansas (-2.8%), Missouri and Kentucky (-2.6%), Oklahoma (-2.1%), and Louisiana (-2.0%).
Still, there were several pockets of moderate dining strength, specifically in the west of the United States. January to May 2025 dining visits in Utah, Idaho, and Nevada increased 1.8% to 2.4% YoY, while the coastal states saw traffic rise 0.6% (California) to 1.2% (Washington). Vermont also saw a slight increase in dining visits (+1.9%).
Coffee & Fine Dining See Strongest Overall Visit Growth
Diving into visit trends by dining segment shows that fine dining and coffee saw the strongest overall visit trends, with visits to the segments up 1.3% and 2.6% YoY, respectively, between January and May 2025. But visits per location trends were negative for both segments – a decline of 0.8% YoY for fine dining and 1.8% for coffee during the period – suggesting that much of the visit strength is due to expansions rather than more crowded restaurants and coffee shops.
In contrast, full-service casual dining saw overall visits decrease by 1.5%, while visits per location remained stable (+0.2%) YoY between January and May 2025. Several casual dining chains have rightsized in the past twelve months – including Red Lobster, TGI Fridays, and Outback Steakhouse – which impacted overall visit numbers. But the data seems to show that their rightsizing was effective, as the remaining locations successfully absorbed the traffic and maintained performance levels from the previous year. And the monthly data also provides much reason for optimism, with May traffic up both overall and on a visit per location basis – suggesting that the casual dining segment is well positioned for growth in the second half of 2025.
Meanwhile, QSR and fast casual chains saw similar minor visits per venue dips (-1.5% and -1.2%, respectively). At the same time, QSR also saw an overall visit dip (-0.8%) while traffic to fast casual chains increased slightly (+0.3%) – suggesting that the fast casual segment is expanding more aggressively than QSR. But the two segments decoupled somewhat in May, with overall traffic and visits per venue to fast casual chains up YoY while traffic remained flat and visits per venue fell slightly for QSR – perhaps due to the relatively greater affluence of fast casual's consumer base.
Dining Demographics
Visitor Income Levels Hold Steady in Most Segments
Analyzing the income levels of visitors to the various dining segments over time shows that each segment followed a slightly different trend – and the differences in visitor income may help explain some of the current traffic patterns.
The only three segments with YoY visit growth – casual dining, fine dining, and coffee – also had the highest captured market median household income (HHI). Although the median HHI in the captured market of upscale and fine dining chains fell after COVID, it has risen back steadily over time and now stands at $98.0K – slightly higher than the $97.1K median HHI between January to May 2019. This may explain the segment's resilience in the face of wider consumer headwinds. Meanwhile, the median HHI at fast casual and coffee chains has fallen slightly, perhaps due to aggressive expansions in the space – including Dave's Hot Chicken and Dutch Bros – which likely broadened the reach of the segments, driving visits up and trade area median HHI down.
Like fine dining, casual dining also saw its trade area median HHI increase slightly over time – but the segment has still been facing visit dips. This could mean that, even though consumers trading down to casual dining may have boosted the trade area median HHI for the segment, it still might not have been enough to make up for the customers lost to tighter budgets.
The QSR segment saw its trade area median HHI remain remarkably steady – and visits to the segment have also been quite consistent – staying between $70.6K and $70.9K between 2019 and 2025 – which may explain why the segment's visits remained relatively stable YoY.
Suburban Dining Patterns
Diving into the psychographic segmentation shows that, although the fine dining segment attracted visitors from the highest-income areas between January and May 2025, fast casual chains drew the highest share of visitors from suburban areas, followed by casual dining and coffee. QSR attracted the smallest share of suburban visitors, with just 30.5% of the category's captured market between January and May 2025 belonging to Spatial.ai: PersonaLive suburban segments.
But looking at the data since 2019 reveals small but significant changes in the shares of suburban audiences in some categories' captured markets. And although the percentage changes are slight, these represent hundreds of thousands of diners every year.
The data shows that shares of suburban segments in the captured markets of fine dining chains have increased, while their share in the captured market of coffee chains has decreased. The shares of suburban visitors to QSR, fast casual, and casual chains have remained relatively steady.
This may suggest that the COVID-19 pandemic and the subsequent rise of remote and hybrid work models are still impacting consumer dining habits, benefiting destination-worthy experiences in suburban locales such as fine dining chains while reducing the necessity of daily coffee runs that were often tied to commuting and office work. Meanwhile, the stability in QSR, fast casual, and casual dining segments could indicate that these categories continue to meet consistent suburban demand for convenience and everyday dining, largely unaffected by the redistribution seen in the fine dining and coffee sectors.
Dining Consumer Behavior Trends
Although QSR, fast casual, casual dining, fine dining, and coffee all fall under the wider dining umbrella, the data shows distinct consumer behavior patterns regarding visits to these five categories.
Limited Service Leads Weekday Visit Share, Full Service Rules the Weekend
Limited service segments, including QSR, fast casual, and coffee tend to see higher shares of visits on weekdays, while full service segments – casual dining and fine dining – receive higher shares of weekend visits. Diving deeper shows that QSR has the largest share of weekday visits, with 72.3% of traffic coming in between Monday and Friday, followed by fast casual (69.8% of visits on weekdays) and coffee (69.4% of visits on weekdays.) Looking at trends within the work week shows that QSR receives a slightly larger visit share between Monday and Thursday compared to the other limited service segments. Meanwhile, coffee seems to receive the smallest share of Friday visits – 16.3% compared to 17.0% for fast casual and 17.2% for QSR.
On the full-service side, casual dining and fine dining chains have relatively similar shares of weekend visits (39.0% and 38.8%, respectively), but fine dining also sees an uptick of visits on Fridays (with 19.1% of weekly visits) as consumers choose to start the weekend on a festive note.
Each Segment Owns a Different Daypart
Hourly visit patterns also show variability between the segments. Coffee is the unsurprising leader of early visits, with 14.6% of visits taking place before 8 AM and, almost two-thirds (64.9%) of visits taking place before 2 PM. Fast casual leads the lunch rush (29.4% of visits between 11 AM and 2 PM), casual dining chains receive the largest share of afternoon (2 PM to 5 PM) visits, and fine dining chains receive the largest share of dinner visits, with almost 70% of visits taking place between 5 PM and 11 PM. QSR leads the late night visit share – 4.1% of visits take place between 11 PM and 5 AM – followed by casual dining chains (3.2% late night and overnight visit share), likely due to the popularity of 24-hour diners.
This suggests that each dining segment effectively "owns" a different part of the day, from the morning coffee ritual and the quick lunch break to the leisurely evening meal and late-night cravings.
Shorter Visits in Most Segments
An analysis of average visit duration also reveals a small but lasting shift in post-pandemic dining behavior. Between January and May 2025, the average dwell time for nearly every dining segment was shorter than during the same period in 2019. This efficiency trend is evident across limited-service categories like QSR, fast casual, and coffee shops, suggesting a continued emphasis on speed and convenience.
The one notable exception to this trend is upscale and fine dining, where the average visit duration has actually increased compared to pre-COVID levels. This may suggest that, while visits to most segments have become more transactional, consumers are treating fine dining more as an extended, deliberate experience, reinforcing its position as a destination-worthy occasion.
Dive into the data to see how consumer response to major promotional events – from Black Friday and the back-to-school shopping rush to brand-crafted LTOs – varies by market.
June 19, 2025
Key Takeaways
1. The Midwest is the only region where Black Friday retail visits outpace Super Saturday.
But several major Midwestern markets, including Chicago and Detroit, actually see higher shopper turnout on Super Saturday.
2. Holiday season demographic shifts also vary across regions.
Nationwide, electronics stores see a slight uptick in median household income (HHI) in December – yet in certain markets, electronics retailers such as Best Buy see a drop in captured market median HHI during this period.
3. Back-to-school shopping starts earliest for clothing and office supplies retailers in the South Central region, likely tied to earlier school schedules.
But back-to-school visits surge higher for these retailers in the Northeast later in the season.
4. The share of college students among back-to-school shoppers varies by region.
In August 2024, “Collegians” made up the largest share of Target’s back-to-school shopping crowd in New England, and the smallest in the West.
5. Mother’s Day drives the biggest restaurant visit spikes in the Middle Atlantic Region, while Father’s Day sees its biggest boosts in the South Atlanticstates.
Mother’s Day diners also tend to travel farther to celebrate, suggesting an extra effort to treat mom.
6. Western states proved particularly responsive to McDonald’s recent Minecraft promotion.
During the week of A Minecraft Movie’s release, the promotion drove significantly higher visit spikes in the West than in the Eastern U.S.
Zooming in on Local Trends
Retailers rely on promotional events to fuel sales – from classics like Black Friday and back-to-school sales to unique limited-time offers (LTOs) and pop-culture collaborations. Yet consumer preferences and behavior can vary significantly by region, making it critical to tailor campaigns to local markets.
This report dives into the data to reveal how consumers in 2025 are responding to major retail promotions, exploring both broad regional trends and more localized market-level nuances. Where is Black Friday most popular, and which areas see a bigger turnout on Super Saturday? Where are restaurants most packed on Mother’s Day, and where on Father’s Day? Which region kicks off back-to-school shopping – and where are August shoppers most likely to be college students? And also – which part of the country went all out on McDonald’s recent Minecraft LTO?
Read on to find out.
The Holiday Season: A Regional Story
Promotions aimed at boosting foot traffic on key holiday season milestones like Black Friday and Super Saturday are central to retailers’ strategies across industries. The day after Thanksgiving and the Saturday before Christmas typically rank among in-store retail’s busiest days, last year generating foot traffic surges of 50.1% and 56.3%, respectively, compared to a 12-month daily average. And
But a closer look at regional data shows that these promotions land differently across the country. In the Midwest, Black Friday outperformed Super Saturday last year, fueling the nation’s biggest post-Thanksgiving retail visit spike – a testament to the milestone’s strong local appeal. Meanwhile, in the Western U.S. Black Friday trailed well behind Super Saturday, though both milestones drove smaller upticks than in other regions. And in New England and the South Central states, Super Saturday achieved its biggest impact, suggesting that last-minute holiday specials may resonate especially well in that area.
Plenty of Local Variety
Digging deeper into major Midwestern hubs shows that even within a single region, holiday promotions can produce widely different responses.
In St. Louis, Indianapolis, and Minneapolis, for example, consumers followed the broader Midwestern pattern, flocking to stores on Black Friday exhibiting less enthusiasm for Super Saturday deals. By contrast, Chicago and Detroit saw Super Saturday edge ahead, with Chicago’s Black Friday peak falling below the nationwide average of 50.1%. examples highlight the power of local preferences to shape holiday campaign results.
Differing Demographic Shifts Across Regions
Holiday promotions don’t just drive visit spikes; they also spark subtle but significant changes in the demographic profiles of brick-and-mortar shoppers, expanding many retailers’ audiences during peak periods. And these shifts, too, can vary widely across regions.
Outlet malls, department stores, and beauty & self-care chains, for instance, which typically attract higher-income consumers, tend to see slight declines in the median household incomes (HHI) of their visitor bases in December. This dip may be due to promotions drawing in more mid- and lower-income shoppers during the peak holiday season. Electronics stores and superstores, on the other hand, which generally serve a less affluent base, see modest upticks in median HHI in the lead-up to Christmas.
But once again, drilling further down into regional chain-level data reveals more nuanced regional patterns. Take Best Buy, a leading holiday season electronics destination. In some of the chain’s biggest, more affluent markets – including New York, Los Angeles, and Chicago – the big-box retailer sees small dips in median HHI during December. But in Atlanta and Houston – also relatively affluent, but slightly less so – December saw a minor HHI uptick, hinting at a stronger holiday rush from higher-income shoppers in those cities.
Back-to-School Bonanzas
Back-to-school promotions also play a pivotal role in the retail calendar, with superstores, apparel chains, office supply stores and others all vying for shopper attention. And though summer markdowns drive increased foot traffic nationwide, both the timing of these shifts and the composition of the back-to-school shopping crowd differ among regions.
A Southern Head Start
Analyzing weekly fluctuations in regional foot traffic to clothing and office supplies stores shows, for example, that back-to-school shopping picks up earliest in the South Central region, likely due to earlier school start dates.
But the biggest visit peaks occur in the Northeast – with clothing retailer foot traffic surging in New England in late August, and office supplies stores seeing an even bigger surge in the Middle Atlantic region in early September. Retailers and advertisers can plan their back-to-school deals around these differences, targeting promotions to local trends.
A New England Collegian Affair
Though K-12 families drive much of the back-to-school rush, college student shoppers also play a substantial role. And here, too, their participation varies by region.
For instance, the “Collegians” segment accounted for 2.2% of Target’s shopper base nationwide over the past year – rising to 3.0% in August 2024. But regionally, the share of “Collegians” soared as high as 4.0% in New England versus just 2.2% in the West. So while retailers in New England may choose to lean into the college vibe, those in Western states may place greater emphasis on families with children.
Mother’s Day and Father’s Day: Differing Dining Peaks
When it comes to dining, Mother’s Day and Father’s Day are the busiest days of the year for the full-service restaurant (FSR) category, as families treat their parents to a hassle-free meal out. And eateries nationwide capitalize on this trend by offering a variety of deals and promotions that add a little extra charm (and value) to the experience.
Atlantic Specials
Nationwide, Mother’s Day drives more FSR foot traffic than Father’s Day – except in parts of the Pacific Northwest, where Father’s Day traditions run especially deep. Still, the size of these holiday boosts varies substantially by region.
This year, for instance, Mother’s Day (May 11, 2025) drove the largest FSR surge in the Middle Atlantic, with the South Atlantic and Midwest not far behind. Father’s Day, by contrast, saw its biggest lift in the South Atlantic. Mother’s Day proved least resonant in the West, whereas Father’s Day had its smallest impact in New England.
Going the Extra Mile for Mom
Dining behavior also differs between the two occasions. Mother’s Day celebrants display a slight preference for morning FSR visits and a bigger one for afternoon visits, while Father’s Day crowds favor evenings – perhaps reflecting a preference for sports bars and later dinners with dad. Another interesting nuance: On Mother’s Day, a larger share of FSR visits originate from between 3 and 50 miles away compared to Father’s Day, suggesting that families go the extra mile – sometimes literally – to celebrate mom.
Self-Styled Celebrations: Driving Traffic with DIY Milestones
While established dates like Black Friday or Mother’s Day naturally spur promotions, brands can also craft their own moments with limited-time offers (LTOs). And much like holiday campaigns, these retailer-led events can produce varied outcomes across different regions.
Fast food restaurants, for example, have leaned heavily on limited-time offers (LTOs) and pop-culture tie-ins to fuel buzz in what remains a challenging overall market. And McDonald’s recent Minecraft promotion, launched on April 1, 2025 to coincide with the April 3 release of A Minecraft Move, shows just how impactful the practice can be.
Nationally, the Minecraft promotion (featuring offerings for both kids and adults) drove a 6.9% lift in visits during the movie’s opening week. But the impact of the promotion was far from uniform across the U.S. Many of McDonald’s Western markets – including Utah, Idaho, Nevada, California, Texas, Arizona, Colorado, and Oregon – recorded visit lifts above 10.0%. Meanwhile, Kentucky saw a 2.1% dip, and several other Eastern states registered modest gains below 3.0%. The McDonald’s example illustrates the power of regional tastes to shape the success of even the most creative pop-culture collabs.
Adopting a Regional Lens
Whether it’s properly timing holiday and back-to-school discounts, recognizing where Mother’s Day or Father’s Day will resonate more, or pinpointing markets that respond best to pop-culture tie-ins, the data reveals that effective promotions depend heavily on local nuances. And by analyzing regional and DMA-level trends, retailers and advertisers can craft compelling, relevant campaigns that heighten engagement where it matters most.
Discover how mall anchors are transforming in 2025 – and how a foot-traffic-focused approach to choosing key tenants can drive visits and shopper engagement.
May 29, 2025
8 minutes
Key Takeaways
1. Experiential and niche retailers can deliver anchor-level traffic. At Towne East Square Mall, the addition of a Scheels in 2023 significantly increased foot traffic and long-distance travelers, while Barnes & Noble at Coronado Center in Albuquerque has become a key driver of both foot traffic and higher-spend demographics.
2. Size isn’t everything – especially for dining venues. At Glendale Galleria and Northridge Fashion Center, smaller restaurants attracted more foot traffic than some traditional anchors.
3. Refocusing on tenants’ actual traffic contributions enables a flexible anchor approach. Balancing weekend draws like Scheels with weekday favorites such as Costco or Chick-fil-A can help maintain steady visitor flow throughout the week. Similarly, onsite fitness clubs can shift traffic to earlier in the day – an opportunity to adjust store hours and capture additional morning shoppers.
4. Temporary pop-ups can form an integral part of a visit-focused anchor strategy. The Barbie Dreamhouse Living Truck Tour generates mall visit spikes well above typical Saturday levels. Operators can integrate these events into their overall anchor strategies, offering preferential terms to high-performing pop-ups.
5. New tenants can boost traffic for existing stores in similar categories. After Aldi joined Green Acres Commons in February 2020, visits to an existing BJ’s Wholesale Club trended upwards. This synergy highlights how overlapping audiences can become a strength, creating a larger overall customer base.
The Retail Comeback Kid
Malls, it seems, are cool once again. After languishing in the wake of the pandemic, shopping centers across the country are thriving – reinventing themselves as prime “third places” where people can hang out, shop, and grab a bite to eat.
One key driver behind this resurgence is a shift in how malls view their anchor tenants. While traditional mainstays like Macy’s and JCPenney still play an important role, specialized offerings – from popular eateries to fitness centers and immersive retailtainment destinations – are increasingly taking center stage. These attractions maximize the experiential value that brick-and-mortar venues can deliver, driving visits and sales for the center as a whole.
Against this backdrop, this report leverages the latest location intelligence data to explore the types of tenants that can function as mall anchors in 2025. Should mall operators still focus on general merchandisers to draw crowds, or can dining chains and more niche retailers also do the job? How important is square footage in identifying the anchor-like tenants in a shopping center? And how can a visit-focused approach help mall operators select effective anchor or anchor-like tenants – whether to fill big-box spaces or to leverage the leasing perks traditionally reserved for major large-format chains?
Out-of-the-(Big)-Box Visit Drivers
One of the most important functions of a mall anchor is to ensure steady visitation – providing its smaller tenants with a constant flow of potential customers. And as the role of the mall continues to evolve, analyzing the actual foot traffic impacts of different types of businesses can help identify the kinds of non-traditional anchors best suited to fulfill that purpose.
The Power of a Well-Placed Scheels
Experiential venues, for example, are particularly well-poised to serve as powerful anchors in today’s retail environment – as illustrated by the visit surge experienced by Towne East Square Mall in Wichita, KS following the addition of a Scheels in July 2023.
By blending traditional retail with immersive experiences, Scheels has emerged as a true experiential destination. And this pull has also helped the mall draw more long-distance visitors willing to travel to enjoy Scheels’ offerings. In 2024, 41.9% of the mall’s customers traveled more than 50 miles to visit, compared to 35.8% back in 2018 when Sears occupied the same lot.
Scheels Anchor Brings Substantial Visit Boost to Towne East Square Mall in Wichita, KS, Attracting Visitors From Further Away
Visits to Towne East Square Mall Compared to Q1 2018 Baseline
Share of Visitors From 50+ Miles Away
Share
Embed:
The Barnes & Noble Effect
Traditionally, anchors aimed to please the widest possible audiences – with department stores, big-box chains, and grocery stores leading the way. But visitation data shows that niche concepts can also deliver anchor-level traffic if they’re compelling enough to attract dedicated fans.
The experience of the Barnes & Noble at Coronado Center in Albuquerque, NM is a case in point. After being written off as all but obsolete, Barnes & Noble has staged an impressive comeback in recent years, finding success through a more curated, localized approach to book selling. And despite not being a formal anchor, the Coronado Center Barnes & Noble accounted for 7.9% of visits to the mall in 2024 – outperforming both Macy’s and JCPenney.
Year-over-year data also shows foot traffic surging at the Coronado Center Barnes & Noble, lifting overall visitation to the mall. And demographic data reveals that the bookstore draws a more affluent audience than either the center as a whole or the two department stores – attracting a crowd with more spending power.
This example also illustrates how smaller tenants can sometimes draw larger crowds. Even though Barnes & Noble occupies a smaller onsite space than either Macy’s or JCPenney, it is proving a powerful visit driver out of proportion to its physical size.
Dining Chains Punching Above Their Size
Dining chains are also adept at punching above their square footage – often attracting crowds disproportionate to their size.
Despite its relatively small footprint, for example, the In-N-Out Burger at Glendale Galleria drew an impressive 8.6% of visits to the mall complex in 2024, outpacing some of the mall’s official anchors like DICK’s Sporting Goods, Macy’s, and JCPenney. Still, the onsite Target drew even larger crowds at 14.4% of visits.
A similar pattern emerged at Northridge Fashion Center, where Porto’s Bakery and Cafe captured a notable 15.6% of visits to the complex in 2024 – more than some of the center’s traditional department stores.
These examples underscore the potential for dining chains, which typically require less space, to serve as micro-anchors by consistently attracting outsized crowds – a key consideration for mall operators looking to sustain visitor traffic.
Choosing a Mall Anchor in 2025
Refocusing on tenants’ actual foot traffic contributions also opens the door to a more flexible and dynamic approach to anchor selection and management – one that considers each venue’s unique visitation patterns.
The Weekend/Weekday Divide
Seasonal factors, for example, can make certain anchors more powerful at specific times of the year, while different venues shine on particular days of the week.
At Jordan Creek Town Center in West Des Moines, Iowa, for instance, Scheels and Costco each delivered just under 20.0% of the complex’s overall visits in 2024. But the two retailers’ daily patterns differed significantly: Scheels saw bigger crowds on weekends, while Costco was the primary weekday destination.
Understanding differences like these can help operators optimize their tenant mix to maintain a balanced flow of shoppers throughout the week.
Another example of the impact of differing weekday traffic patterns is offered by the impact of mall-based Chick-fil-A locations on the distribution of mall visits throughout the week.
Despite its relatively small size, Chick-fil-A draws substantial traffic to malls. And after adding Chick-fil-A locations, both Northridge and Miller Hill Malls saw meaningful drops in the share of visits to the centers taking place on Sundays – even as the wider indoor mall segment saw slight upticks.
Recognizing this trend could prompt mall operators to compensate by adding more weekend-friendly traffic drivers – or to lean into this distinction by taking additional steps to bolster the mall’s role as a go-to weekday destination.
The Early-Morning Fitness Advantage
The power of different mall traffic magnets also varies throughout the day. Increasingly, shopping centers are turning to fitness centers as experiential anchors. And since many people work out early in the morning, these gyms are having a significant impact on the distribution of mall visits across dayparts.
The addition of gyms to Northshore Mall in Peabody, MA and Jackson Crossing in Jackson, MI, for instance, led to a significant rise in visits between 7:00 AM and noon. And though the rest of the stores in these malls typically open at 10:00 or 11:00 AM, this shift presents the centers with a significant opportunity.
By adjusting opening hours to accommodate these early-morning patrons, malls can capitalize on this added traffic, driving up visits and sales for relevant tenants – especially health-focused retailers such as juice bars and sporting goods stores.
Adding Temporary Pop-Ups Into the Mix
Adopting a broader, visit-focused view of anchoring also allows mall operators to apply some of the strategies typically reserved for anchors to non-conventional traffic-generating businesses, to ensure a consistent flow of traffic year-round.
Pop-up stores and events, for example, generally don’t follow the same seasonal trends as other retailers – instead, they generate short-term visit boosts during their runs, whenever in the year that may be. And a visit-focused anchor strategy can leverage some of the perks traditionally reserved for anchor tenants – such as preferential leasing terms – to complement traditional full-time anchors during slower retail periods.
The Barbie Dreamhouse Living Truck Tour is a prime example of a traffic-driving pop-up. By bringing exclusive merchandise to malls across the U.S., the truck generates plenty of buzz, drawing crowds eager to snatch up limited-edition items and immerse themselves in all things Barbie. As a result, malls hosting the tour often see significant visit spikes, with foot traffic surging well above typical Saturday levels. Well-timed pop-ups like these can help balance out traffic throughout the year, offsetting traditional slow periods.
Creating a Bigger Visit Pie
A visit-focused approach to anchor management can also help mall operators assess the potential impact of new tenants on existing stores operating in similar categories. For example, mall owners often worry that new tenants operating in similar categories might cannibalize existing businesses. But a visit-focused anchor approach reveals that a well-chosen addition can sometimes benefit current tenants – especially if they cater to similar audiences.
In February 2020, for instance, value supermarket Aldi opened at Green Acres Commons in Valley Stream, NY – a center that already hosted budget-friendly BJ’s Wholesale Club. While BJ’s visits were relatively flat in 2018 and 2019, they began to rise after Aldi’s opening (and following a pandemic-induced dip). Cross-shopping data also shows that Aldi customers were more likely to visit BJ’s than the average Green Acres patron last year.
This synergy may be due in part to the two retailers’ similar visitor bases: In 2024, the Aldi and BJ’s stores in Green Acres Common drew shoppers with comparable economic profiles. This suggests that overlapping audiences can become a strength if aligned brands attract new shoppers, who then explore multiple stores in the same center.
Visits to BJ's Wholesale Club Took Off After Addition of Aldi to Green Acres Commons – Perhaps Buoyed by Audience Similarity
Visits to Green Acres Commons BJ's Wholesale Club, Compared to Q1 2018 Baseline
Median HHI, 2024*
Cross-Shopping, 2024
*Median HHI based on STI: PopStats dataset combined with Placer.ai data for captured trade areas.
Looking ahead, effective mall anchors will be defined less by physical footprint and more by their capacity to maintain consistent, valuable foot traffic. While traditional department stores remain pivotal, smaller or niche brands can often rival – or surpass – large-format retailers. And by thinking out of the anchor box and choosing tenants that cultivate a balanced visitor flow and align with local preferences, operators can position their centers as true go-to destinations.


.svg)


.avif)


.avif)


