Off-price apparel chains continue to drive traffic in 2024. We dove into the latest location analytics for four of the largest brands – T.J. Maxx, Marshalls, Ross Dress for Less, and Burlington – to take a closer look at these retailers’ foot traffic growth and evolving visitor bases.
Ezra Carmel
May 15, 2024
3 minutes
Off-price apparel chains continue to drive traffic in 2024. We dove into the latest location analytics for four of the largest brands – T.J. Maxx, Marshalls, Ross Dress for Less, and Burlington – to take a closer look at these retailers’ foot traffic growth and evolving visitor bases.
Nothing Off With Off-Price: YoY Growth Continues
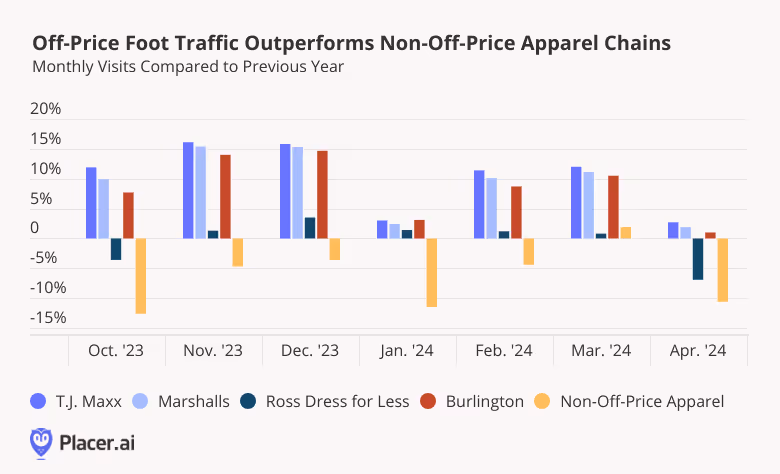
The off-price sector started off 2024 strong, with the four off-price leaders – T.J. Maxx, Marshalls (both owned by TJX Companies), Ross Dress for Less, and Burlington – consistently outperforming the wider non-off-price apparel segment. YoY visits to the four brands were also mostly positive for the period analyzed, in part thanks to the companies’ ongoingexpansions.
Chains Take Their Pick of Singles and Family Visitors
Diving into the demographic composition of the four chains’ trade areas reveals that there are many formulas for success in the off-price space. And while some companies have found success by attracting families looking to stretch their budgets, others are growing their visits by drawing singles looking to stock up on the latest styles without breaking the bank.
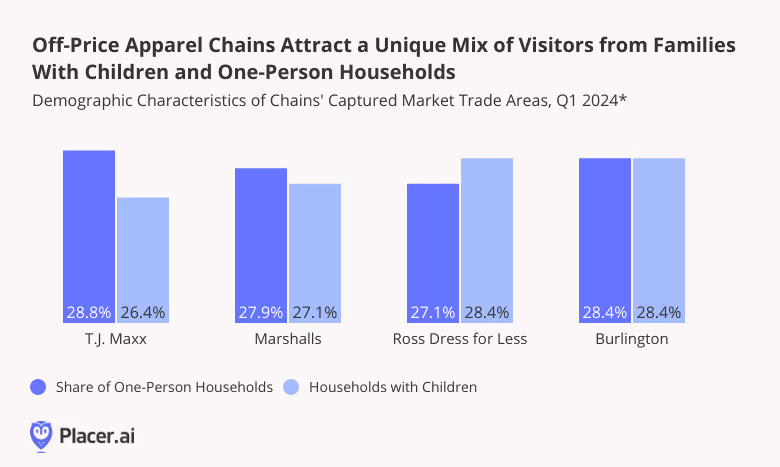
T.J. Maxx and Marshalls – where YoY Q1 2024 visits grew 8.9% and 7.9%, respectively – both have relatively large shares of one-person households in their trade areas. Members of these one-person households are typically younger – often belonging to the coveted Gen-Z demographic – and TJX C.E.O. Ernie Herrman has emphasized the company’s success among this audience segment as an important growth driver.
Meanwhile, the 1.1% YoY increase in overall visits for Ross Dress for Less in Q1 2024 seems driven by the chain’s popularity among families – 28.4% of the chain’s captured market consists of households with children. And Burlington achieved its Q1 7.6% YoY visit growth by appealing to both demographics.
It seems, then, that each off-price leader has found a different formula for success by catering to a unique demographic mix.
Sign Off(-Price)
Over the last several months, off-price apparel chains have outperformed traditional apparel retailers in YoY visits as they expand their real estate footprints. Taking on new territory, off-price retailers drive visits from a unique mix of households with children and singles.
For more data-driven retail insights, visit Placer.ai.
As visits to Superstores continue to rise, we analyzed recent foot traffic data for Walmart, Target, Costco Wholesale, Sam’s Club, and BJ’s Wholesale Club and dove into Walmart’s Q1 2024 regional performance.
Shira Petrack
May 14, 2024
3 minutes
As visits to Superstores continue to rise, we analyzed recent foot traffic data for Walmart, Target, Costco Wholesale, Sam’s Club, and BJ’s Wholesale Club and dove into Walmart’s Q1 2024 regional performance.
Wholesale Club Lead Visit Growth, but Classic Superstores Maintain Overall Visit Edge
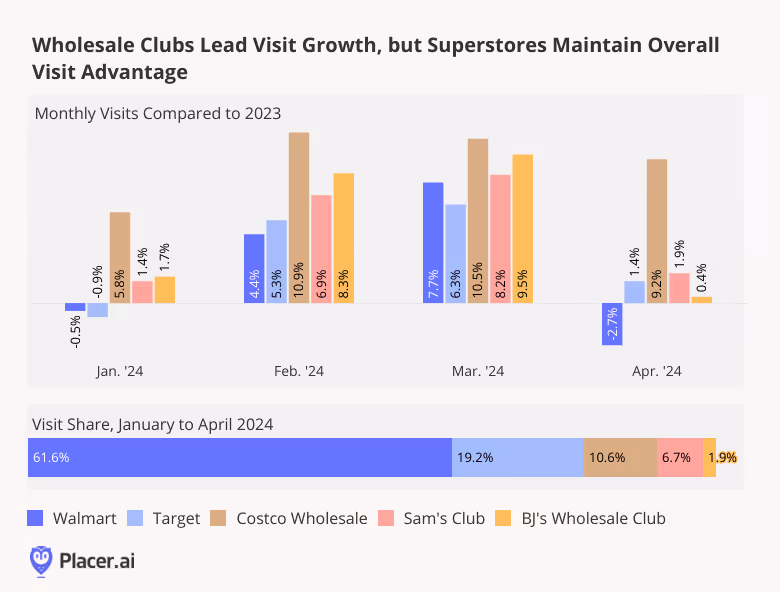
Wholesale chains – which receive about 20% of all visits to Walmart, Target, Costco Wholesale, Sam’s Club (owned by Walmart), and BJ’s Wholesale Club – generally outperformed classic superstore banners Target and Walmart during the first four months of the year. Visits to all three wholesale clubs analyzed were up every month on a year-over-year (YoY) basis, with Costco maintaining its lead in the space. Some of the success of wholesale clubs may be due to the makeup of their visitor base – Costco, Sam’s Club, and BJ’s tend to serve a large share of consumers from family households, and these may be opting for more buying in bulk in an effort to stretch budgets.
But visits to more classic superstores are also heating up – following a muted performance in January, when an arctic blast kept many at home, foot traffic to Target grew YoY in February, March, and April.
Walmart also experienced visit growth for most of the period, despite the slight dip in April due to calendar shifts: Visits for the superstore giant dropped 8.5% in YoY for the week of April 1st - 8th 2024 compared to the traffic surges of Easter week 2023 (April 3rd - 9th 2023), impacting the overall monthly numbers, but visits returned to growth during the last two weeks of April (4.3% and 4.0% YoY, respectively, for the weeks of April 15th - 21st and 22nd -28th).
Diving into Walmart
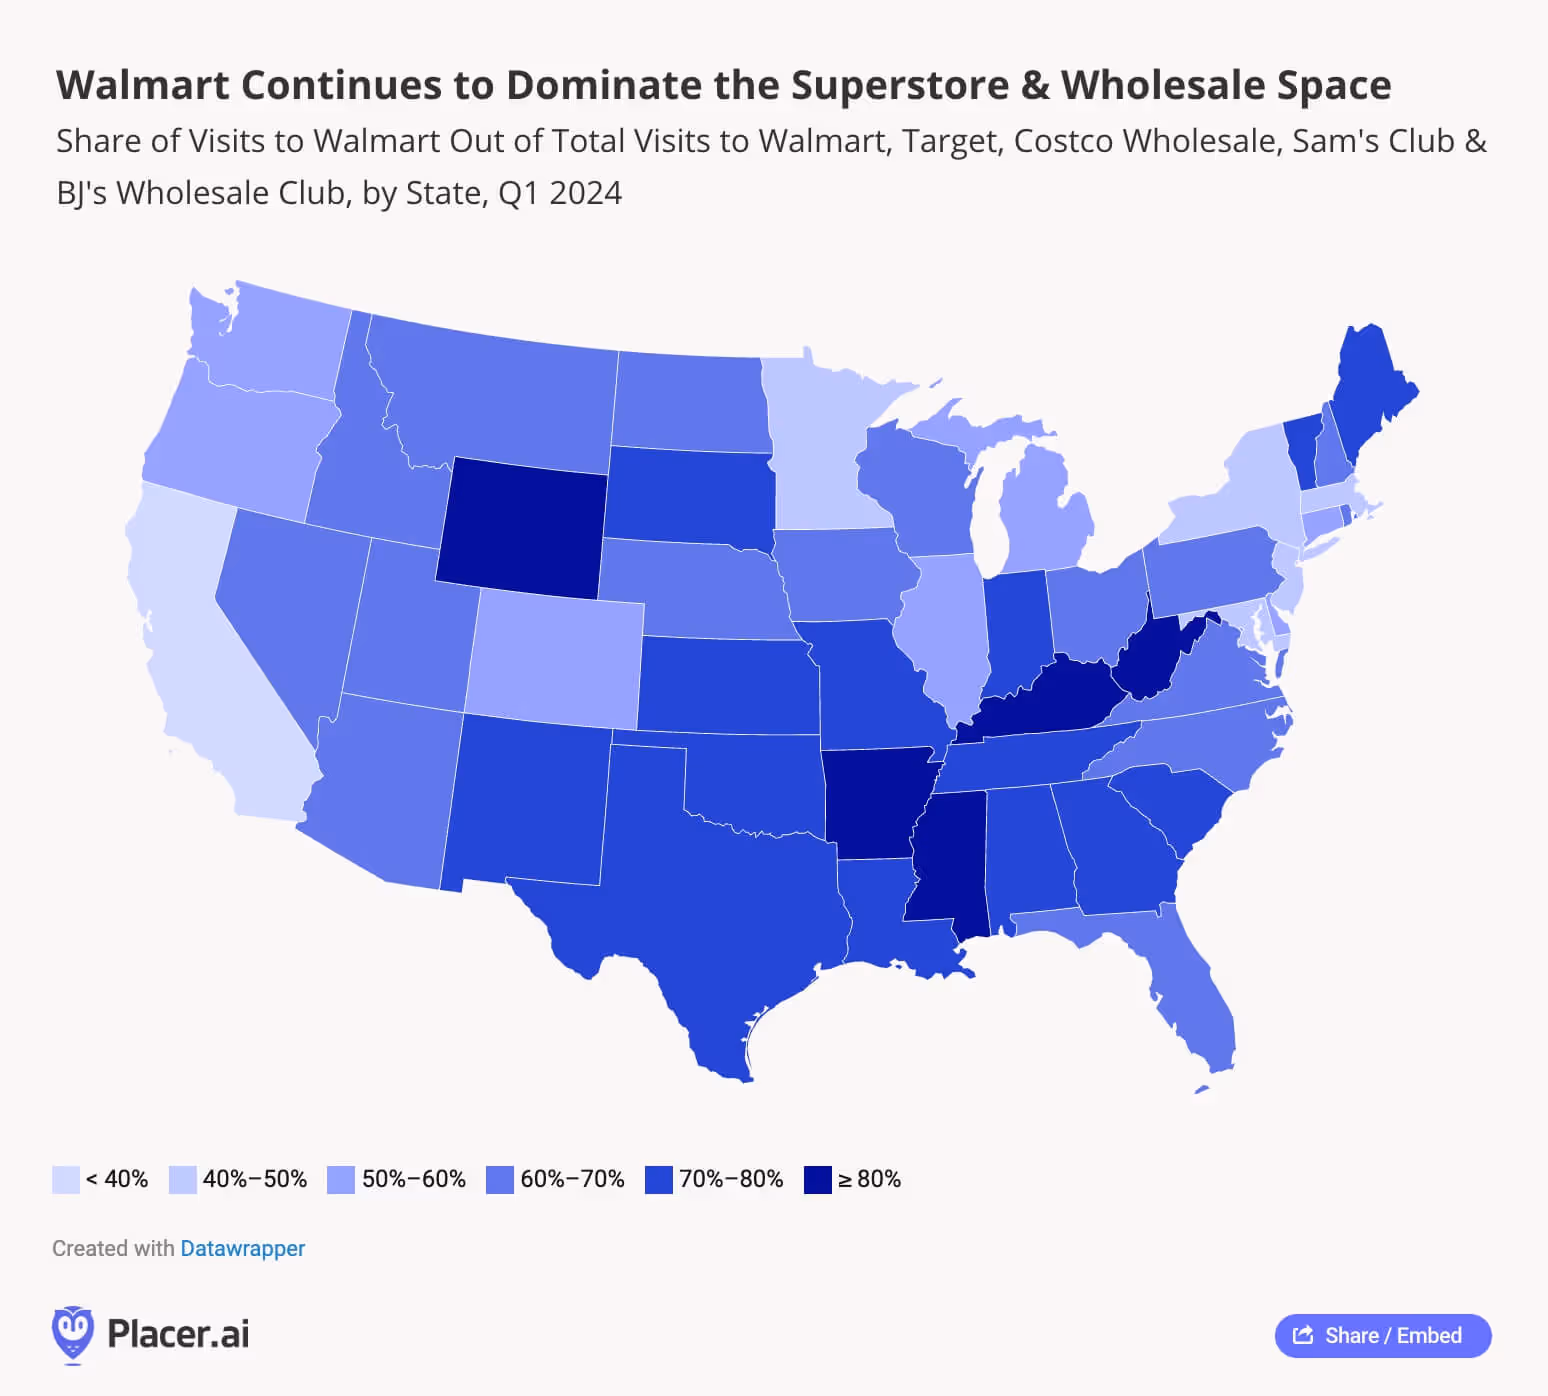
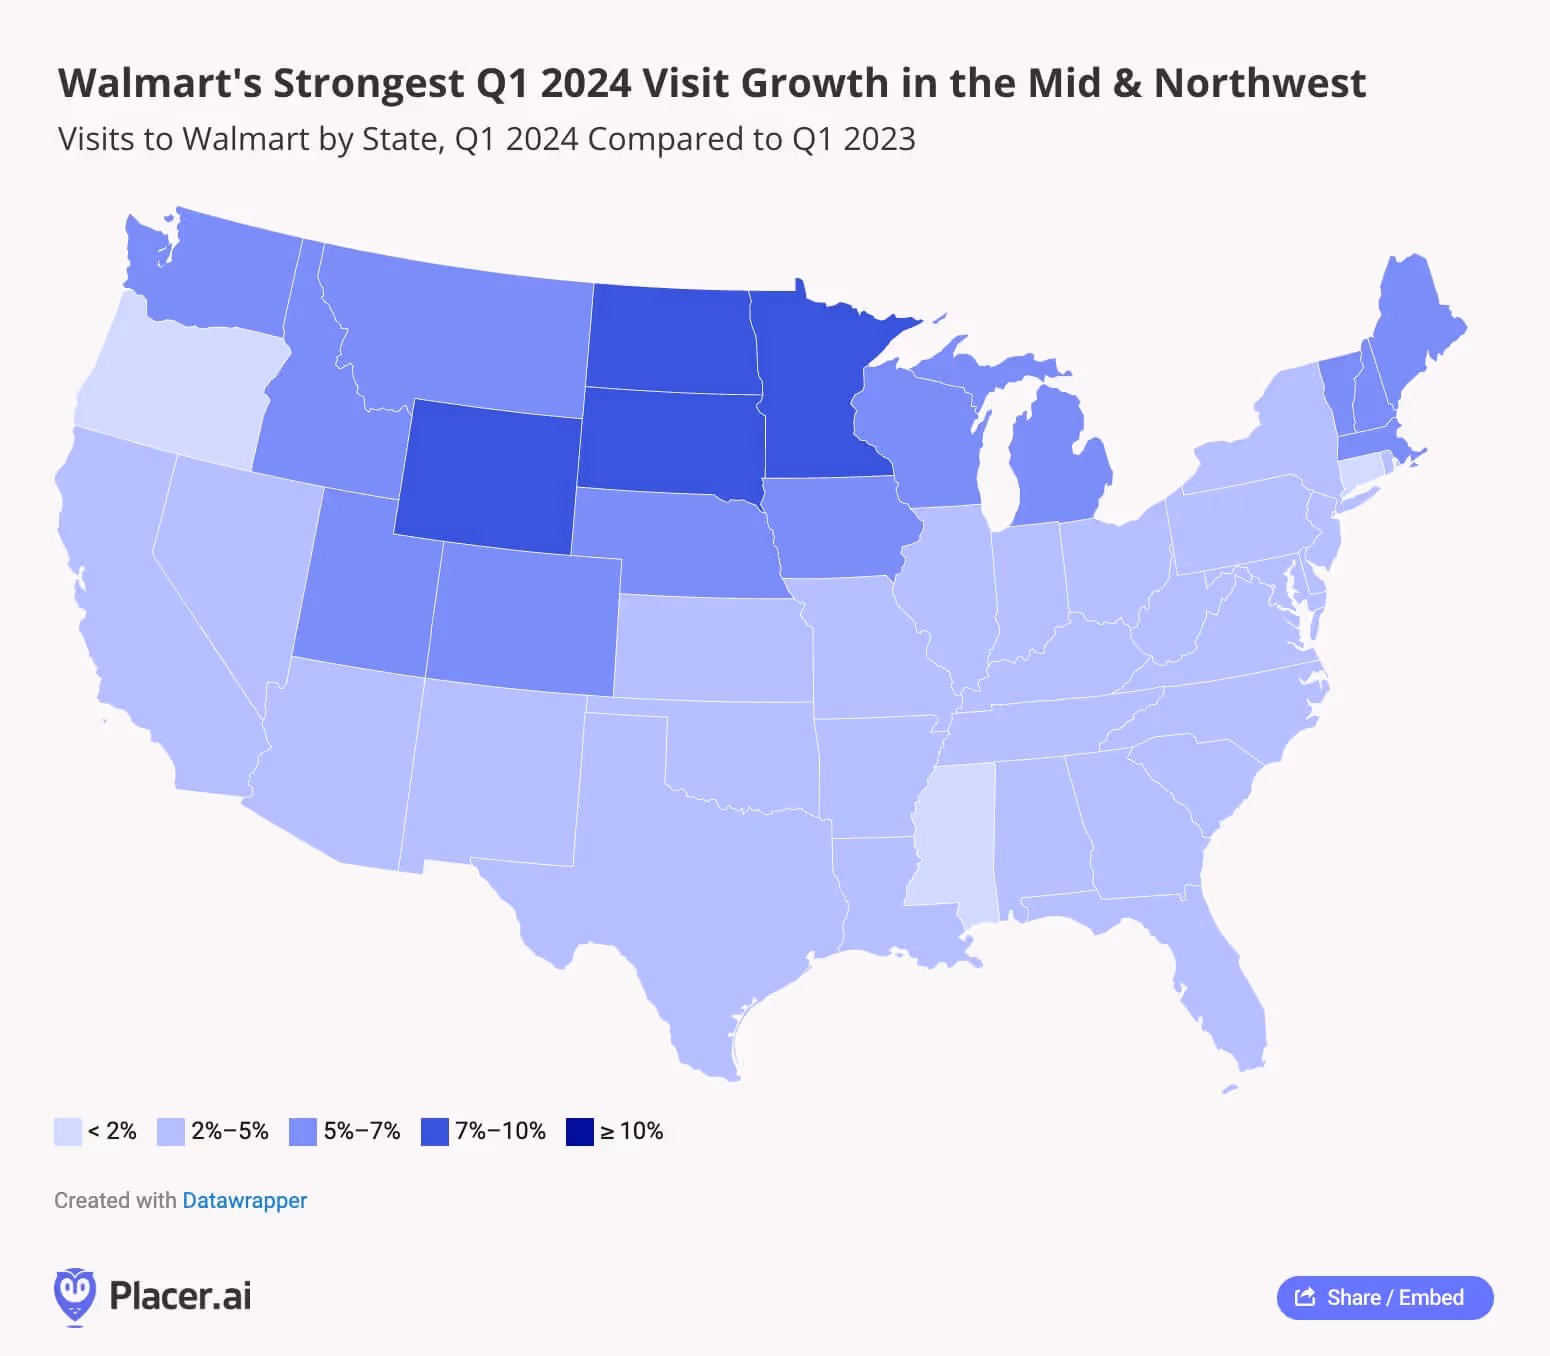
And while Walmart’s growth may not be quite as impressive as that of smaller superstores, the company has retained its position as the largest retailer in the U.S. Nationwide, the Walmart banner receives over 60% of all visits to Target, Walmart, Costco, Sam’s Club, and BJ’s, and in most of the south, the superstore’s relative visit share exceeds 70%. In a handful of states – including the retailer’s home state of Arkansas along with Mississippi, Kentucky, West Virginia, and Wyoming – 4 out of every 5 visits to the five superstore chains analyzed go to Walmart.
Walmart’s Potential to Grow Even Larger
And even as Walmart optimizes its fleet, analyzing the retailer’s Q1 2024 YoY visit increases by region reveals pockets of major growth throughout the country. In addition to the 2-5% traffic increases across most of the South – where the retailer already dominates the superstore space – Walmart is also posting impressive visit increases in the Northeast, Midwest, and Northwest, with the strongest growth in Minnesota, Wyoming, and the Dakotas.
As budget-strapped consumers continue looking for bargains, the legacy retail giant may still have room to grow even larger in 2024.
Superstores Set to Maintain Their Momentum in 2024
Superstore and wholesale club visits are on the rise as U.S. shoppers continue to defy predictions of a consumer spending slowdown while still looking for ways to stretch their budgets.
Will these trends continue as the year progresses?
We dove into the data for Dollar General, Dollar Tree, and Family Dollar to understand how these banners are performing and analyze the regional reach of each chain.
Shira Petrack
May 13, 2024
3 minutes
Discount & Dollar Stores have become an important part of the wider retail landscape over the past couple of years, and location intelligence indicates that the category is continuing to gain momentum in 2024. We dove into the data for Dollar General, Dollar Tree, and Family Dollar to understand how these banners are performing and analyze the regional reach of each chain.
Dollar Stores Still on the Rise
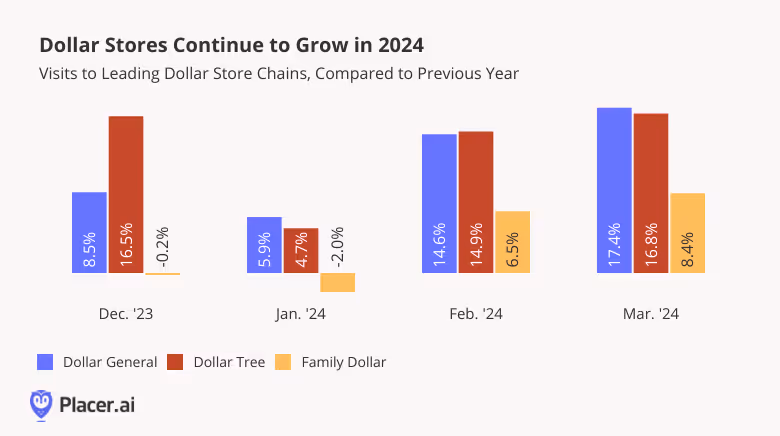
Recent visitation data for the major Discount & Dollar Store banners indicates that the category is still on the rise: Monthly visits to both Dollar General and Dollar Tree grew year-over-year (YoY) between December 2023 and March 2024. Dollar Tree-owned Family Dollar – which recently announced the closure of 1000 stores over the next couple of years – also saw its YoY traffic grow in February and March.
April Data Continues to Show Category’s Growth Potential
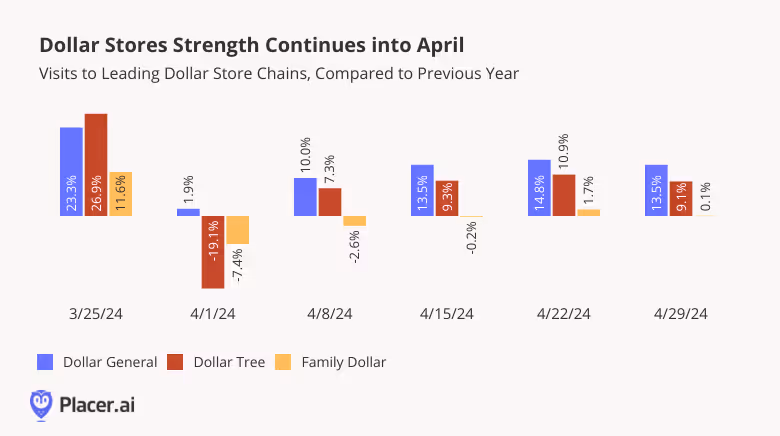
With the exception of the week of April 1st 2024 – when the Easter calendar shift caused a regular week in 2024 to be compared to the week of Easter in 2023 – visitation trends remained positive in April, highlighting the ongoing strength of the Discount & Dollar Store category. Even Family Dollar – which has already begun to close stores – saw its numbers remain on par with last year’s visit levels, indicating the ongoing demand for value-priced goods in 2024.
Regional Variations in Dollar Store Preferences
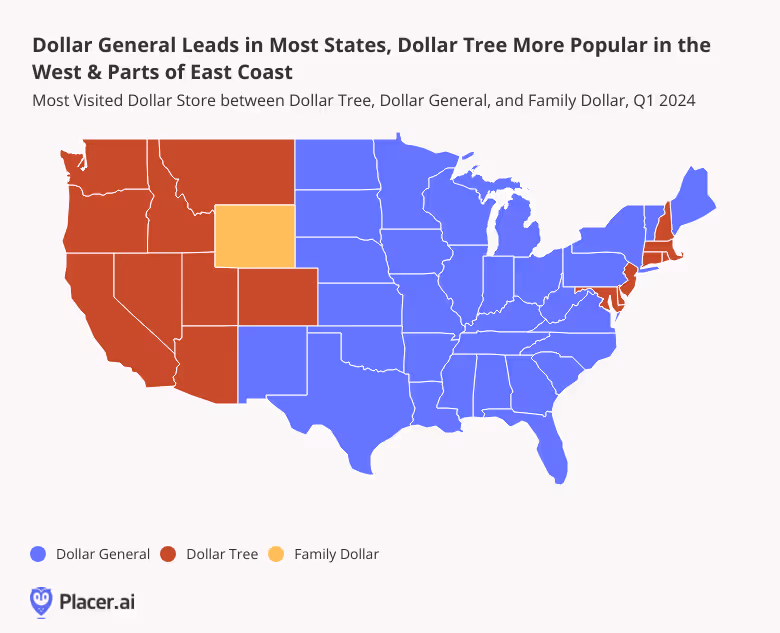
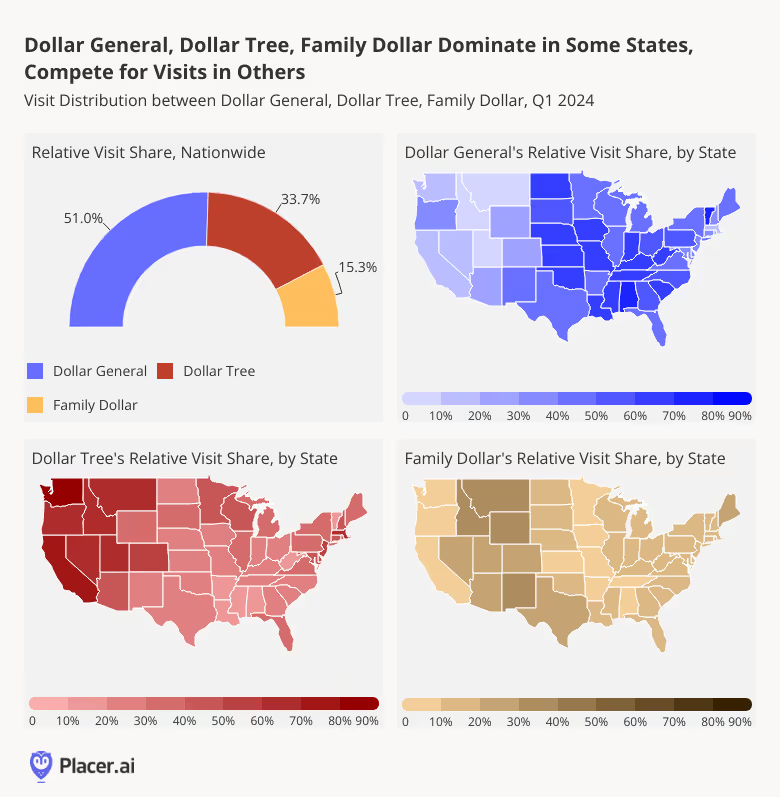
Looking at the Q1 2024 state-by-state relative visit share of the three chains – Dollar General, Dollar Tree, or Family Dollar – reveals some clear regional differences in consumer preferences across states.
Dollar Tree was more popular in the West, with the Dollar Tree brand leading in most western states and the company’s Family Dollar banner receiving the plurality of visits in Wyoming. Dollar Tree was also the most-visited chain in several states on the East Coast, including Maryland, New Jersey, Connecticut, and Massachusetts.
Dollar General, meanwhile, received the majority or plurality of the visit share in the rest of the country.
Room for Multiple Strong Players in Discount & Dollar Store Space
But although Dollar General does receive a majority of the combined Dollar General, Dollar Tree, and Family Dollar visit share nationwide, the Discount & Dollar Store category does not conform to a “winner-take-all” model. In many states, Dollar Tree’s visit share is just slightly lower than that of Dollar General.
In New York, for example, where Dollar General received 44.6% of the combined visit share in Q1 2024, 38.1% of visits in the same period went to Dollar Tree. And in Florida, where 44.2% of the combined visits to the three banners went to Dollar General, 38.2% of visits went to Dollar Tree. It seems, then, that even in states where Dollar General takes the lead, there is plenty of Discount & Dollar Store demand to sustain multiple players in the space.
Early 2024 data suggests that the Discount & Dollar Store sector is not slowing down any time soon. What will the rest of the year have in store for the space?
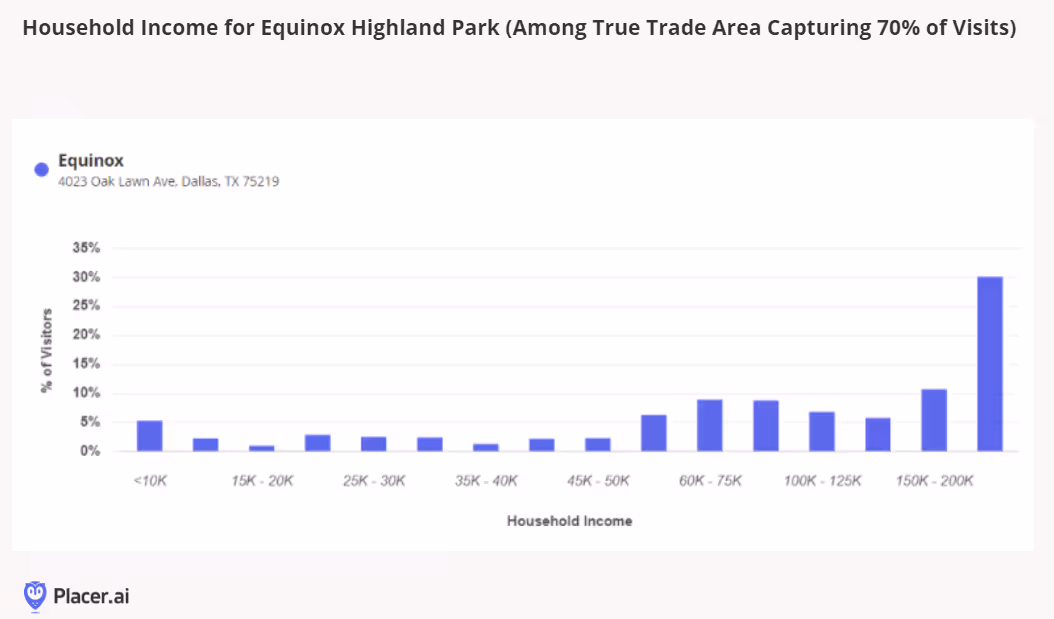
Equinox hit the news this week as they rolled out a new $40,000 per year longevity membership called “Optimize by Equinox.” This program promises to provide a personalized health plan of action that includes personal training, nutrition, sleep coaching, and massage therapy. There will also be biomarker testing in partnership with Function Health and fitness testing. New York City and Highland Park, Texas are the pioneering locations for this program, with more to come. Placer took a look at the Highland Park location as well as one on Greenwich Ave in New York City. The Highland Park location has shown extraordinary year-over-year growth, with each month of the year showing increases compared to the prior year. The New York City location is a bit more mixed but had a strong showing year-over-year last fall and at the beginning of 2024.
A 2023 survey by A/B Consulting and Maveron VC suggested that almost half (46%) of people earning over $250,000 would spend the majority of their discretionary income on trying to improve health and longevity, compared to only 34% of people earning under $50,000. Bryan Johnson is a tech millionaire who is often in the press with his latest experiments at reversing aging. From routine MRIs to frequent sampling of bodily fluids, he is a rare example of what one might do to try to live forever if one had nearly unlimited means to do so. While not all of us have millions to spend on unlocking the secrets to the fountain of youth, there’s no doubt that wellness and longevity are top of mind for many people, be it endeavoring to walk 10,000 steps a day or aiming for a rainbow diet. Looking at Equinox in Highland Park in Dallas, TX we see that indeed, this wealthy enclave is an apt location to pioneer this longevity offering. In the true trade area capturing 70% of visits, more than 3 in 10 have a household income exceeding $200K.
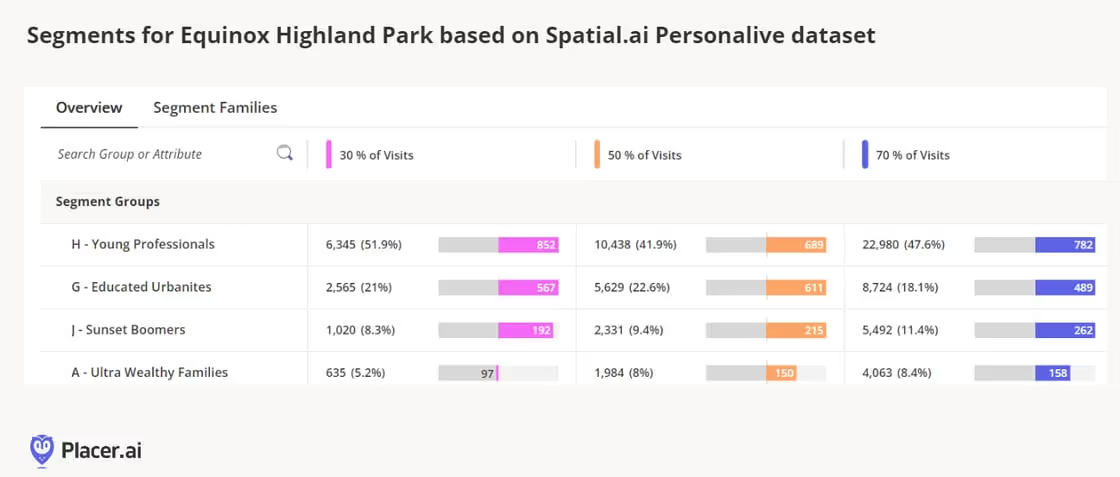
The Spatial.aiPersonaLive dataset further cements the fact that the top visitor segments are a group with higher-than-average discretionary incomes, such as Young Professionals, Educated Urbanites, Sunset Boomers, and Ultra Wealthy Families.
Additional data from the AGS Behavior & Attitudesdataset indicates that among those living in trade areas comprising 70% of visits to the Highland Park Equinox, many are indeed health-oriented, over-indexing on behaviors such as exercising (index 122), being yoga enthusiasts (index 168), and utilizing mobile app fitness trackers (index 160). However, they tend to under-index on getting regular medical checkups (index 86) - which is exactly where Optimize could fit in with its frequent testing and personalized approach. In addition, this particular location might want to take advantage of the clamor for pedicures (index 137) and manicures (index 147) and consider increased retail media network exposure due to enthusiasm for health info from TV (index 159).
Of all the specialty retail sectors, baby has been one of the most interesting to watch over the past few years for a few reasons. The industry is closely tied to a specific consumer life stage, and the CDC recently reported that the birth rate in the United States declined 2% in 2023, reaching the lowest rate recorded. If fewer consumers enter the family formation life stage, or have fewer children, the pool of potential visitors for retailers to draw from slowly dries up. The industry also faced massive disruption over the past year with the bankruptcy of Bed Bath & Beyond and the shuttering of its buybuy Baby chain last summer. The buybuy Baby closure marked the end of the large specialty baby chain sector in the retail industry, with the category facing the bifurcation of sales and traffic between big box retailers + Amazon and small independent specialty retailers.
Still, there have been some signs of life for baby-based retail despite the headwinds. Babylist, a popular online registry tool, launched its first brick-and-mortar outpost in Los Angeles last year. Buybuy Baby’s new owners reopened 11 locations in late 2023, concentrated in New England and the Mid-Atlantic. Then, in March, Kohl’s announced its partnership with WHP Global to bring Babies“R”Us to its stores. The Babies“R”Us shop-in-shop format receives a lot of positive momentum from both the Sephora at Kohl's partnership as well as the Toys“R”Us & Macy’s partnership; both predecessor collaborations have been rolled out to a majority, if not all, doors.
This week, we learned of the 200 initial locations receiving the Babies“R”Us (BRU) concept this summer, which will receive a wide assortment of hardgoods and softgoods, and be positioned next to the children’s apparel department. This new partnership is no doubt a continuation of Kohl’s strategy to attract and retain younger visitors, and the Babies“R”Us model can hopefully help the retailer hold onto Sephora shoppers as they enter the family formation period. Another likely goal is to steal some market share away from the mass merchants dominating in baby and lure some former buybuy Baby shoppers.
According to Placer.ai data, The Babies“R”Us + Kohl’s locations performed similarly to the total Kohl’s chain in 2024, with both chains showing visits down 23% year-over-year. The Babies“R”Us + Kohl’s locations do have a slightly higher visitor median household income of $84k compared to the total chain at $81K, which supports the notion that the Sephora & Babies“R”Us partnerships are meant to bring premium offerings to the typical store.
The partnership launch, as mentioned above, is a clear offensive move to capture some of the former buybuy Baby business in the areas where the locations did not reopen. Using Placer’s location analytics, we compared a national subset of 16 former buybuy Baby locations to the newly announced Babies”R”Us + Kohl’s locations. Looking at the visit demographics between the Kohl’s locations in the first four months of 2024 and the former buybuy Baby locations in 2023, it’s clear that Kohl’s attracts a suburban family and more mature consumer base, as where buybuy Baby locations were a stronghold with young urban singles and young professionals. Kohl’s may have an opportunity to attract new or existing grandparents to the partner stores, but will need to use the Sephora angle to attract younger consumers who may also be looking to start a family in the next few years.
Kohl’s is also betting big on the East Coast, with a number of partnership stores located in New York, New Jersey, Pennsylvania and Massachusetts. A few of these locations are in direct competition with the newly reopened buybuy Baby locations and will create some fascinating local competition. In the Boston metro area, there are both a Kohl’s and buybuy Baby location within 9 miles of each other but have local differences that may benefit Kohl’s entry into the market. Kohl’s has a median household income of about $30k more than visits to buybuy Baby and also captures more loyalty, with more loyal visits than buybuy Baby throughout the first four months of 2024.
This particular Kohl’s location has a smaller disparity to buybuy Baby in attracting young professionals, but it also attracts wealthier and more mature visitors that once again may translate into attracting parents and grandparents. 22% of buybuy Baby’s trade area overlaps with Kohl’s and the two share 11 square miles of overlapping trade area, so it will be interesting to see how Kohl’s can pull visits away from the competition.
As 2024 progresses, Kohl’s opens its partnership locations, baby retail will hopefully find its footing and provide retail solutions for potential and new parents. E-commerce has filled the void for baby registry services, but brick-and-mortar retail still holds a lot of importance for parents. Baby specialty retail is essential to the success of baby products and brands, and there is a lot of white space opportunity in the category for retailers to emerge to take share. Consumers, even if there are fewer of them, need experiences and solutions provided by retailers, and baby retail is a cautionary, but optimistic tale for other specialty sectors for the remainder of the year.
How did the home improvement and decor chains perform in the first months of 2024? We look at some of the categories’ biggest names – including Home Depot, Lowe’s, Tractor Supply Co., Harbor Freight Tools, Homesense, HomeGoods, and At Home – to see what Q1 portends for their performance the year.
Bracha Arnold
May 9, 2024
4 minutes
How did the home improvement and decor segments fare in the first months of 2024? We checked in with some of the categories’ biggest names – including Home Depot, Lowe’s, Tractor Supply Co., Harbor Freight Tools, Homesense, HomeGoods, and At Home – to see what Q1 portends for their performance the rest of the year.
Tide Turning For Major Home Improvement Chains
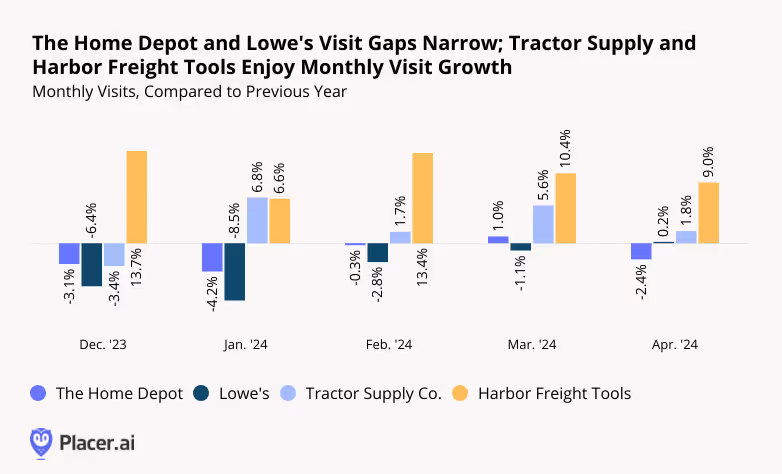
Last year was a challenging one for the home improvement space – as consumers cut back on discretionary spending and put pricey renovations on hold. But Q1 2024 visit data suggests that the category may be ready for a comeback. Throughout Q1 2024, Lowe’s saw its monthly visit gap narrow steadily – and in April 2024 saw the first YoY visit uptick the chain has experienced since 2021. And YoY visits to Home Depot were down just 0.3% in February 2024 and up 1.0% in March. Though Home Depot saw a minor visit gap emerge once again in April, the home improvement powerhouse appears to be on solid footing heading into the spring season.
While Home Depot and Lowe’s are rebounding, other home improvement chains are thriving. Discount chain Harbor Freight Tools continued to grow its footprint – and its visits – by expanding into new markets and cementing its role as a go-to destination for inexpensive home maintenance supplies. And farming essentials retailer Tractor Supply Co. also increased its store count together with its traffic. By occupying somewhat less discretionary niches, these two retailers have managed to avoid some of the headwinds plaguing the category.
More Decor
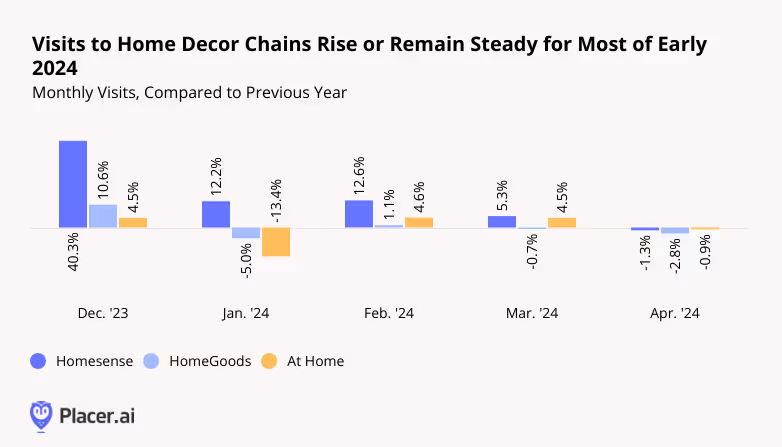
The home decor segment, including brands like Homesense, HomeGoods (both owned by parent company TJX Companies), and At Home, offers consumers a way to enhance their living spaces while avoiding the high costs associated with renovations or moving. And in Q1 2024, shoppers leaned into the category’s offerings.
Despite lapping a strong 2023, Homesense – which recently decided to close its ecommerce channel and focus on offline expansion – saw YoY visit growth throughout Q1. And though inclement weather weighed on HomeGoods’ and At Home’s January performance, YoY visits to the two brands increased or remained stable in February and March. In April 2024, all three chains held steady with slight YoY visit gaps – no small feat given the category’s largely discretionary nature.
Home Decor: An Affluent Consumer Base
Indeed, diving into the demographics of visitors to Homesense, HomeGoods, and At Home reveals that it is more affluent consumers that are driving visits to the three chains. Each chain's potential market* boasts a median household income (HHI) close to or above the nationwide median of $76.1K/year. But the median HHI of each chain’s captured market is notably higher – suggesting it is the wealthiest consumer segments in each chain’s trade area that are visiting the brands.
*A chain’s potential market refers to the population residing in a given trade area, where the Census Block Groups (CBGs) making up the trade area are weighted to reflect the number of households in each CBG. A chain’s captured market weighs each CBG according to the actual number of visits originating to the chain from that CBG.
Final Thoughts
Home improvement and decor chains have seen their shares of ups and downs over the past few years, from pandemic highs to inflationary lows. And while some players thrived in Q1 2024, others weathered headwinds while maintaining their equilibrium. How will the space continue to fare as 2024 progresses?
Dive into the data to find out how the dining category is performing in 2025, which segments are coming out on top, and how dining consumer behavior has shifted in recent years.
June 26, 2025
10 minutes
Key Takeaways:
1. Overall dining traffic is mostly flat, but growth is concentrated in specific areas.
While nationwide dining visits were nearly unchanged in early 2025, western states like Utah, Idaho, and Nevada showed moderate growth, while states in the Midwest and South, along with Washington D.C., saw declines.
2. Fine dining and coffee chains are growing through expansion, not just busier locations.
These two segments were the only ones to see an increase in total visits, but their visits-per-location actually decreased, indicating that opening new stores is the primary driver of their growth.
3. Higher-income diners are driving the growth in resilient categories.
The segments that saw visit growth—fine dining and coffee—also attracted customers with the highest median household incomes, suggesting that affluent consumers are still spending on dining despite economic headwinds.
4. Remote work continues to reshape dining habits.
The share of suburban customers at fine dining establishments has increased since 2019, while it has decreased for coffee chains. This reflects a shift towards "destination" dining closer to home and away from commute-based coffee runs.
5. Limited-service restaurants own the weekdays; full-service restaurants win the weekend.
QSR, fast casual, and coffee chains see the majority of their traffic from Monday to Friday, whereas casual and fine dining see a significant spike in visits on weekends.
6. Each dining segment dominates a specific time of day.
Consumer visits are highly predictable by the hour: coffee leads in the early morning, fast casual peaks at lunch, casual dining takes the afternoon, fine dining owns the dinner slot, and QSR captures the late-night crowd.
Year-over-Year Dining Traffic Trends
Dining Visits Mostly Up in the West, Down in Most of Midwest and East
Overall dining visits held relatively steady in the first five months of 2025, with year-over-year (YoY) visits to the category down 0.5% for January to May 2025 compared to the same period in 2024. Most of the country saw slight declines (less than 2.0%), though some states and districts experienced larger drops: Washington, D.C, saw the largest visit gap (-3.6% YoY), followed by Kansas and North Dakota (-2.9%), Arkansas (-2.8%), Missouri and Kentucky (-2.6%), Oklahoma (-2.1%), and Louisiana (-2.0%).
Still, there were several pockets of moderate dining strength, specifically in the west of the United States. January to May 2025 dining visits in Utah, Idaho, and Nevada increased 1.8% to 2.4% YoY, while the coastal states saw traffic rise 0.6% (California) to 1.2% (Washington). Vermont also saw a slight increase in dining visits (+1.9%).
Coffee & Fine Dining See Strongest Overall Visit Growth
Diving into visit trends by dining segment shows that fine dining and coffee saw the strongest overall visit trends, with visits to the segments up 1.3% and 2.6% YoY, respectively, between January and May 2025. But visits per location trends were negative for both segments – a decline of 0.8% YoY for fine dining and 1.8% for coffee during the period – suggesting that much of the visit strength is due to expansions rather than more crowded restaurants and coffee shops.
In contrast, full-service casual dining saw overall visits decrease by 1.5%, while visits per location remained stable (+0.2%) YoY between January and May 2025. Several casual dining chains have rightsized in the past twelve months – including Red Lobster, TGI Fridays, and Outback Steakhouse – which impacted overall visit numbers. But the data seems to show that their rightsizing was effective, as the remaining locations successfully absorbed the traffic and maintained performance levels from the previous year. And the monthly data also provides much reason for optimism, with May traffic up both overall and on a visit per location basis – suggesting that the casual dining segment is well positioned for growth in the second half of 2025.
Meanwhile, QSR and fast casual chains saw similar minor visits per venue dips (-1.5% and -1.2%, respectively). At the same time, QSR also saw an overall visit dip (-0.8%) while traffic to fast casual chains increased slightly (+0.3%) – suggesting that the fast casual segment is expanding more aggressively than QSR. But the two segments decoupled somewhat in May, with overall traffic and visits per venue to fast casual chains up YoY while traffic remained flat and visits per venue fell slightly for QSR – perhaps due to the relatively greater affluence of fast casual's consumer base.
Dining Demographics
Visitor Income Levels Hold Steady in Most Segments
Analyzing the income levels of visitors to the various dining segments over time shows that each segment followed a slightly different trend – and the differences in visitor income may help explain some of the current traffic patterns.
The only three segments with YoY visit growth – casual dining, fine dining, and coffee – also had the highest captured market median household income (HHI). Although the median HHI in the captured market of upscale and fine dining chains fell after COVID, it has risen back steadily over time and now stands at $98.0K – slightly higher than the $97.1K median HHI between January to May 2019. This may explain the segment's resilience in the face of wider consumer headwinds. Meanwhile, the median HHI at fast casual and coffee chains has fallen slightly, perhaps due to aggressive expansions in the space – including Dave's Hot Chicken and Dutch Bros – which likely broadened the reach of the segments, driving visits up and trade area median HHI down.
Like fine dining, casual dining also saw its trade area median HHI increase slightly over time – but the segment has still been facing visit dips. This could mean that, even though consumers trading down to casual dining may have boosted the trade area median HHI for the segment, it still might not have been enough to make up for the customers lost to tighter budgets.
The QSR segment saw its trade area median HHI remain remarkably steady – and visits to the segment have also been quite consistent – staying between $70.6K and $70.9K between 2019 and 2025 – which may explain why the segment's visits remained relatively stable YoY.
Suburban Dining Patterns
Diving into the psychographic segmentation shows that, although the fine dining segment attracted visitors from the highest-income areas between January and May 2025, fast casual chains drew the highest share of visitors from suburban areas, followed by casual dining and coffee. QSR attracted the smallest share of suburban visitors, with just 30.5% of the category's captured market between January and May 2025 belonging to Spatial.ai: PersonaLive suburban segments.
But looking at the data since 2019 reveals small but significant changes in the shares of suburban audiences in some categories' captured markets. And although the percentage changes are slight, these represent hundreds of thousands of diners every year.
The data shows that shares of suburban segments in the captured markets of fine dining chains have increased, while their share in the captured market of coffee chains has decreased. The shares of suburban visitors to QSR, fast casual, and casual chains have remained relatively steady.
This may suggest that the COVID-19 pandemic and the subsequent rise of remote and hybrid work models are still impacting consumer dining habits, benefiting destination-worthy experiences in suburban locales such as fine dining chains while reducing the necessity of daily coffee runs that were often tied to commuting and office work. Meanwhile, the stability in QSR, fast casual, and casual dining segments could indicate that these categories continue to meet consistent suburban demand for convenience and everyday dining, largely unaffected by the redistribution seen in the fine dining and coffee sectors.
Dining Consumer Behavior Trends
Although QSR, fast casual, casual dining, fine dining, and coffee all fall under the wider dining umbrella, the data shows distinct consumer behavior patterns regarding visits to these five categories.
Limited Service Leads Weekday Visit Share, Full Service Rules the Weekend
Limited service segments, including QSR, fast casual, and coffee tend to see higher shares of visits on weekdays, while full service segments – casual dining and fine dining – receive higher shares of weekend visits. Diving deeper shows that QSR has the largest share of weekday visits, with 72.3% of traffic coming in between Monday and Friday, followed by fast casual (69.8% of visits on weekdays) and coffee (69.4% of visits on weekdays.) Looking at trends within the work week shows that QSR receives a slightly larger visit share between Monday and Thursday compared to the other limited service segments. Meanwhile, coffee seems to receive the smallest share of Friday visits – 16.3% compared to 17.0% for fast casual and 17.2% for QSR.
On the full-service side, casual dining and fine dining chains have relatively similar shares of weekend visits (39.0% and 38.8%, respectively), but fine dining also sees an uptick of visits on Fridays (with 19.1% of weekly visits) as consumers choose to start the weekend on a festive note.
Each Segment Owns a Different Daypart
Hourly visit patterns also show variability between the segments. Coffee is the unsurprising leader of early visits, with 14.6% of visits taking place before 8 AM and, almost two-thirds (64.9%) of visits taking place before 2 PM. Fast casual leads the lunch rush (29.4% of visits between 11 AM and 2 PM), casual dining chains receive the largest share of afternoon (2 PM to 5 PM) visits, and fine dining chains receive the largest share of dinner visits, with almost 70% of visits taking place between 5 PM and 11 PM. QSR leads the late night visit share – 4.1% of visits take place between 11 PM and 5 AM – followed by casual dining chains (3.2% late night and overnight visit share), likely due to the popularity of 24-hour diners.
This suggests that each dining segment effectively "owns" a different part of the day, from the morning coffee ritual and the quick lunch break to the leisurely evening meal and late-night cravings.
Shorter Visits in Most Segments
An analysis of average visit duration also reveals a small but lasting shift in post-pandemic dining behavior. Between January and May 2025, the average dwell time for nearly every dining segment was shorter than during the same period in 2019. This efficiency trend is evident across limited-service categories like QSR, fast casual, and coffee shops, suggesting a continued emphasis on speed and convenience.
The one notable exception to this trend is upscale and fine dining, where the average visit duration has actually increased compared to pre-COVID levels. This may suggest that, while visits to most segments have become more transactional, consumers are treating fine dining more as an extended, deliberate experience, reinforcing its position as a destination-worthy occasion.
Dive into the data to see how consumer response to major promotional events – from Black Friday and the back-to-school shopping rush to brand-crafted LTOs – varies by market.
June 19, 2025
Key Takeaways
1. The Midwest is the only region where Black Friday retail visits outpace Super Saturday.
But several major Midwestern markets, including Chicago and Detroit, actually see higher shopper turnout on Super Saturday.
2. Holiday season demographic shifts also vary across regions.
Nationwide, electronics stores see a slight uptick in median household income (HHI) in December – yet in certain markets, electronics retailers such as Best Buy see a drop in captured market median HHI during this period.
3. Back-to-school shopping starts earliest for clothing and office supplies retailers in the South Central region, likely tied to earlier school schedules.
But back-to-school visits surge higher for these retailers in the Northeast later in the season.
4. The share of college students among back-to-school shoppers varies by region.
In August 2024, “Collegians” made up the largest share of Target’s back-to-school shopping crowd in New England, and the smallest in the West.
5. Mother’s Day drives the biggest restaurant visit spikes in the Middle Atlantic Region, while Father’s Day sees its biggest boosts in the South Atlanticstates.
Mother’s Day diners also tend to travel farther to celebrate, suggesting an extra effort to treat mom.
6. Western states proved particularly responsive to McDonald’s recent Minecraft promotion.
During the week of A Minecraft Movie’s release, the promotion drove significantly higher visit spikes in the West than in the Eastern U.S.
Zooming in on Local Trends
Retailers rely on promotional events to fuel sales – from classics like Black Friday and back-to-school sales to unique limited-time offers (LTOs) and pop-culture collaborations. Yet consumer preferences and behavior can vary significantly by region, making it critical to tailor campaigns to local markets.
This report dives into the data to reveal how consumers in 2025 are responding to major retail promotions, exploring both broad regional trends and more localized market-level nuances. Where is Black Friday most popular, and which areas see a bigger turnout on Super Saturday? Where are restaurants most packed on Mother’s Day, and where on Father’s Day? Which region kicks off back-to-school shopping – and where are August shoppers most likely to be college students? And also – which part of the country went all out on McDonald’s recent Minecraft LTO?
Read on to find out.
The Holiday Season: A Regional Story
Promotions aimed at boosting foot traffic on key holiday season milestones like Black Friday and Super Saturday are central to retailers’ strategies across industries. The day after Thanksgiving and the Saturday before Christmas typically rank among in-store retail’s busiest days, last year generating foot traffic surges of 50.1% and 56.3%, respectively, compared to a 12-month daily average. And
But a closer look at regional data shows that these promotions land differently across the country. In the Midwest, Black Friday outperformed Super Saturday last year, fueling the nation’s biggest post-Thanksgiving retail visit spike – a testament to the milestone’s strong local appeal. Meanwhile, in the Western U.S. Black Friday trailed well behind Super Saturday, though both milestones drove smaller upticks than in other regions. And in New England and the South Central states, Super Saturday achieved its biggest impact, suggesting that last-minute holiday specials may resonate especially well in that area.
Plenty of Local Variety
Digging deeper into major Midwestern hubs shows that even within a single region, holiday promotions can produce widely different responses.
In St. Louis, Indianapolis, and Minneapolis, for example, consumers followed the broader Midwestern pattern, flocking to stores on Black Friday exhibiting less enthusiasm for Super Saturday deals. By contrast, Chicago and Detroit saw Super Saturday edge ahead, with Chicago’s Black Friday peak falling below the nationwide average of 50.1%. examples highlight the power of local preferences to shape holiday campaign results.
Differing Demographic Shifts Across Regions
Holiday promotions don’t just drive visit spikes; they also spark subtle but significant changes in the demographic profiles of brick-and-mortar shoppers, expanding many retailers’ audiences during peak periods. And these shifts, too, can vary widely across regions.
Outlet malls, department stores, and beauty & self-care chains, for instance, which typically attract higher-income consumers, tend to see slight declines in the median household incomes (HHI) of their visitor bases in December. This dip may be due to promotions drawing in more mid- and lower-income shoppers during the peak holiday season. Electronics stores and superstores, on the other hand, which generally serve a less affluent base, see modest upticks in median HHI in the lead-up to Christmas.
But once again, drilling further down into regional chain-level data reveals more nuanced regional patterns. Take Best Buy, a leading holiday season electronics destination. In some of the chain’s biggest, more affluent markets – including New York, Los Angeles, and Chicago – the big-box retailer sees small dips in median HHI during December. But in Atlanta and Houston – also relatively affluent, but slightly less so – December saw a minor HHI uptick, hinting at a stronger holiday rush from higher-income shoppers in those cities.
Back-to-School Bonanzas
Back-to-school promotions also play a pivotal role in the retail calendar, with superstores, apparel chains, office supply stores and others all vying for shopper attention. And though summer markdowns drive increased foot traffic nationwide, both the timing of these shifts and the composition of the back-to-school shopping crowd differ among regions.
A Southern Head Start
Analyzing weekly fluctuations in regional foot traffic to clothing and office supplies stores shows, for example, that back-to-school shopping picks up earliest in the South Central region, likely due to earlier school start dates.
But the biggest visit peaks occur in the Northeast – with clothing retailer foot traffic surging in New England in late August, and office supplies stores seeing an even bigger surge in the Middle Atlantic region in early September. Retailers and advertisers can plan their back-to-school deals around these differences, targeting promotions to local trends.
A New England Collegian Affair
Though K-12 families drive much of the back-to-school rush, college student shoppers also play a substantial role. And here, too, their participation varies by region.
For instance, the “Collegians” segment accounted for 2.2% of Target’s shopper base nationwide over the past year – rising to 3.0% in August 2024. But regionally, the share of “Collegians” soared as high as 4.0% in New England versus just 2.2% in the West. So while retailers in New England may choose to lean into the college vibe, those in Western states may place greater emphasis on families with children.
Mother’s Day and Father’s Day: Differing Dining Peaks
When it comes to dining, Mother’s Day and Father’s Day are the busiest days of the year for the full-service restaurant (FSR) category, as families treat their parents to a hassle-free meal out. And eateries nationwide capitalize on this trend by offering a variety of deals and promotions that add a little extra charm (and value) to the experience.
Atlantic Specials
Nationwide, Mother’s Day drives more FSR foot traffic than Father’s Day – except in parts of the Pacific Northwest, where Father’s Day traditions run especially deep. Still, the size of these holiday boosts varies substantially by region.
This year, for instance, Mother’s Day (May 11, 2025) drove the largest FSR surge in the Middle Atlantic, with the South Atlantic and Midwest not far behind. Father’s Day, by contrast, saw its biggest lift in the South Atlantic. Mother’s Day proved least resonant in the West, whereas Father’s Day had its smallest impact in New England.
Going the Extra Mile for Mom
Dining behavior also differs between the two occasions. Mother’s Day celebrants display a slight preference for morning FSR visits and a bigger one for afternoon visits, while Father’s Day crowds favor evenings – perhaps reflecting a preference for sports bars and later dinners with dad. Another interesting nuance: On Mother’s Day, a larger share of FSR visits originate from between 3 and 50 miles away compared to Father’s Day, suggesting that families go the extra mile – sometimes literally – to celebrate mom.
Self-Styled Celebrations: Driving Traffic with DIY Milestones
While established dates like Black Friday or Mother’s Day naturally spur promotions, brands can also craft their own moments with limited-time offers (LTOs). And much like holiday campaigns, these retailer-led events can produce varied outcomes across different regions.
Fast food restaurants, for example, have leaned heavily on limited-time offers (LTOs) and pop-culture tie-ins to fuel buzz in what remains a challenging overall market. And McDonald’s recent Minecraft promotion, launched on April 1, 2025 to coincide with the April 3 release of A Minecraft Move, shows just how impactful the practice can be.
Nationally, the Minecraft promotion (featuring offerings for both kids and adults) drove a 6.9% lift in visits during the movie’s opening week. But the impact of the promotion was far from uniform across the U.S. Many of McDonald’s Western markets – including Utah, Idaho, Nevada, California, Texas, Arizona, Colorado, and Oregon – recorded visit lifts above 10.0%. Meanwhile, Kentucky saw a 2.1% dip, and several other Eastern states registered modest gains below 3.0%. The McDonald’s example illustrates the power of regional tastes to shape the success of even the most creative pop-culture collabs.
Adopting a Regional Lens
Whether it’s properly timing holiday and back-to-school discounts, recognizing where Mother’s Day or Father’s Day will resonate more, or pinpointing markets that respond best to pop-culture tie-ins, the data reveals that effective promotions depend heavily on local nuances. And by analyzing regional and DMA-level trends, retailers and advertisers can craft compelling, relevant campaigns that heighten engagement where it matters most.
Discover how mall anchors are transforming in 2025 – and how a foot-traffic-focused approach to choosing key tenants can drive visits and shopper engagement.
May 29, 2025
8 minutes
Key Takeaways
1. Experiential and niche retailers can deliver anchor-level traffic. At Towne East Square Mall, the addition of a Scheels in 2023 significantly increased foot traffic and long-distance travelers, while Barnes & Noble at Coronado Center in Albuquerque has become a key driver of both foot traffic and higher-spend demographics.
2. Size isn’t everything – especially for dining venues. At Glendale Galleria and Northridge Fashion Center, smaller restaurants attracted more foot traffic than some traditional anchors.
3. Refocusing on tenants’ actual traffic contributions enables a flexible anchor approach. Balancing weekend draws like Scheels with weekday favorites such as Costco or Chick-fil-A can help maintain steady visitor flow throughout the week. Similarly, onsite fitness clubs can shift traffic to earlier in the day – an opportunity to adjust store hours and capture additional morning shoppers.
4. Temporary pop-ups can form an integral part of a visit-focused anchor strategy. The Barbie Dreamhouse Living Truck Tour generates mall visit spikes well above typical Saturday levels. Operators can integrate these events into their overall anchor strategies, offering preferential terms to high-performing pop-ups.
5. New tenants can boost traffic for existing stores in similar categories. After Aldi joined Green Acres Commons in February 2020, visits to an existing BJ’s Wholesale Club trended upwards. This synergy highlights how overlapping audiences can become a strength, creating a larger overall customer base.
The Retail Comeback Kid
Malls, it seems, are cool once again. After languishing in the wake of the pandemic, shopping centers across the country are thriving – reinventing themselves as prime “third places” where people can hang out, shop, and grab a bite to eat.
One key driver behind this resurgence is a shift in how malls view their anchor tenants. While traditional mainstays like Macy’s and JCPenney still play an important role, specialized offerings – from popular eateries to fitness centers and immersive retailtainment destinations – are increasingly taking center stage. These attractions maximize the experiential value that brick-and-mortar venues can deliver, driving visits and sales for the center as a whole.
Against this backdrop, this report leverages the latest location intelligence data to explore the types of tenants that can function as mall anchors in 2025. Should mall operators still focus on general merchandisers to draw crowds, or can dining chains and more niche retailers also do the job? How important is square footage in identifying the anchor-like tenants in a shopping center? And how can a visit-focused approach help mall operators select effective anchor or anchor-like tenants – whether to fill big-box spaces or to leverage the leasing perks traditionally reserved for major large-format chains?
Out-of-the-(Big)-Box Visit Drivers
One of the most important functions of a mall anchor is to ensure steady visitation – providing its smaller tenants with a constant flow of potential customers. And as the role of the mall continues to evolve, analyzing the actual foot traffic impacts of different types of businesses can help identify the kinds of non-traditional anchors best suited to fulfill that purpose.
The Power of a Well-Placed Scheels
Experiential venues, for example, are particularly well-poised to serve as powerful anchors in today’s retail environment – as illustrated by the visit surge experienced by Towne East Square Mall in Wichita, KS following the addition of a Scheels in July 2023.
By blending traditional retail with immersive experiences, Scheels has emerged as a true experiential destination. And this pull has also helped the mall draw more long-distance visitors willing to travel to enjoy Scheels’ offerings. In 2024, 41.9% of the mall’s customers traveled more than 50 miles to visit, compared to 35.8% back in 2018 when Sears occupied the same lot.
Scheels Anchor Brings Substantial Visit Boost to Towne East Square Mall in Wichita, KS, Attracting Visitors From Further Away
Visits to Towne East Square Mall Compared to Q1 2018 Baseline
Share of Visitors From 50+ Miles Away
Share
Embed:
The Barnes & Noble Effect
Traditionally, anchors aimed to please the widest possible audiences – with department stores, big-box chains, and grocery stores leading the way. But visitation data shows that niche concepts can also deliver anchor-level traffic if they’re compelling enough to attract dedicated fans.
The experience of the Barnes & Noble at Coronado Center in Albuquerque, NM is a case in point. After being written off as all but obsolete, Barnes & Noble has staged an impressive comeback in recent years, finding success through a more curated, localized approach to book selling. And despite not being a formal anchor, the Coronado Center Barnes & Noble accounted for 7.9% of visits to the mall in 2024 – outperforming both Macy’s and JCPenney.
Year-over-year data also shows foot traffic surging at the Coronado Center Barnes & Noble, lifting overall visitation to the mall. And demographic data reveals that the bookstore draws a more affluent audience than either the center as a whole or the two department stores – attracting a crowd with more spending power.
This example also illustrates how smaller tenants can sometimes draw larger crowds. Even though Barnes & Noble occupies a smaller onsite space than either Macy’s or JCPenney, it is proving a powerful visit driver out of proportion to its physical size.
Dining Chains Punching Above Their Size
Dining chains are also adept at punching above their square footage – often attracting crowds disproportionate to their size.
Despite its relatively small footprint, for example, the In-N-Out Burger at Glendale Galleria drew an impressive 8.6% of visits to the mall complex in 2024, outpacing some of the mall’s official anchors like DICK’s Sporting Goods, Macy’s, and JCPenney. Still, the onsite Target drew even larger crowds at 14.4% of visits.
A similar pattern emerged at Northridge Fashion Center, where Porto’s Bakery and Cafe captured a notable 15.6% of visits to the complex in 2024 – more than some of the center’s traditional department stores.
These examples underscore the potential for dining chains, which typically require less space, to serve as micro-anchors by consistently attracting outsized crowds – a key consideration for mall operators looking to sustain visitor traffic.
Choosing a Mall Anchor in 2025
Refocusing on tenants’ actual foot traffic contributions also opens the door to a more flexible and dynamic approach to anchor selection and management – one that considers each venue’s unique visitation patterns.
The Weekend/Weekday Divide
Seasonal factors, for example, can make certain anchors more powerful at specific times of the year, while different venues shine on particular days of the week.
At Jordan Creek Town Center in West Des Moines, Iowa, for instance, Scheels and Costco each delivered just under 20.0% of the complex’s overall visits in 2024. But the two retailers’ daily patterns differed significantly: Scheels saw bigger crowds on weekends, while Costco was the primary weekday destination.
Understanding differences like these can help operators optimize their tenant mix to maintain a balanced flow of shoppers throughout the week.
Another example of the impact of differing weekday traffic patterns is offered by the impact of mall-based Chick-fil-A locations on the distribution of mall visits throughout the week.
Despite its relatively small size, Chick-fil-A draws substantial traffic to malls. And after adding Chick-fil-A locations, both Northridge and Miller Hill Malls saw meaningful drops in the share of visits to the centers taking place on Sundays – even as the wider indoor mall segment saw slight upticks.
Recognizing this trend could prompt mall operators to compensate by adding more weekend-friendly traffic drivers – or to lean into this distinction by taking additional steps to bolster the mall’s role as a go-to weekday destination.
The Early-Morning Fitness Advantage
The power of different mall traffic magnets also varies throughout the day. Increasingly, shopping centers are turning to fitness centers as experiential anchors. And since many people work out early in the morning, these gyms are having a significant impact on the distribution of mall visits across dayparts.
The addition of gyms to Northshore Mall in Peabody, MA and Jackson Crossing in Jackson, MI, for instance, led to a significant rise in visits between 7:00 AM and noon. And though the rest of the stores in these malls typically open at 10:00 or 11:00 AM, this shift presents the centers with a significant opportunity.
By adjusting opening hours to accommodate these early-morning patrons, malls can capitalize on this added traffic, driving up visits and sales for relevant tenants – especially health-focused retailers such as juice bars and sporting goods stores.
Adding Temporary Pop-Ups Into the Mix
Adopting a broader, visit-focused view of anchoring also allows mall operators to apply some of the strategies typically reserved for anchors to non-conventional traffic-generating businesses, to ensure a consistent flow of traffic year-round.
Pop-up stores and events, for example, generally don’t follow the same seasonal trends as other retailers – instead, they generate short-term visit boosts during their runs, whenever in the year that may be. And a visit-focused anchor strategy can leverage some of the perks traditionally reserved for anchor tenants – such as preferential leasing terms – to complement traditional full-time anchors during slower retail periods.
The Barbie Dreamhouse Living Truck Tour is a prime example of a traffic-driving pop-up. By bringing exclusive merchandise to malls across the U.S., the truck generates plenty of buzz, drawing crowds eager to snatch up limited-edition items and immerse themselves in all things Barbie. As a result, malls hosting the tour often see significant visit spikes, with foot traffic surging well above typical Saturday levels. Well-timed pop-ups like these can help balance out traffic throughout the year, offsetting traditional slow periods.
Creating a Bigger Visit Pie
A visit-focused approach to anchor management can also help mall operators assess the potential impact of new tenants on existing stores operating in similar categories. For example, mall owners often worry that new tenants operating in similar categories might cannibalize existing businesses. But a visit-focused anchor approach reveals that a well-chosen addition can sometimes benefit current tenants – especially if they cater to similar audiences.
In February 2020, for instance, value supermarket Aldi opened at Green Acres Commons in Valley Stream, NY – a center that already hosted budget-friendly BJ’s Wholesale Club. While BJ’s visits were relatively flat in 2018 and 2019, they began to rise after Aldi’s opening (and following a pandemic-induced dip). Cross-shopping data also shows that Aldi customers were more likely to visit BJ’s than the average Green Acres patron last year.
This synergy may be due in part to the two retailers’ similar visitor bases: In 2024, the Aldi and BJ’s stores in Green Acres Common drew shoppers with comparable economic profiles. This suggests that overlapping audiences can become a strength if aligned brands attract new shoppers, who then explore multiple stores in the same center.
Visits to BJ's Wholesale Club Took Off After Addition of Aldi to Green Acres Commons – Perhaps Buoyed by Audience Similarity
Visits to Green Acres Commons BJ's Wholesale Club, Compared to Q1 2018 Baseline
Median HHI, 2024*
Cross-Shopping, 2024
*Median HHI based on STI: PopStats dataset combined with Placer.ai data for captured trade areas.
Looking ahead, effective mall anchors will be defined less by physical footprint and more by their capacity to maintain consistent, valuable foot traffic. While traditional department stores remain pivotal, smaller or niche brands can often rival – or surpass – large-format retailers. And by thinking out of the anchor box and choosing tenants that cultivate a balanced visitor flow and align with local preferences, operators can position their centers as true go-to destinations.


.svg)


.avif)

.avif)


.avif)
.avif)


