Key Takeaways
1) Retail foot traffic faces lingering pressure – making promotions more critical than ever. Financial uncertainty, tariffs, and inflation continue to weigh on discretionary spending, making well-timed, targeted holiday promotions essential to reignite demand and drive in-store traffic.
2) The retail divide appears set to widen this holiday season – Luxury and off-price apparel are both outpacing overall retail, reflecting a deepening bifurcation of consumer behavior. And this December, the affluence gap between the two categories is expected to expand further, underscoring opportunities to engage both premium and value-focused shoppers across segments.
3) Despite slower overall performance, beauty and electronics have performed well during recent retail milestones. To make the most of this momentum, advertisers should align campaigns with shifting holiday audiences – electronics toward married homeowners and beauty toward affluent suburban families.
4) Early Promotions Could Lift In-Store Traffic – Last year, early holiday campaigns helped offset a shorter shopping season and sustain strong results. With another condensed window and continued shipping disruptions, retailers who start early and emphasize in-store availability will be best positioned to capture additional visits and outperform 2024’s results.
A Complex Season Ahead
The holiday season is fast approaching, but this year’s backdrop looks especially complex. Consumers are navigating heightened financial uncertainty, with tariffs driving up prices and disrupting supply, while inflation continues to weigh on discretionary spending.
For retailers and advertisers, the stakes are high. The holiday period remains a critical window for promotional engagement, and success will depend on understanding consumer behavior and crafting promotions that are timed, targeted, and designed to meet shoppers where they are.
We turned to foot traffic data to uncover the key trends shaping this season’s retail environment, and to identify promotional strategies likely to succeed.
Promotions Matter More Than Ever
Consumer activity appeared strong in most of early 2025 – except in February, when extreme weather and leap-year comparisons drove sharp year-over-year (YoY) declines. But foot traffic slowed this summer, highlighting the toll of lingering financial uncertainty and strain.
For advertisers, this underscores how pivotal seasonal promotions will be in reigniting demand. With many consumers cutting back on discretionary spending, well-timed and well-targeted campaigns will be essential to encourage shoppers to spend more freely during the holidays. These promotions don’t have to rely solely on price cuts — pop-culture collaborations and other creative product launches have also proven highly effective in driving traffic this year.
Bottom Line:
> Financial uncertainty and tighter household budgets are weighing on retail foot traffic this year – making effective holiday promotions more critical than ever.
Understanding the Retail Divide
Still, not all retail categories have been equally affected by broader economic headwinds. Some segments have experienced softer demand, signaling where advertisers may need to take a more measured, efficiency-focused approach. Others, however, have shown notable resilience – offering opportunities to double down on creative promotions that deepen engagement during the holidays.
One such segment is home furnishings, which has seen YoY traffic gains over the past 12 months, driven by the strong performance of discount chains as shoppers favor accessible décor updates over large-scale renovations. Strategic campaigns highlighting affordable refreshes and quick “holiday-ready” makeovers could give the category an additional lift in Q4, as households look to update their spaces in preparation for hosting family and friends.
But the biggest gains have been in the apparel category, where a bifurcation trend has emerged, boosting visits at both luxury and off-price retailers. The success of both segments underscores promotional strategies that can amplify momentum – steep-value discounts on one end of the spectrum, and exclusivity and quality on the other. Advertisers across retail segments can adapt this dual approach to engage both budget-driven and premium audiences effectively.
Deepening Bifurcation During the Holiday Period
And demographic data reveals just how deeply entrenched this bifurcation has become – especially during the holiday season.
The chart below examines monthly changes in the median household incomes (HHIs) of luxury and off-price retailers’ captured markets since January 2023. Even small shifts in HHI across major retail categories can signal meaningful changes in audience composition – and these patterns tell a clear story.
In luxury apparel, where the median HHI is well above the national average of $79.6K, visitor income follows a distinct seasonal rhythm. During the early holiday shopping period, HHI remains lower in October and dips slightly in November as middle-income shoppers take advantage of early promotions to snag products that may be out of reach the rest of the year. It then rises in December as affluent consumers return to purchase gifts. Notably, luxury HHI has trended upward since 2023 – with each holiday peak higher than the last – suggesting that this December’s visitor base will be even more affluent than last year.
For advertisers, this means late-season campaigns should prioritize prestige audiences while still engaging aspirational shoppers during early holiday promotions like Black Friday.
In the off-price apparel segment, on the other hand, median HHI typically declines during the holidays – especially in December – indicating an influx of more price-sensitive shoppers. And over time, this visitor base has become even more value-driven, reinforcing the importance of promotional messaging that emphasizes unbeatable deals and savings.
Together, these patterns once again highlight the growing need for tailored strategies: premium experiences for high earners and sharp value propositions for cost-conscious consumers – a lesson that may extend well beyond these categories.
Bottom Line:
>The retail divide is expected to deepen further in December 2025, with off-price retailers drawing more value-driven shoppers and luxury brands attracting increasingly affluent consumers.
The Opportunity in Beauty and Electronics
In a challenging economic environment, one might expect promotions around key retail milestones to prompt consumers to deviate from their usual habits, experimenting with new brands or categories. Yet the data shows that, for the most part, shoppers instead deepened their engagement with the retailers they already patronize – utilizing holiday promotions to buy the same products at better prices.
The graph below shows that during recent shopping milestones, the off-price and luxury categories both stood out in YoY performance – reflecting the strong momentum sustained by both segments over the past twelve months.
Beauty and Electronics Set to Shine
Still, the graph above also highlights two additional segments potentially poised for holiday success: beauty & self care and electronics.
Despite slower traffic over the past year, beauty retailers saw notable spikes around key recent promotional moments – including Black Friday, Mother’s Day, and Memorial Day. And although electronics retailers continued to face headwinds as consumers delayed big-ticket purchases – including during last year’s Black Friday – more recent milestones have seen traffic stabilize or even increase YoY.
This indicates that the right promotional environment can still effectively drive engagement in these discretionary categories, and that deal-driven behavior is likely to remain a defining theme this holiday season. In addition, as the replacement cycle begins for major electronics first purchased during the pandemic, shoppers may be especially willing to upgrade to a new TV or laptop if the right offer comes along.
Finding Their Audiences in the Holiday Season
But to make the most of the opportunity presented by Q4, advertisers and retailers in the beauty and electronics spaces should pay close attention to the shifting demographics of their in-store audiences during the holiday season.
For electronics retailers, married couples and homeowners become increasingly important during the peak holiday shopping period. Their share in the category’s captured market rises consistently each December, indicating that campaigns emphasizing household upgrades, family entertainment, and quality-of-life improvements may resonate most effectively in late Q4.
In contrast, beauty retailers – typically buoyed by young professionals – see their audience composition shift towards suburbia during the holidays. In December, the share of wealthy suburban families in beauty retailers’ captured markets grows meaningfully, while the share of young professionals declines. Advertisers can capitalize by highlighting premium bundles, limited-edition sets, and gifting options that speak directly to these households’ desire for premium, family-oriented products.
Bottom Line:
> Off-price and luxury retailers maintained strong performance during major retail milestones, but beauty and electronics stand out as rising opportunities for the 2025 holiday season.
> As holiday demographics shift during the holiday season – with electronics drawing more married homeowners and beauty attracting wealthier suburban families – campaigns that reflect these audiences’ lifestyles and priorities will resonate most.
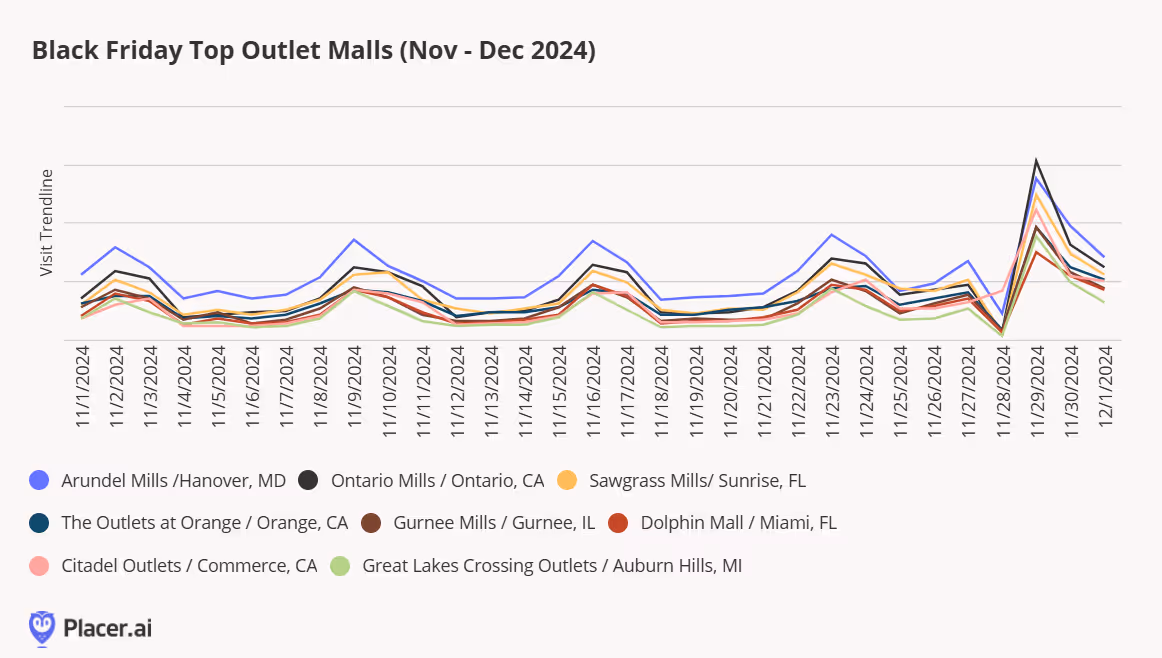
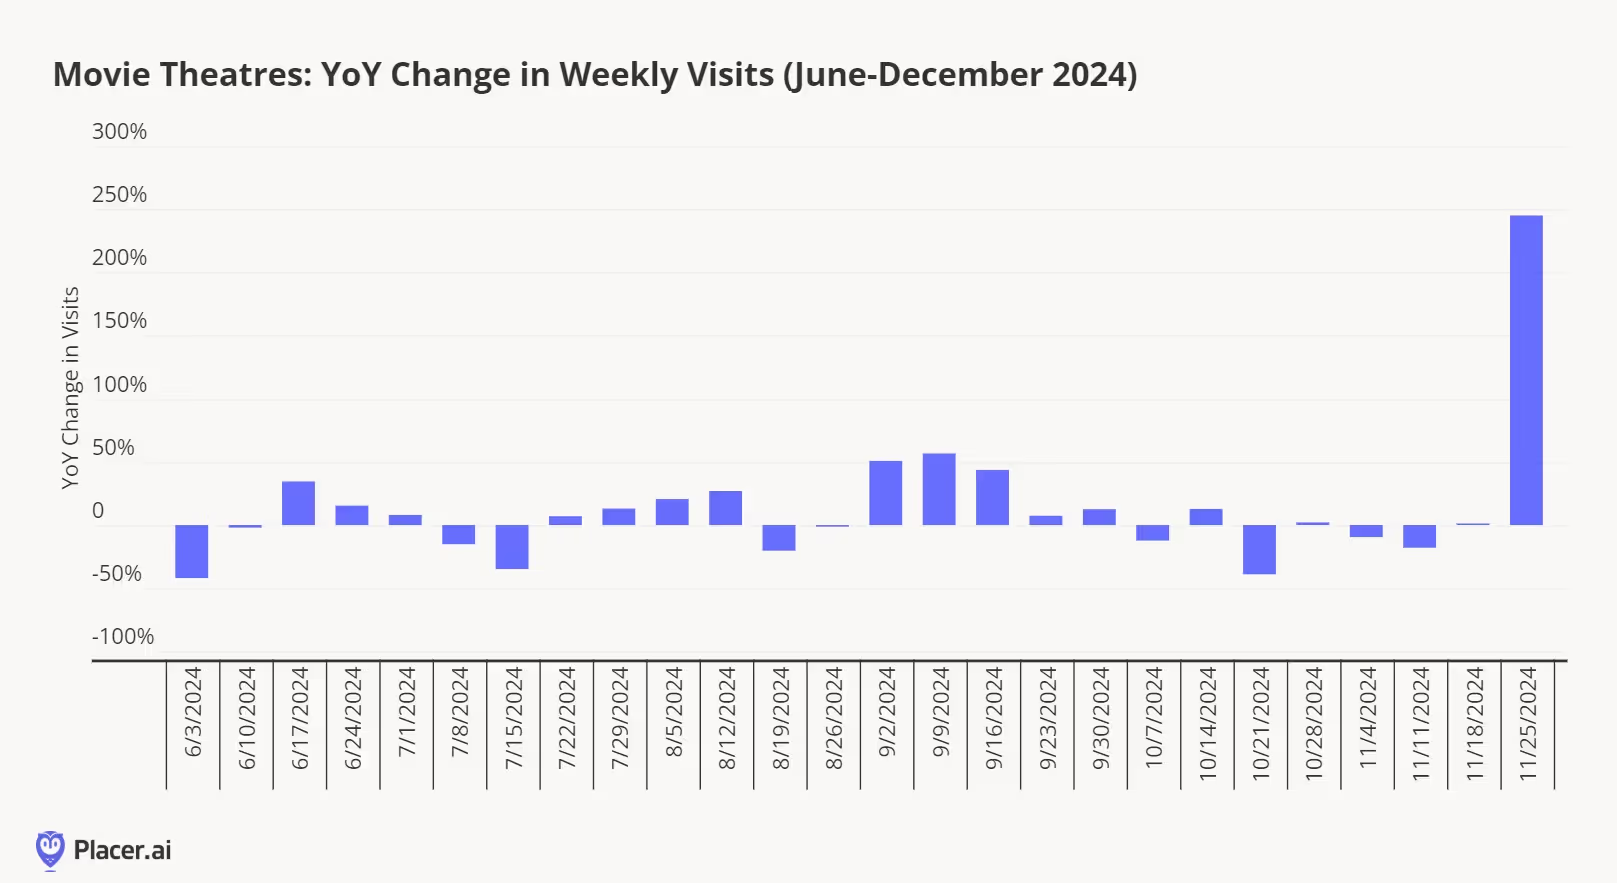
Early Holiday Push Could Lift In-Store Traffic
Timing is also a decisive factor in retailer and advertiser success during the holiday season.
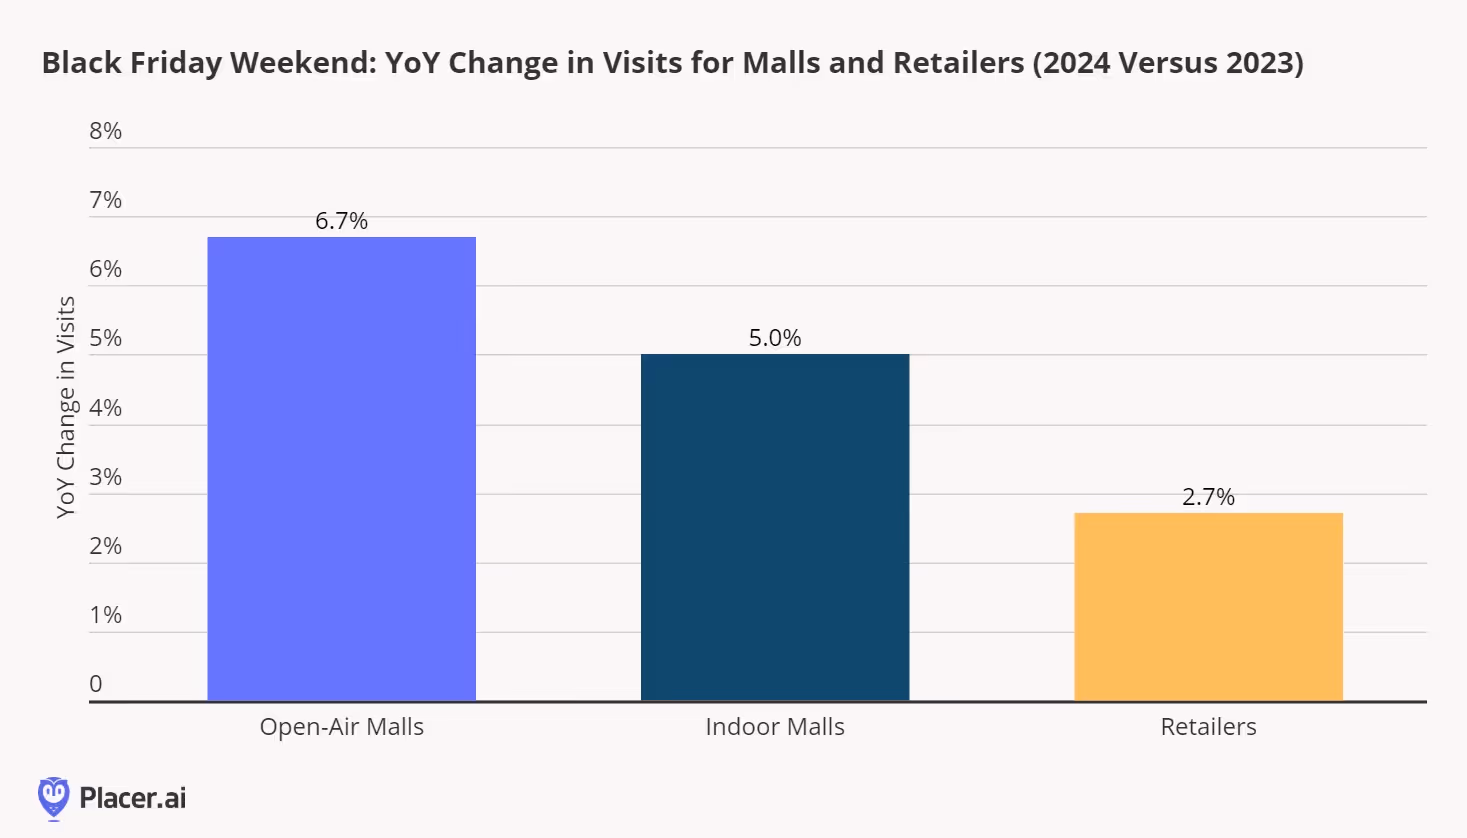
Traditionally, the “core” holiday retail period begins with Black Friday and continues until Christmas Eve. But in 2024, there was one fewer week between these two milestones compared to the previous year. And to compensate, many retailers launched an “early” holiday season, rolling out promotions in October and early November to maximize consumer engagement.
As the graph below shows, the shorter “core” season of 2024 unsurprisingly drew less in-store traffic across retail categories than the longer period the year before. Yet by embracing early promotions, retailers offset much of this shortfall, leading to overall holiday season results that, in many cases, matched or even exceeded 2023’s performance.
Looking ahead, 2025 once again brings a compressed “core” shopping window. And with shipping disruptions still influenced by shifting tariff regulations, more consumers may turn to brick-and-mortar stores earlier in the season to ensure timely purchases – further supporting offline traffic.
If retailers and advertisers double down on early-season engagement while continuing to drive momentum through the “core” weeks, YoY traffic for the 2025 holiday season could deliver even bigger overall gains than those seen in 2024.
Bottom Line:
> Last year, early holiday promotions helped offset a shorter core holiday season.
> In 2025, retail and advertising professionals are again faced with a relatively short core shopping season. And aware of the condensed timeline and shipping disruptions, more shoppers may opt for early in-store purchases to avoid the risk of delayed deliveries.
Balancing Value, Aspiration, and Timing
This holiday season will reward advertisers and retailers who recognize the growing retail divide and tailor their messaging to the shoppers most likely to visit during the holidays – whether married homeowners on the hunt for electronics or affluent suburban families seeking beauty products. As in 2024, acting early to offset a shorter core shopping period will be essential to capturing demand. And those who combine sharp timing with audience insight will be best positioned to turn a complex season into a strong finish.


.svg)


.png)
.png)

