

.svg)


Thank you! Your submission has been received!
Oops! Something went wrong while submitting the form.
0
0
0
0
----------
0
0
Articles
Article
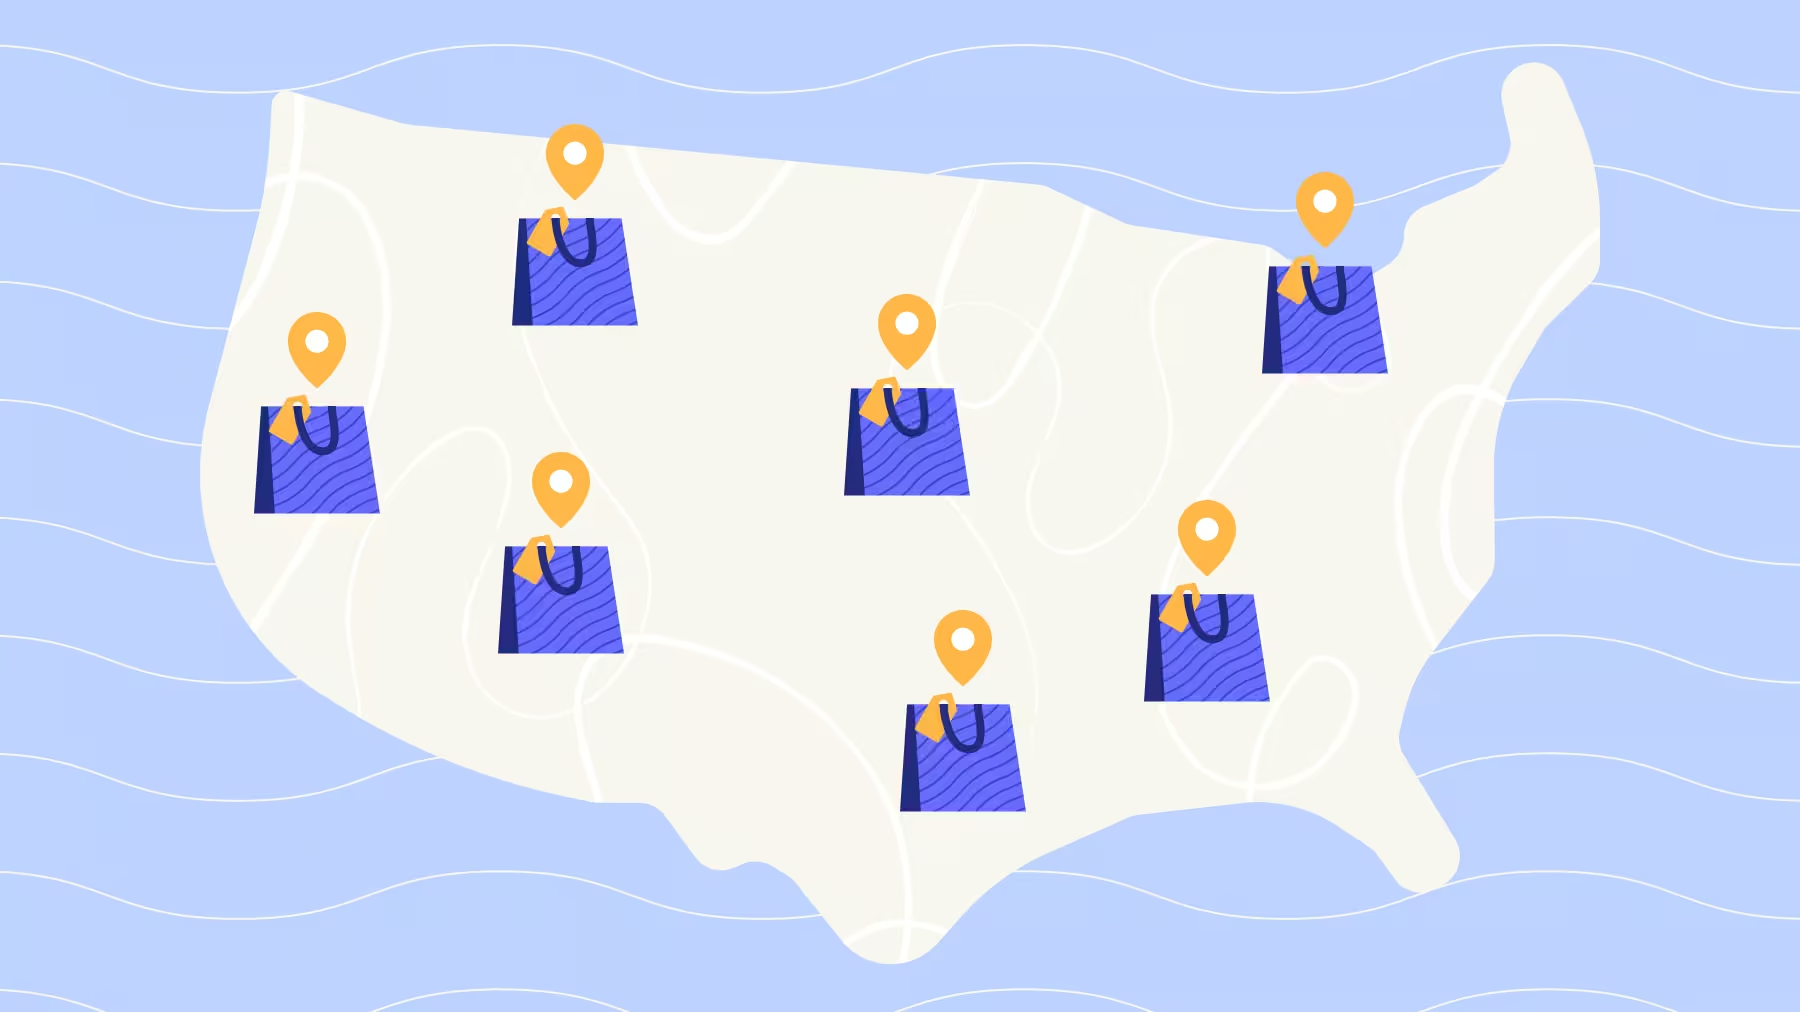
State-Level Retail in May 2026: Mapping the Impact of Gas Prices and Severe WeatherMay 2026 retail traffic was steady nationally, but rising gas prices and severe weather shaped state-level visitation patterns across the U.S.
Ezra Carmel
Jun 22, 2026
3 minutes

Article
What To Expect From Prime Day 2026? Amazon (AMZN) Prime Day 2026 arrives June 23-26. Retail foot traffic data suggests consumers remain engaged despite economic pressures, with major retailers entering the promotional season from varying positions of strength.
Shira Petrack
Jun 18, 2026
4 minutes

Article
What Can Restaurants Expect This Father’s Day?Placer.ai foot traffic data reveals what Mother's Day 2026 signals for Father's Day, why Texas Roadhouse is poised to dominate, and how consumers are spending on special-occasion dining.
Lila Margalit
Jun 17, 2026
3 minutes

Article
Why Activations on the Las Vegas Strip Are Key to the City's Tourism RecoveryRetail corridor traffic was already weakening under economic pressure. Now rising fuel prices are accelerating the slowdown, reshaping visit patterns and discretionary shopping behavior.
Ezra Carmel
Jun 16, 2026
3 minutes
.avif)
Article
The Economy Was Already Straining Retail Corridors – Now Fuel Prices Are Ramping Up the PressureRetail corridor traffic was already weakening under economic pressure. Now rising fuel prices are accelerating the slowdown, reshaping visit patterns and discretionary shopping behavior.
Ezra Carmel
Jun 15, 2026
3 minutes
%20(1).avif)
Article
May 2026 Placer.ai Dining Index: Is Drive-Thru Traffic Running Out of Gas?Placer.ai's May 2026 Dining Index reveals stronger full-service restaurant traffic, slowing fast-casual growth, and declining drive-thru visits as elevated gas prices continue to influence consumer dining behavior.
Ezra Carmel
Jun 12, 2026
2 minutes
Reports
INSIDER
Report
Five Ways Retailers Can Leverage AI Without Losing What WorksRead the report to learn how AI is changing store roles, operations, marketing, and fleet strategy – and how to apply it without undermining what already works.
January 29, 2026
INSIDER
Report
10 Top Brands to Watch in 2026Meet the ten retail and dining powerhouses, including H-E-B, Walmart, and Dave’s Hot Chicken, redefining success and winning consumer loyalty in 2026.
January 12, 2026
.avif)
INSIDER
Report
6 Coffee-Inspired Strategies That Can Reshape Dining in 2026Dive into the data to see how coffee became one of this year’s strongest dining performers – and explore strategies that can drive restaurant success across concepts in 2026.
December 18, 2025
Loading results...
We couldn't find anything matching your search.
Browse one of our topic pages to help find what you're looking for.
For more in-depth analyses on a variety of subjects, explore Reports.
For more in-depth analyses on a variety of subjects, explore Reports.

INSIDER
Stay Anchored: Subscribe to Insider & Unlock more Foot Traffic Insights
Gain insider insights with our in-depth analytics crafted by industry experts
— giving you the knowledge and edge to stay ahead.

