

.svg)


Thank you! Your submission has been received!
Oops! Something went wrong while submitting the form.
0
0
0
0
----------
0
0
Articles
Article
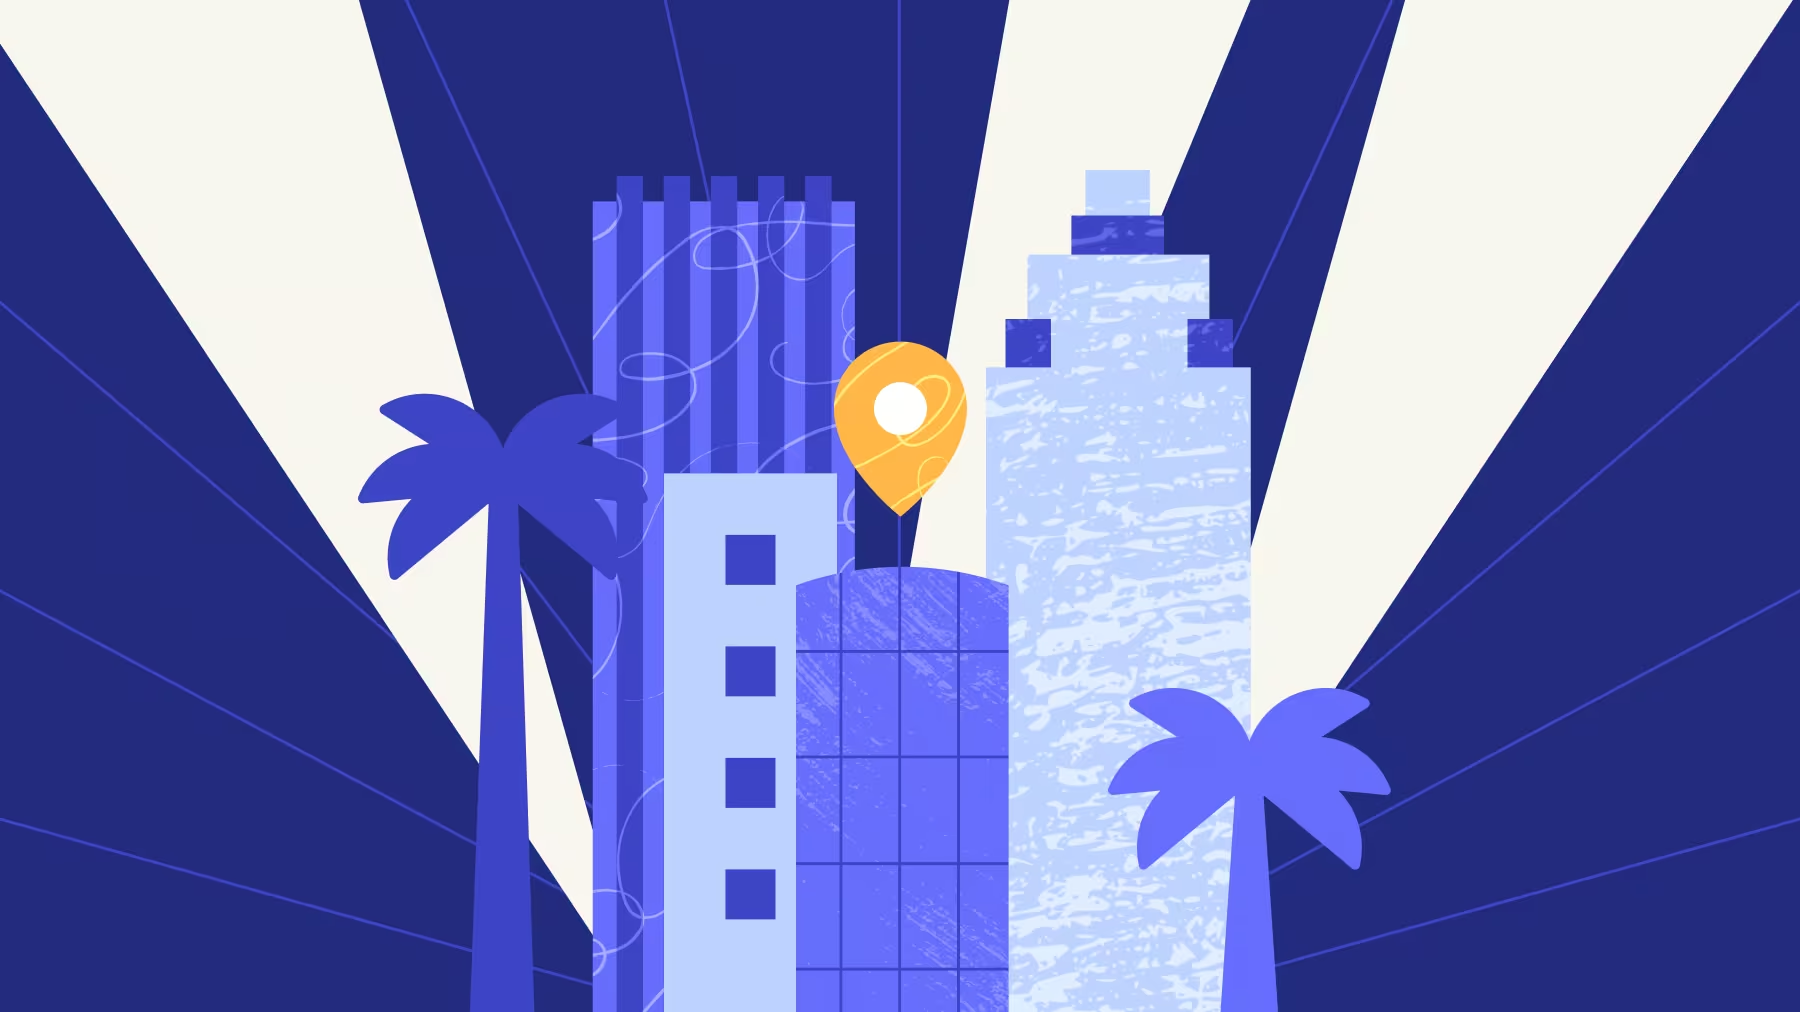
Why Activations on the Las Vegas Strip Are Key to the City's Tourism RecoveryRetail corridor traffic was already weakening under economic pressure. Now rising fuel prices are accelerating the slowdown, reshaping visit patterns and discretionary shopping behavior.
Ezra Carmel
Jun 16, 2026
3 minutes
.avif)
Article
The Economy Was Already Straining Retail Corridors – Now Fuel Prices Are Ramping Up the PressureRetail corridor traffic was already weakening under economic pressure. Now rising fuel prices are accelerating the slowdown, reshaping visit patterns and discretionary shopping behavior.
Ezra Carmel
Jun 15, 2026
3 minutes
%20(1).avif)
Article
May 2026 Placer.ai Dining Index: Is Drive-Thru Traffic Running Out of Gas?Placer.ai's May 2026 Dining Index reveals stronger full-service restaurant traffic, slowing fast-casual growth, and declining drive-thru visits as elevated gas prices continue to influence consumer dining behavior.
Ezra Carmel
Jun 12, 2026
2 minutes
Article
Can Bob Wright Work His Potbelly Magic at Wendy’s?Wendy’s has tapped former Potbelly CEO Bob Wright to reverse declining traffic and sales trends. Location analytics reveal where the burger chain is losing ground—and the demographic and daypart opportunities that could fuel a turnaround.
Shira Petrack
Jun 11, 2026
4 minutes
.avif)
%20(1).avif)
Article
Placer.ai May 2026 Mall Index: Malls Defy the SlowdownMall traffic increased across all major formats in May 2026 despite weak consumer sentiment and broader retail softness. Learn why malls continue to outperform discretionary retail and what the trend signals for the months ahead.
Shira Petrack
Jun 9, 2026
3 minutes
Reports
INSIDER
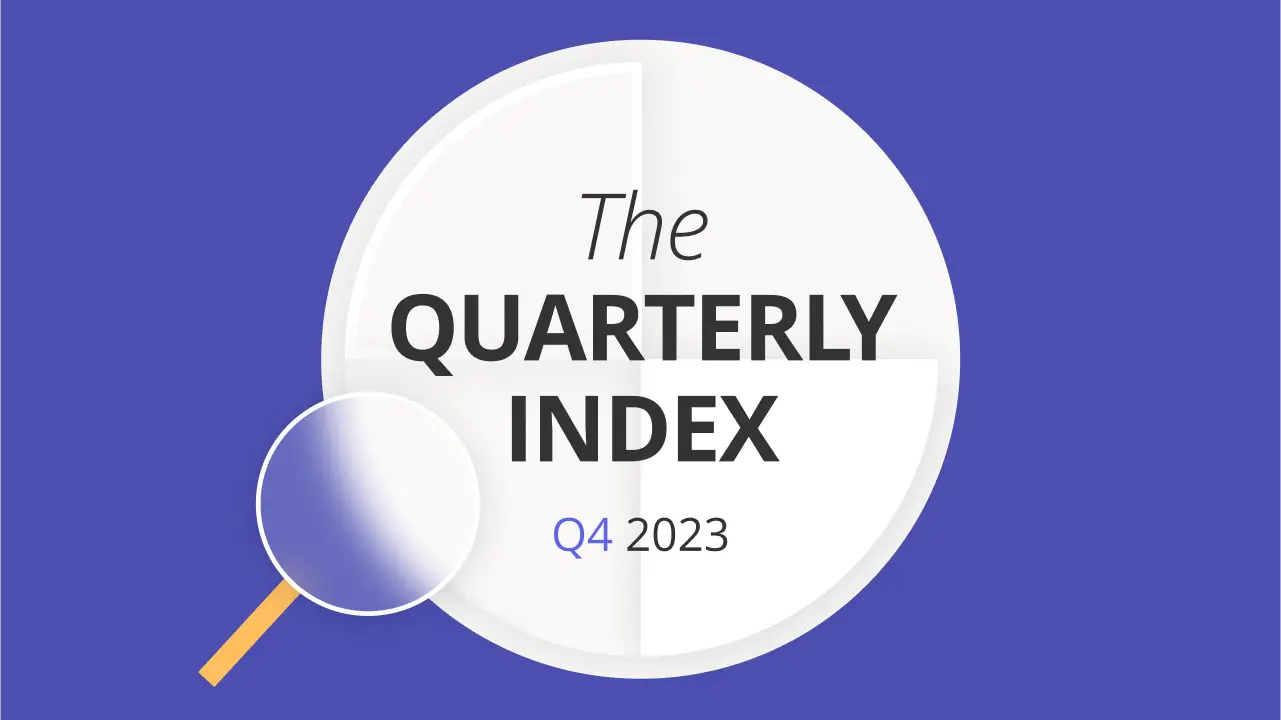
Q4 2023 Quarterly IndexFind out how the Fitness, Beauty & Self Care, Discount & Dollar Stores, Superstores, Grocery Stores, and Dining categories fared during last year’s all-important holiday shopping season.
February 15, 2024
6 minutes
INSIDER
10 Top Brands to Watch in 2024This report analyzes the latest location intelligence data to identify ten brands poised to succeed in 2024.
February 8, 2024

INSIDER
The Retail Opportunity of StadiumsDive into the location intelligence to understand the significant retail and dining opportunities in and around major stadiums – both during games and in the off-season.
January 11, 2024
7 minutes
Loading results...
We couldn't find anything matching your search.
Browse one of our topic pages to help find what you're looking for.
For more in-depth analyses on a variety of subjects, explore Reports.
For more in-depth analyses on a variety of subjects, explore Reports.

INSIDER
Stay Anchored: Subscribe to Insider & Unlock more Foot Traffic Insights
Gain insider insights with our in-depth analytics crafted by industry experts
— giving you the knowledge and edge to stay ahead.

