Q1 2024 Overview
Overall Retail on the Rise
The first quarter of 2024 was generally a good one for retailers. Though unusually cold and stormy weather left its mark on the sector’s January performance, February and March saw steady year-over-year (YoY) weekly visit growth that grew more robust as the quarter wore on.
March ended on a high note, with the week of March 25th – including Easter Sunday – seeing a 6.1% YoY visit boost, driven in part by increased retail activity in the run-up to the holiday. (Last year, Easter fell on April 9th, 2023, so the week of March 25th is being compared to a regular week.)
Though prices remain high and consumer confidence has yet to fully regain its footing, retail’s healthy Q1 showing may be a sign of good things to come in 2024.
Success Across Categories
Drilling down into the data for leading retail segments demonstrates the continued success of value-priced, essential, and wellness-related categories.
Discount & Dollar Stores led the pack with 11.2% YoY quarterly visit growth, followed by Grocery Stores, Fitness, and Superstores – all of which outperformed Overall Retail. Dining also enjoyed a YoY quarterly visit bump, despite the segment’s largely discretionary nature. And despite the high interest rates continuing to weigh on the housing and home renovation markets, Home Improvement & Furnishings maintained just a minor YoY visit gap.
Discount & Dollar Stores
Discount & Dollar Stores experienced strong YoY visit growth throughout most of Q1 – and as go-to destinations for groceries and other other essential goods, they held their own even during mid-January’s Arctic blast. In the last week of March, shoppers flocked to leading discount chains for everything from chocolate Easter bunnies to basket-making supplies – driving a remarkable 21.5% YoY visit spike.
Dollar General Reins Supreme
Dollar General continued to dominate the Discount & Dollar Store space in Q1, with visits to its locations accounting for nearly half of the segment’s quarterly foot traffic (44.7%). Next in line was Dollar Tree, followed by Family Dollar and Five Below. Together, the four chains – all of which experienced positive YoY quarterly visit growth – drew a whopping 91.6% of quarterly visits to the category.
Grocery Stores
Rain or shine, people have to eat. And like Discount & Dollar Stores, traditional Grocery Stores were relatively busy through January as shoppers braved the storms to stock up on needed items. Momentum continued to build throughout the quarter, culminating in a 10.5% foot traffic increase in the week ending with Easter Sunday.
Aldi Leads the Way
Like in other categories, it was budget-friendly Grocery banners that took the lead. No-frills Aldi drove a chain-wide 24.4% foot traffic increase in Q1, by expanding its fleet – while also growing the average number of visits per location. Other value-oriented chains, including Trader Joe’s and Food Lion, experienced significant foot traffic increases of their own. And though conventional grocery leaders like H-E-B, Kroger, and Albertsons saw smaller visit bumps, they too outperformed Q1 2023 by meaningful margins.
Fitness
January is New Year’s resolution season – when people famously pick themselves up off the couch, dust off their trainers, and vow to go to the gym more often. And with wellness still top of mind for many consumers, the Fitness category enjoyed robust YoY visit growth throughout most of Q1 – despite lapping a strong Q1 2023.
Predictably, Fitness’s visit growth slowed during the last week of March, when many Americans likely indulged in Easter treats rather than work out. But given the category’s strength over the past several years, there is every reason to believe it will continue to flourish.
Value Chains Come out Ahead
For Fitness chains, too, cost was key to success in Q1 – with value gyms experiencing the biggest visit jumps. EōS Fitness and Crunch Fitness, both of which offer low-cost membership options, saw their Q1 visits skyrocket 28.9% and 22.0% YoY, respectively – helped in part by aggressive expansions. At the same time, premium and mid-range gyms like Life Time and LA Fitness are also finding success – showing that when it comes to Fitness, there’s plenty of room for a variety of models to thrive.
Superstores
Superstores – including wholesale clubs – are prime destinations for big, planned shopping expeditions – during which customers can load up on a month’s supply of food items or stock up on home goods. And perhaps for this reason, the category felt the impact of January’s inclement weather more than either dollar chains or supermarkets – which are more likely to see shoppers pop in as needed for daily essentials.
But like Grocery Stores and Discount & Dollar Stores, Superstores ended the quarter with an impressive YoY visit spike, likely fueled by Easter holiday shoppers.
Warehouse Clubs Continue to Thrive
As in Q4 2023, membership warehouse chains – Costco Wholesale, BJ’s Wholesale Club, and Sam’s Club – drove much of the Superstore category’s positive visit growth, as shoppers likely engaged in mission-driven shopping in an effort to stretch their budgets. Still, segment mainstays Walmart and Target also enjoyed positive foot traffic growth, with YoY visits up 3.9% and 3.5%, respectively.
Dining
Moving into more discretionary territory, Dining experienced a marked January slump, as hunkered-down consumers likely opted for delivery. But the segment rallied in February and March, even though foot traffic dipped slightly during the last week of March, when many families gathered to enjoy home-cooked holiday meals.
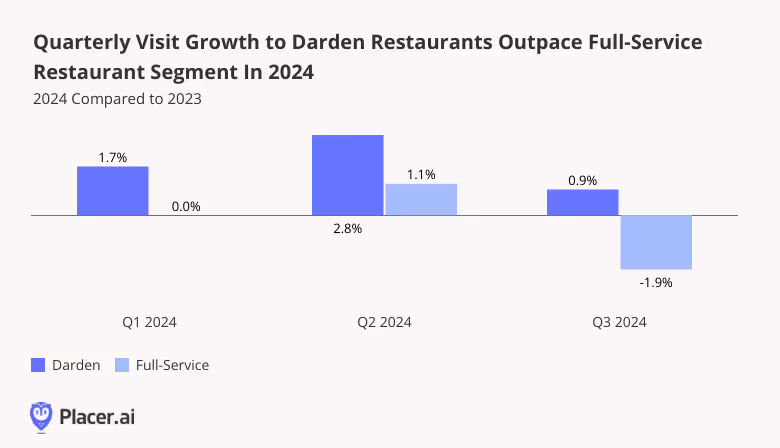
Coffee, Coffee, Coffee!
Coffee Chains and Fast-Casual Restaurants saw the largest YoY visit increases, followed by QSR – highlighting the enduring power of lower-cost, quick-serve dining options. But Full-Service Restaurants (FSR) also saw a slight segment-wide YoY visit uptick in Q1 – good news for a sector that has yet to bounce back from the one-two punch of COVID and inflation. Within each Dining category, however, some chains experienced outsize visit growth – including favorites like Dutch Bros. Coffee, Slim Chickens, In-N-Out Burger, and Texas Roadhouse.
Home Improvement
Since the shelter-in-place days of COVID – when everybody had their sourdough starter and DIY was all the rage – Home Improvement & Furnishings chains have faced a tough environment. Many deferred or abandoned home improvement projects in the wake of inflation, and elevated interest rates coupled with a sluggish housing market put a further damper on the category.
Against this backdrop, Home Improvement & Furnishings’ relatively lackluster Q1 visit performance should come as no surprise. But the narrowing of the visit gap in March – which also saw one week of positive visit growth – may serve as a promising sign for the segment. (The abrupt foot traffic drop during the week of March 25th, 2024 is likely a just reflection of Easter holiday shopping pattern.)
Home Improvement Bright Spots
Within the Home Improvement & Furnishings space, some bright spots stood out in Q1 – including Harbor Freight Tools, which saw visits increase by 10.0%, partly due to the brand’s growing store count. Tractor Supply Co., Menards, and Ace Hardware also registered visit increases.
Good Things to Come
January 2024’s stormy weather left its mark on the Q1 retail environment, especially for discretionary categories. But as the quarter progressed, retailers rallied, with healthy YoY foot traffic growth that peaked during the last week of March – the week of Easter Sunday. All in all, retail’s positive Q1 performance leaves plenty of room for optimism about what’s in store for the rest of 2024.


.svg)