


.png)
.png)

.png)
.png)

The festive season is upon us, making it the perfect time to focus on a retail category that truly shines in Q4 2024: gifting, books, and paper. Despite the digital age, consumers continue to show a strong preference for shopping for these items in-store and still value tangible versions of these products. However, as discretionary retail faces challenges in meeting consumer expectations, has this category managed to capture consumer excitement and deliver delight amidst competing distractions and purchase priorities?
The book, paper, and gift market has experienced mixed performance among retailers this year, but even those facing year-over-year traffic declines have opportunities to improve. Barnes & Noble continues to set the standard, particularly in a category that was among the first to face e-commerce disruption; compared to 2019, visits are up 7% in 2024 despite a smaller store footprint. Paper Source is down 2% year-over-year in visits but is maintaining trends consistent with 2023. Similarly, Hallmark stores have seen a 2% decline in traffic year-to-date, though this aligns with a 5% reduction in store count. Notably, The Paper Store, a Northeastern chain of Hallmark Gold Crown stores, has outperformed the broader Hallmark brand by positioning itself more as a gift-first retailer, with cards and stationery playing a secondary role.

The book, paper, and gift market has experienced mixed performance among retailers this year, but even those facing year-over-year traffic declines have opportunities to improve. Barnes & Noble continues to set the standard, particularly in a category that was among the first to face e-commerce disruption; compared to 2019, visits are up 7% in 2024 despite a smaller store footprint. Paper Source is down 2% year-over-year in visits but is maintaining trends consistent with 2023. Similarly, Hallmark stores have seen a 2% decline in traffic year-to-date, though this aligns with a 5% reduction in store count. Notably, The Paper Store, a Northeastern chain of Hallmark Gold Crown stores, has outperformed the broader Hallmark brand by positioning itself more as a gift-first retailer, with cards and stationery playing a secondary role.
Barnes & Noble's consistent and sustainable traffic growth can be attributed to several successful initiatives. The retailer has expanded its product categories, doubled down on gifting, strengthened its position as a third space, and tapped into consumers' enduring love for books—all of which have set it apart in a challenging discretionary retail landscape. The effectiveness of these efforts is reflected in the chain's dwell time, which averages 37 minutes—nearly 10 minutes longer than any of the other chains reviewed—and excels at keeping visitors in-store for over 30 minutes.

Barnes & Noble has done an impressive job of evolving its visitor demographics over time, particularly in the face of the digital revolution and the disruption of the book category. The success of specialty retailers often reflects broader cultural movements and shifts in consumer preferences, and Barnes & Noble is no exception. According to PersonaLive customer segments, the chain has significantly increased its penetration of younger consumer segments, such as Young Professionals and Young Urban Singles, when comparing 2024 year-to-date with 2019. Factors contributing to this trend could include the rise of book club culture among younger cohorts, the appeal of working from the in-store café, and an expanded assortment of gifts and paper products for special occasions.

This focus on younger consumers seems to be paying off. In 2024, 6% of Barnes & Noble visitors also shopped at a Hallmark location, although only 1% visited Paper Source, its sister brand. The integration of Paper Source shop-in-shops within Barnes & Noble locations may be cannibalizing cross-visitation between the two standalone chains.
As for Paper Source, it shares many of the elements driving Barnes & Noble's success but faces challenges in fully unlocking its potential. One key differentiator is its invitation business, but as consumers increasingly turn to digital platforms like Facebook or Paperless Post for invitations, even the booming wedding market hasn’t been enough to significantly drive growth.
A significant challenge for Paper Source comes from competition within the superstore category. This year, 87% of Paper Source visitors also shopped at Target, and 63% visited Walmart. Both retailers have invested heavily in expanding their party supplies, cards, and gifting assortments, making it more convenient for shoppers to purchase these items during a single trip, rather than visiting a separate specialty store.

Paper Source has a strong demographic foundation to build upon as it works toward stabilization. According to PersonaLive, the chain significantly outperforms Barnes & Noble in visitation percentages among Ultra Wealthy Families, Young Professionals, and Educated Urbanites, with Ultra Wealthy Families accounting for nearly a quarter of its visitors. Its frequent co-tenants reflect similar socio-economic patterns, aligning with successful specialty chains that appeal to wealthier shoppers, such as lululemon, Sephora, Anthropologie, Warby Parker, Madewell, and Apple. With these favorable dynamics in place, Paper Source has an opportunity to thrive—success may depend on effective messaging and marketing to this affluent customer base.

The differences between Hallmark stores and The Paper Store highlight contrasting strategies: one chain has successfully expanded its product offerings to capture a more engaged audience, while the other remains closely tied to the traditional paper category and has struggled to do the same. There is little overlap in visitation between the two chains, suggesting that consumers may perceive The Paper Store as entirely separate from Hallmark, despite its status as a Gold Crown retailer.
The Paper Store’s elevated and expanded assortment has fostered stronger loyalty among its visitors compared to the Hallmark chain. In 2024, loyal visitors—defined as those visiting twice per month—accounted for 12% of The Paper Store’s visitors, 2 percentage points higher than Hallmark. Additionally, The Paper Store serves more as a destination, with 37% of visitors heading home afterward, also 2 points higher than Hallmark. By expanding its product categories and curating localized selections, The Paper Store has successfully differentiated itself from the traditional Hallmark model, a strategy that could benefit the national chain as well.

The gifting, book, and paper retail category demonstrates varied consumer behavior across chains. The success of Barnes & Noble and The Paper Store underscores the importance of expanding product assortments to attract visits, as consumers increasingly seek convenience by consolidating their purchases in fewer trips. While consumers may tolerate more frequent visits for essential retail, in specialty retail, convenience and variety are critical. The category’s overall resilience suggests that consumers still have discretionary spending power for the right products at the right time, offering hope for retailers still refining their approach.

The sporting goods and sportswear category has had a rough couple of months. Two mainstays in the space – Bob’s Stores and Eastern Mountain Sports – filed for bankruptcy in June, and several sportswear and athleisure leaders posted disappointing results. So is the consumer demand for leggings and sneakers waning? Or is the category merely facing a temporary slowdown? We dove into the data to find out.
With budgets still tight, many shoppers are turning to value apparel and value athletic wear – and this trading down may be impacting the sporting goods and sportswear space: Q3 2024 visits to most sporting goods and athletic wear chains analyzed, including DICK’s Sporting Goods, Athleta, Academy Sports + Outdoor, and Hibbett Sports, remained at or moderately below 2023 levels. Still, the relatively minimal visit gaps indicate that demand for the category remains stable and may rise again with increased consumer confidence.
Meanwhile, lululemon athletica saw a 7.6% increase in YoY visits in Q3 2024 thanks to the company’s ongoing expansion.

But even as the sporting goods and sportswear category may be facing a temporary lull, diving into the demographics of the trade areas for the various retailers reveals the variety of sporting goods and sportswear consumers – showing the varied demand for the category.
The median household income within the trade areas of the five chains analyzed ranged from $54.8K for Hibbett Sports to $108.3K for Athleta. The share of households with children within the trade areas also varied among the chains: DICK’s Sporting Goods, and Academy Sports + Outdoors included significantly more households with children in their captured markets when compared with Athleta, lululemon, or Hibbett Sports.
It seems, then, that each chain appeals to a specific consumer segment – DICK’s and Academy Sports both serve families, although DICK’s attracts the higher-income households and Academy Sports draws more middle-income shoppers. Lululemon and Athleta both operate at the higher-end of the athletic wear spectrum, but Athleta shoppers tend to come from slightly more affluent areas with larger household sizes. And Hibbett has carved out a niche among lower-income consumers.

Demand for sportswear and gym gear may not be as strong as it was at the height of the pandemic when gyms were closed and consumers were doubling down on comfort. But the variety of audiences within the category leaders’ trade areas indicates that appetite for athletic wear and sporting goods is still widespread. And with Black Friday around the corner, these chains – and especially the higher-priced retailers among them – may well get a boost from price-conscious consumers looking to snag discounts at their favorite premium chains.
For more data-driven retail insights, visit placer.ai.

About the Placer 100 Index for Retail & Dining: The Placer 100 Index for Retail and Dining is a curated, dynamic list of leading chains that often serve as prime tenants for shopping centers and malls. The index includes chains from various industries, such as superstores, grocery, dollar stores, dining, apparel, and more. Among the notable chains featured are Walmart, Target, Costco, Kroger, Ulta Beauty, The Home Depot, McDonald’s, Chipotle, Crunch Fitness, and Trader Joe's. The goal of the list is to provide insight into the wider trends impacting the retail, dining and shopping center segments.
Visits to the Placer 100 Index chains grew over the summer, as the back to school season drove a 3.3% year-over-year (YoY) jump in August 2024 visits. And visits in September 2024 were essentially on par with September 2023 levels – indicating that shoppers did not stay home to make up for retail’s summer surge, which could signal an increased willingness to spend ahead of the critical Q4.
And indeed, the fourth quarter of the year started strong, with the Placer 100 Index up 1.4% YoY in October 2024 – and with consumer confidence recently hitting a 9-months-high, the upcoming holiday season looks particularly promising.

Chili’s Grill & Bar topped the Placer 100 October chart in terms of both overall and per-location visit growth. The chain is still riding the wave of its Big Smasher Burger success, which sent visits skyrocketing following the product’s launch in late April. Warby Parker also saw impressive increases in overall visits and in visits per location as the chain continued opening new stores and adding eye exam offerings to existing locations.
Aldi and Crunch Fitness also saw growth in both metrics, with the increase in overall visits outpacing the strong increase in visits per location – pointing to a successful expansion strategy.

Hobby Lobby and Wendy’s also experienced increases in both overall visits and visits per location in October, with different paths leading to the two chains’ October successes.
Hobby Lobby’s visits follow clear seasonal patterns. The chain’s traffic usually peaks in December, but traffic already begins to rise in August as parents and teachers stock up on supplies and classroom decorations. Visit growth then ramps up throughout September and October as consumers purchase Halloween-themed costumes and decorations. So far, Hobby Lobby appears to be having a particularly successful year, with visits outpacing last year’s numbers since the summer – and with the chain’s busiest season of the year coming up, Hobby Lobby is positioned to close out the year with a bang.
Wendy’s, meanwhile, demonstrated how chains can create their own growth opportunities without aligning with existing calendar-driven spending occasions. The chain introduced the Krabby Patty Kollab menu items on October 2nd to celebrate the 25th anniversary of "SpongeBob SquarePants,” which sent visits surging. And YoY traffic was still up four weeks later, revealing the potential of LTOs to drive up dining traffic even in the absence of a specific seasonal boost.

Which chains will top the Placer 100 Index in November?
Visit placer.ai to find out!

Note: This post utilizes data from Placer.ai Data Version 2.1. and thus reflects minor adjustments in data from previous reports.
Amazon, Dell, Goldman Sachs, Walmart, UPS – these are just a few of the major employers that have been cracking down on remote work in recent months, some requiring their teams to be on-site full time.
So with summer behind us, we dove into the data to assess the impact these accumulating RTO mandates are having on the ground. Are offices continuing to fill up, or has the office recovery run its course?
In October 2024, office visits nationwide were 34.0% below October 2019 levels. And looking at monthly fluctuations in office foot traffic over the past five years shows that the RTO remains in full swing – with last month’s visits reaching the highest point seen since February 2020.

Digging down into regional data shows that in several major hubs – including Atlanta, Dallas, Houston, Denver, Washington, D.C., Chicago, and San Francisco – October 2024 was the single busiest in-office month since COVID. And in Boston, Los Angeles, Miami, and New York, October was the second-busiest month, outpaced only by July.
Still, New York and Miami continued to lead the regional office recovery pack, with October 2024 visits in the two cities up to 86.2% and 82.6%, respectively, of 2019 levels. The two hubs, joined by Atlanta and Dallas, continued to outperform the nationwide average. And Houston, which lagged behind other major business hubs during the summer in the wake of major storms, reclaimed its position just under the nationwide baseline.

In October 2024, visits to office buildings in Washington D.C. increased 16.4% year over year (YoY), likely boosted by an RTO push meant to increase meaningful in-person work in federal agencies – though many government employees continue to telework. Boston, where office building occupancy is outperforming national levels, visits saw a 15.6% YoY uptick. And Atlanta, where major employers from UPS to NCR Voyix are requiring workers to show their faces five days a week, saw visits grow 13.8% YoY.
Nationwide, office foot traffic increased 10.1% YoY – showing that the return-to-office is still very much a work in progress.

Office attendance fosters creativity, mutual learning, and a sense of community – and can be critical for early-career success. But working from home at least some of the time offers greater flexibility that can improve employees’ work-life balance and in some cases, even enhance productivity. How will companies and employees continue to navigate the ongoing RTO?
Follow Placer.ai’s data-driven office recovery analyses to find out.
This blog includes data from Placer.ai Data Version 2.1, which introduces a new dynamic model that stabilizes daily fluctuations in the panel, improving accuracy and alignment with external ground truth sources.

With the holiday season just around the corner, we dove into the Placer.ai Mall Index to see how these shopping mainstays performed during the fall retail lull.
Following several months of roller-coaster visit trends – as August visits surged compared to last year and September visits dipped year-over-year (YoY) – mall traffic stabilized in October: Last month’s visits to indoor malls, open-air shopping centers, and outlet malls generally matched 2023 visitation trends. The closing of the YoY visit gaps may indicate that consumers are once again ready to spend following the brief September slow-down – boding well for the upcoming holiday season.

Diving into the weekly trends offers even further reasons for optimism: YoY visits over the last two full weeks of October were positive for all three mall categories, with outlet malls in particular seeing the largest YoY increases. Outlet malls’ positive performance during the second half of the month may signal a comeback for the format, which has generally lagged behind indoor malls and open-air shopping centers in recent months.

Unlike certain retail categories that enjoy Halloween-driven visit surges either on the day itself or on October 30th, malls do not appear to benefit from the spooky holiday. Analyzing daily visits reveals that October 30th visits were on par with the daily October average, while October 31st traffic actually took a hit across the three mall formats in the Placer.ai Mall Index.
The dip is likely due to shoppers putting off their mall trips and instead choosing superstores and specialty retailers such as party supply stores and liquor shops for their holiday prep. Stores hoping to avoid the Halloween dip may want to offer special promotions around the day – and managers can also use this information to optimize their staffing schedules on October 31st.

Diving into hourly visit distributions provides even more data for those looking to optimize store performance. On Halloween, indoor malls and open-air shopping centers received a larger share of their visits before 4:00 PM and relatively fewer visits in the evening when compared to an average Thursday in October. So while some consumers did come out to malls in the morning, by evening, many shoppers may have been too busy scrambling to complete their Halloween costume or stock up on candy for the evening. Meanwhile, the Halloween dip in visits to outlet malls appears to have been evenly spaced throughout the day, with hourly visit shares on October 31st closely matching the average Thursday visit distribution patterns.
Store managers operating in indoor malls or open-air shopping centers may use this data to optimize staffing for the afternoon and evening Halloween shifts, while those working at outlet malls may want to reconsider their manpower needs for the day as a whole. At the same time, those looking to draw in more foot traffic may try offering promotions that appeal to early birds or trick-or-treaters.

With October in the rearview mirror, the holiday season is kicking off. How will malls perform?
Visit placer.ai to find out.

As essential sectors of retail face a slowdown in traffic momentum, the need for unique offerings and competitive advantages is more pressing than ever. Grocery retailers have benefited from increased visits, which has kept consumers engaged with chains and their offerings, even if it hasn’t always translated into larger basket sizes. In an increasingly competitive grocery market, retailers will need to consistently prove to consumers that they’re worth the extra visit.
Specialty grocers are better positioned to meet this challenge as value-focused grocery options become more constrained. Many local and regional chains have the added benefit of nimble operating models, enabling them to quickly adapt to consumer preferences. Beyond that, these specialty chains have deeply embedded themselves in the communities they serve. Looking ahead to 2025 and the growing recognition of physical stores’ importance, the strong relationships between specialty grocery retailers and consumers could help them thrive in this evolving environment.
One specialty chain that stands out in this context is Stew Leonard’s. Beloved in the Tri-State area—an area known for outstanding grocery chains—Stew Leonard’s combines product expertise with a unique in-store experience, famously described by The New York Times as “the Disneyland of Dairy Stores.” Imagine a grocery store with animatronics and birthday parties! In an era when we need more joy in retail, Stew Leonard’s sets the gold standard. With just eight locations, each with a large footprint and a strong connection to its local community, Stew Leonard’s offers a compelling package. A robust private label program, specialty departments, and high service levels make this chain stand out without relying on promotions or low prices.

According to Placer’s foot traffic estimates, Stew Leonard’s has effectively hedged against the slowdown in growth seen by other full-price grocery chains this year. Year-to-date, the chain has experienced a 3% year-over-year increase, compared to flat growth for full-price chains. Examining trends over time, Stew Leonard’s has shown consistent, sustainable growth throughout 2022 and 2023, with an acceleration in visits in the latter half of this year, driven by the opening of its new store in Clifton, NJ.
One reason for Stew Leonard’s success is the elasticity of its consumer base. Operating in the Tri-State area allows the chain to tap into wealthier consumer segments compared to national chains. According to PersonaLive audience segmentation, Stew Leonard’s has more than double the concentration of Ultra Wealthy Families compared to full-price grocery chains, along with a high percentage of Wealthy Suburban Families. The chain also attracts a notable share of Young Urban Singles, likely drawn by its strong offerings in prepared and specialty foods.

Stew Leonard’s Danbury, CT location offers insight into the brand’s appeal to shoppers. According to Placer’s trade area metrics, 35% of visitors to this store travel from more than 10 miles away, and nearly 10% come from over 30 miles, with clusters of visits from across the Northeastern corridor.

Store-level metrics also reveal strong loyalty among Stew Leonard’s visitors. Year-to-date in 2024, over a quarter of visitors to the Danbury location visited at least four times, and 35% visited three or more times. At the same time, there is a substantial share of visitors who appear to make special, less frequent trips to the store. These visitors show high cross-visitation rates with other grocers, such as Costco and ShopRite, as well as with Stew Leonard’s own operated Wine and Spirits locations.
Stew Leonard’s exemplifies a retailer that resonates with local consumers while offering an experience that attracts visitors from further away. Its combination of unique experiences, services, and products creates a shopping experience that goes well beyond traditional retail. Even as visits slow down across the sector, specialty grocers that remain hyper-focused on their unique offerings are likely to continue drawing in customers.

The Placer.ai Nationwide Office Building Index: The office building index analyzes foot traffic data from some 1,000 office buildings across the country. It only includes commercial office buildings, and commercial office buildings with retail offerings on the first floor (like an office building that might include a national coffee chain on the ground floor). It does NOT include mixed-use buildings that are both residential and commercial.
This white paper includes data from Placer.ai Data Version 2.0, which implements improvements to our extrapolation capabilities, adds short visit monitoring, and enhances visit detection.
The remote work war is far from over – and as the labor market cools, companies are ramping up efforts to get workers back in the office. But even those employers that are cracking down on WFH aren’t generally insisting that employees come in five days a week – for the most part.
Indeed, a growing consensus seems to posit that though in-person work carries important benefits, plugging in remotely at least part of the time also has its upsides. Nixing the daily commute can put the ever-elusive work/life balance within reach. And there’s evidence to suggest that remote work can enhance productivity – limiting distractions and letting workers lean into their individual biological clocks (so-called “chronoworking”).
But the precise contours of the new hybrid status-quo are still a work in progress. And to keep up, relevant stakeholders – from employers and workers to municipalities and local businesses – need to keep their fingers on the pulse of how this fast-changing reality is evolving on the ground.
This white paper dives into the data to explore some of the key trends shaping the office recovery. The analysis is based on Placer.ai’s Nationwide Office Index, which examines foot traffic data from more than 1,000 office buildings across the country. What was the trajectory of the post-COVID office recovery in 2023? What impact did return-to-office (RTO) mandates have on major cities nationwide, including New York, Dallas, San Francisco, and others? And how has the demographic and psychographic profile of office-goers changed since the pandemic?
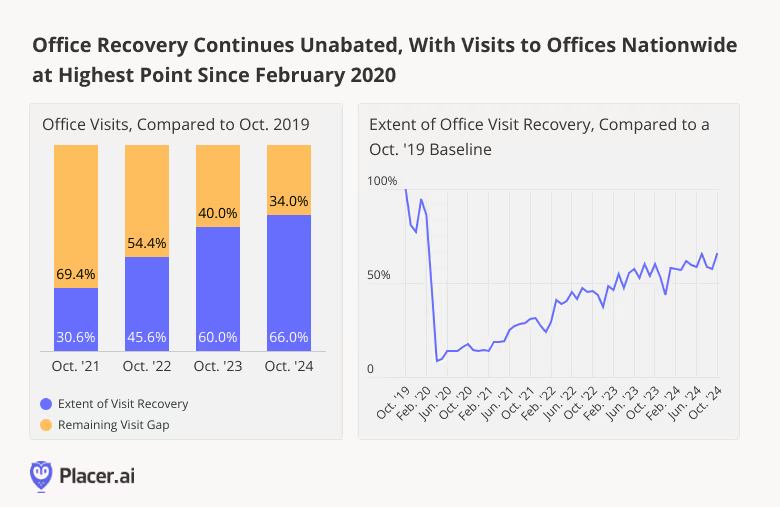
Analyzing office building foot traffic over the past several years suggests that the office recovery story is still very much being written. After plummeting during COVID, nationwide office visits began a slow but steady upward climb in 2021, reaching about 70.0% of January 2019 levels in August 2023.
Since then, the recovery appears to have stalled – with some observers even proclaiming the death of RTO. But looking back at the office visit trajectory since 2019 shows that the process has been anything but linear, with plenty of jumps, dips, and plateaus along the way. And though office foot traffic tapered somewhat between November 2023 and January 2024, this may be a reflection of holiday work patterns and of January’s unusually cold and stormy weather, rather than of any true reversal of RTO gains. Indeed, if 2024 is anything like last year, office visits may yet experience an additional boost as the year wears on.
TGIF Vibes
But for now, at least, a full return to pre-COVID work norms doesn’t appear to be in the cards. And like in 2022, last year’s hybrid work week gave off some serious TGIF vibes.
On Tuesdays, Wednesdays, and Thursdays, office foot traffic was just 33.2% to 35.3% lower than it was pre-COVID. But on Mondays and Fridays, visits were down a whopping 46.0% and 48.9%, respectively. From a Year-over-year (YoY) perspective too, the middle of the week experienced the most pronounced visit recovery, with Tuesday, Wednesday, and Thursday visits up about 27.0% compared to 2022.
The slower Monday and Friday office recovery may be driven in part by workers seeking to leverage the flexibility of WFH for extended weekend trips. (Indeed, hybrid work even gave rise to a new form of nuptials – the remote-work wedding.) So-called super commuters, many of whom decamped to more remote locales during COVID, may also prefer to concentrate visits mid-week to limit time on the road. And let’s face it – few people would object to easing in and out of the weekend by working in their pajamas. Whatever the motivating factors – and despite employer pushback – the TGIF work week appears poised to remain a fixture of the post-pandemic working world.
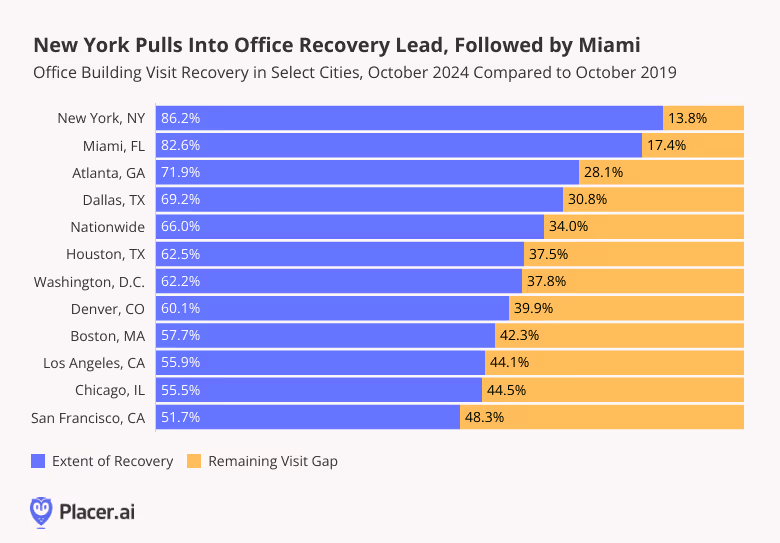
Analyzing nationwide office visitation patterns can shed important light on evolving work and commuting norms. But to really understand the dynamics of office recovery, it is crucial to zoom in on local trends. RTO in tech-heavy San Francisco doesn’t look the same as it does in New York’s financial districts. And commutes in Dallas are very different than in Chicago or Washington, D.C.
Overall, foot traffic to buildings in Placer.ai’s Nationwide Office Index was down 36.8% in 2023 compared to 2019 – and up 23.6% compared to 2022. But drilling down into the data for seven major markets shows that each one experienced a very different recovery trajectory.
In New York and Miami, offices drew just 22.5% and 21.9% less visits, respectively, in 2023 than in 2019 – meaning that they recovered nearly 80.0% of their pre-COVID foot traffic. In New York, remote work policy shifts by major employers like Goldman Sachs and JPMorgan appear to have helped set a new tone for the financial sector. And Miami may have benefited from Florida’s early lifting of COVID restrictions in late 2020, as well as from the steady influx of tech companies over the past several years.
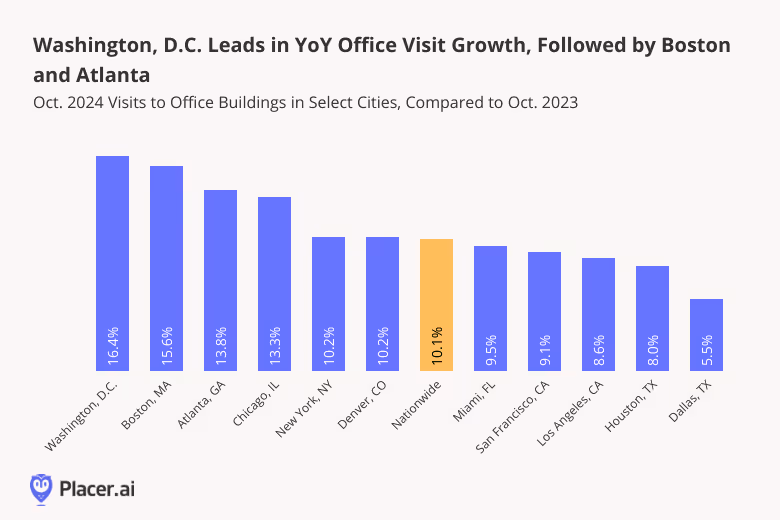
San Francisco, for its part, continued to lag behind the other major cities in 2023, with office building foot traffic still 55.1% below 2019 levels. But on a YoY basis, the northern California hub experienced the greatest visit growth of any analyzed city, indicating that San Francisco’s office recovery is still unfolding.
To better understand the relationship between employees’ occupational backgrounds and local office recovery trends, we examined the share of Financial, Insurance, and Real Estate sector workers in the captured markets of different cities’ office buildings. (A POI’s captured market is derived by weighting the census block groups (CBGs) in its True Trade Area according to the share of actual visits from each CBG – thus providing a snapshot of the people that actually visit the POI in practice). We then compared this metric to each city’s year-over-four-year (Yo4Y) office visit gap.
The analysis suggests that the finance sector has indeed been an important driver of office recovery. Generally speaking, cities with greater shares of employees from this sector tended to experience greater office recovery than other urban centers. And for New York City in particular, the dominance of the finance industry may go some way towards explaining the city’s emergence as an RTO leader.
Regional differences notwithstanding, office foot traffic has yet to rebound to pre-COVID levels in any major U.S. market. But counting visits only tells part of the RTO story. Stakeholders seeking to adapt to the new normal also need to understand the evolving characteristics of the in-office crowd. Are office-goers more or less affluent than they were four years ago? And is there a difference in the employee age breakdown?
To explore the evolution of the demographic and psychographic attributes of office-goers since COVID, we analyzed the captured markets of buildings included in the Placer.ai Office Indexes with data from STI (Popstats) and Spatial.ai (PersonaLive). And strikingly, despite stubborn Yo4Y office visit gaps, the profiles of last year’s office visitors largely resembled what they were before COVID – with some marked shifts. This may serve as a further indication that 2023 brought us closer to an emerging new normal.
The median household income (HHI) of the Office Indexes fell during COVID. But by 2022, the median HHI in the trade areas of the Office Indexes was climbing back nationwide in all cities analyzed, and fell just 0.6% short of 2019 levels in 2023. And in some cities, including San Francisco and Dallas, the median HHI of office-goers is higher now than it was pre-pandemic.
Better-paid, and more experienced employees often have more access to remote and hybrid work opportunities – and at the height of the pandemic, it was these workers that disproportionately stayed home. But as COVID receded, many of them came back to the office. Now, even if high-income workers – like many other employees – are coming in less frequently, their share of office visitors has very nearly bounced back to what it was before COVID.
Who are the affluent employees driving the median HHI back up? Foot traffic data suggests that much of the HHI rebound may be fueled by “Educated Urbanites” – a segment defined by Spatial.ai PersonaLive as affluent, educated singles between the ages of 24 and 35 living in urban areas.
For younger employees in particular, fully remote work can come at a significant cost. A lot of learning takes place at the water cooler – and informal interactions with more experienced colleagues can be critical for professional development. Out of sight can also equal out of mind, making it more difficult for younger workers that don’t develop personal bonds with their co-workers and to potentially take other steps to advance their careers.
Analyzing the trade areas of offices across major markets shows that – while parents were somewhat less likely to visit office buildings in 2023 than in 2019 – affluent young professionals are making in-person attendance a priority. Indeed, in 2023, the share of “Educated Urbanites” in offices’ captured markets exceeded pre-COVID levels in most analyzed cities – although the share of this segment still varied between regions, as did the magnitude of the shift over time.
Miami and Dallas, both of which feature relatively small shares of this demographic, saw more dramatic increases relative to their 2019 baselines – but smaller jumps in absolute terms. On the other end of the spectrum lay San Francisco, where the share of “Educated Urbanites” jumped from 47.8% in 2019 to a remarkable 50.0% in 2023. New York office buildings, for their parts, saw the share of this segment rise from 28.8% in 2019 to 31.0% in 2023.
Other segments’ RTO patterns seem a little more mixed. The share of “Ultra Wealthy Families” – a segment consisting of affluent Gen Xers between the ages of 45 and 54 – is still slightly below pre-COVID levels on a nationwide basis. In 2023, this segment made up 13.0% of the Nationwide Office Index’s captured market – down slightly from 13.3% in 2019. In New York and San Francisco, for example – both of which saw the share of “Educated Urbanites” exceed pre-COVID levels last year – the share of “Ultra Wealthy Families” remained lower in 2023 than in 2019. At the same time, some cities’ Office Indexes, such as Miami, Dallas, and Los Angeles, have seen the share of this segment grow Yo4Y.
Workers belonging to this demographic tend to be more established in their careers, and may be less likely to be caring for small children. Well-to-do Gen Xers may also be more likely to be executives, called back to the office to lead by example. But employees belonging to this segment may consider the return to in-person work to be a choice rather than a necessity, which could explain this cohort’s more varied pace of RTO.
COVID supercharged the WFH revolution, upending traditional commuting patterns and offering employees and companies alike a taste of the advantages of a more flexible approach to work. But as employers and workers seek to negotiate the right balance between at-home and in-person work, the office landscape remains very much in flux. And by keeping abreast of nationwide and regional foot traffic trends – as well as the shifting demographic and psychographic characteristics of today’s office-goers – stakeholders can adapt to this fast-changing reality.

Last year ended on a high note for many retailers, with cooling inflation and rebounding consumer confidence contributing to a robust holiday season. Still, 2023 was a year of headwinds for the sector, as consumers traded down and cut back on unnecessary indulgences.
In the midst of these challenges, some segments thrived. Continued prioritization of health and wellness by consumers drove strong visit growth for the Fitness and Beauty & Self Care segments – which emerged as 2023 winners and enjoyed positive foot traffic growth in Q4. At the same time, price consciousness drove foot traffic to Discount & Dollar Stores and Superstores, both of which made inroads into the affordable grocery space during the year.
The Grocery category, too, saw a 4.3% jump in visits last year compared to 2022, as well as a slight uptick in Q4 visits. And even the discretionary Dining sector held its own, with a 2.1% year-over-year (YoY) annual increase in foot traffic, and a Q4 quarterly visit gap of just 1.8%.
Fitness had a particularly strong 2023, buoyed by consumers’ sustained interest in self-care and wellness. Since the pandemic, gym memberships have graduated from a discretionary expense to something of a necessity – an important investment in health and wellbeing. The category has also likely continued to benefit from the post-COVID craving for experiences.
And quarterly data shows that the Fitness segment is positively flourishing. Throughout most of Q4 2023, Fitness venues experienced YoY weekly visit growth ranging from 8.8% to 12.2%. (The unusual visit spike and dip during the last two weeks of the quarter are due to calendar discrepancies: The week of December 18th, 2023 is being compared to the week of December 19th, 2022, which included Christmas Day – while the week of December 25th, 2023 is being compared to the week of December 26th, 2022, which did not).
Drilling down into the data for several leading fitness chains shows that there’s plenty of success to go around. Crunch Fitness – ranked by Entrepreneur as 2024’s top fitness franchise – led the pack with a remarkable 28.2% YoY annual increase in visits, partly fueled by the steady expansion of its fleet. And while other value gyms like Planet Fitness also saw robust visit growth, the boost wasn’t limited to budget options. Given the Fitness sector’s already-impressive 2022 performance, the category’s strong YoY showing is especially noteworthy.
Beauty & Self Care was another category to benefit from 2023’s obsession with wellness – as well as the “lipstick effect”, which sees consumers treating themselves to fun, affordable luxuries when money’s tight. Driven in part by the evolving preferences of Gen Z consumers, cosmetics leaders have embraced wellness-focused approaches to cosmetics that prioritize self-care and self-expression. This strategy continues to prove successful: Throughout Q4 2023, Beauty & Self Care chains saw steady YoY weekly visit growth, especially in November and early December – perhaps highlighting Beauty’s growing role in the holiday shopping frenzy.
One brand leading the cosmetics pack in 2023 was Ulta Beauty – which drew growing crowds with its diverse product selection. Everybody loves makeup, and Ulta makes sure to have something for everyone – from discount fare to more upscale products. Buff City Soap, which now pairs its signature offerings with experiential vibes at some 270 locations across 33 states, also experienced YoY annual visit growth of 14.7%. And Bath & Body Works, which made the Wall Street Journal’s list of best-managed companies for 2023, also saw visit strength, with an overall increase in annual foot traffic, even as Q4 visits saw a slight decline.
If wellness was a key retail buzzword in 2023, value was an equally discussed topic. And Discount & Dollar Stores – ideal destinations for cash-strapped consumers seeking bargain merchandise – made the most of this opportunity. Shoppers frequented these chains year-round for everything from groceries to home goods, propelling the category firmly into the mainstream.
And in Q4 2023, shoppers flocked to discount chains in droves to snag food items, stocking stuffers, and other holiday fare – fueling near-uniform positive YoY foot traffic growth throughout the quarter. The week of October 30th seems to have kicked off the Discount & Dollar holiday shopping season, perhaps showcasing the segment’s growing role as a Halloween candy and costume hotspot.
Every discount chain is somewhat different – and the success of the various Discount & Dollar chains can be attributed to a range of factors. Dollar Tree and Dollar General likely benefited from the broadening and diversification of their grocery selections – while Ollie’s (“Get Good Stuff Cheap!”) solidified its position as a place to find relatively upscale items at a bargain. All three chains – and particularly Dollar General and Ollie’s – also grew their footprints over the past year. Family Dollar (also owned by Dollar Tree) also came out ahead on an annual basis – despite the comparison to a strong 2022.
Of all the Discount & Dollar chains, Five Below saw the biggest surge in foot traffic, partly as a result of its increasing store count. But the retailer’s offerings – affordable toys, party supplies, and other fun splurges – also appear to have been tailor-made for 2023’s retail vibe.
During the fourth quarter of the year, Superstores saw a slight YoY increase in visits – including during the all-important week of Black Friday, beginning on November 20th. (This week was compared with the week of November 21st, 2022, which also included Black Friday). Like Discount & Dollar chains, Superstores saw an appreciable YoY visit uptick during the week of Halloween.
On an annual basis, Superstore mainstays Walmart and Target experienced visit increases of 2.8% and 4.7%, respectively. But while all the major category players enjoyed a successful year, membership warehouse chains’ YoY visit numbers were especially strong. As perfect venues for mission-driven shopping expeditions, Costco, Sam’s Club, and BJ’s likely drew shoppers eager to load up on both inexpensive gifts and essentials.
The traditional Grocery sector also held its own during Q4 2023. Notably, grocery stores saw positive visit growth for most weeks of November and December, a period encompassing the critical Turkey Wednesday milestone – no small feat given the disruptions experienced by the category.
Unsurprisingly, it was discount grocery chains that saw some of the greatest YoY visit growth, as shoppers – including higher-income segments – sought to counter inflation with lower-priced food-at-home alternatives. Whether through opportunistic buying models, private label merchandising, or no-frills customer experiences, value supermarkets proved once again that even quality specialty items don’t have to carry high price tags.
Eating out can be expensive – and when money’s tight, restaurants and other discretionary categories are often first to feel the crunch. But the Dining category seems to have emerged from 2023 relatively unscathed, with overall yearly visits up 2.1% compared to 2022 despite the modest YoY weekly visit gaps in Q4 2023. And given the myriad challenges out-of-home eateries had to contend with in 2023 – from inflation to labor shortages – even the minor weekly gaps are quite an attainment. (As noted, the last two weeks of the quarter reflect calendar discrepancies).
Foot traffic data shows that dining success could be found across sub-categories. Wingstop, Shake Shack, and Jersey Mike’s Subs rocked Fast Casual and QSR, with annual YoY visit growth ranging from 11.8% to 20.3%, partly fueled by the chains’ growing footprints. Full-Service Restaurants also had their bright spots, including all-you-can-eat buffet star Golden Corral and two steak venues: Texas Roadhouse and LongHorn Steakhouse.
And in the Coffee, Breakfast, and Bakeries space, Playa Bowls led the charge. The superfruit bowl chain’s affordable, wellness-oriented treats seem to have been created with 2023 in mind – and during the year Playa Bowls expanded its fleet while also seeing double-digit increases in comparable store sales. Steadily expanding Biggby Coffee and Dutch Bros. Coffee also saw significant YoY foot traffic growth.

New year, new retail opportunities. And though 2023 is firmly in the rearview mirror, the economic headwinds that characterized much of the year have yet to fully dissipate. But every challenge also brings with it new opportunities, and many retailers are adapting to meet their customers' changing wants and needs.
This white paper analyzes location intelligence for 10 brands poised to succeed in 2024. Some, like low-cost apparel and home furnishing stores, are benefitting from consumer trade-down. Others are expanding into rural or suburban areas to meet customers where they are. Read on for some of 2024’s retail winners.
Until around four years ago, New Balance sneakers were commonly seen on the feet of suburban dads – not exactly a recipe for high fashion. But all that began to change in 2019 when the company began collaborating with Teddy Santis, who eventually became New Balance’s creative director. Since then, the brand’s popularity has surged among Gen Z and X and is now one of the fastest-growing sneaker companies in the industry, despite the increasing competition in sneaker space. In 2023, foot traffic to New Balance stores grew 3.3% year-over-year (YoY) and the brand has firmly established itself as ultimate retro cool.
Diving into the demographics of New Balance stores’ captured market trade area reveals the success of the chain’s rebranding. In 2023, New Balance’s trade area included larger shares of “Ultra Wealthy Families,” “Young Professionals,” and “Educated Urbanites” than the average shoe store’s trade area – highlighting New Balance’s successful reinvention as a brand for the young and hip.
The home improvement space is dominated by Lowe’s and Home Depot – but Harbor Freight Tools is quickly making a name for itself as a go-to destination for affordable tools and supplies.
Over the past few years, Harbor Freight Tools has expanded rapidly, with many of its new stores opening in smaller towns and cities. And the expansion appears to be paying off, with visits up YoY during every month of 2023. And although the chain is now operating with a significantly larger store fleet, the average number of visits per venue has generally increased – indicating that the company is expanding into markets where it is meeting a ready demand.
Over a decade after Mackelmore dropped his smash hit “Thrift Shop” in 2012, second-hand stores are still enjoying their time in the limelight. Shoppers, driven by a desire to reduce waste, find unique styles, and to save a few dollars at the till, continue to flock to thrift stores. And Winmark Corporation, which operates five secondhand goods chains – including apparel brands Plato’s Closet (young adult clothes), Once Upon a Child (children's clothes and toys), and Style Encore (women's clothing) – has benefited from the strong demand. Visits to the three Winmark clothing banners increased an average of 5.3% YoY in 2023.
The median household income (HHI) in the trade areas of Winmark’s apparel chains tends to be lower than the median HHI in the wider apparel category – so budget-conscious consumers are driving at least some of the company’s growth. With more consumers looking for ways to cut back on spending in 2024, the demand for second-hand clothes is expected to grow even further – and Winmark is likely to continue reaping the benefits.
HomeGoods, a treasure hunter's dream, is the discount home furnishing retailer owned by off-price retail giant TJX Companies. The chain, which operates over 900 brick-and-mortar stores, recently closed its e-commerce platform to focus on its physical locations – where foot traffic grew 6.0% between 2023 and 2022.
HomeGoods carries kitchen and home decor items along with furniture, and may be benefiting from the relative strength of the houseware segment, driven in part by an increase in at-home entertainment. And in a surprising twist, this low-cost retailer attracts more affluent visitors than visitors to the home furnishing segment overall. The median household income (HHI) in HomeGoods’ trade area stood at $84.7K/year compared to a $78.5K median HHI in the trade area of the average home furnishing chain. As economic uncertainty and the resumption of student loan payments impact consumers, wealthier shoppers seeking a budget-friendly home refresh are likely to continue choosing HomeGoods over pricier alternatives.
Florida-based Bealls, Inc., which got its start as a small town five-and-dime in 1915 in Bradenton, Florida, now operates over 600 stores across the country. The company, which saw an impressive 9.0% YoY increase in visits in 2023, recently consolidated its two largest banners – Burkes Outlet and Bealls Outlet – under the Bealls name.
One reason for Bealls’ success could be its appeal to rural consumers. Over the past five years, the share of households falling into Spatial.ai: PersonaLive’s “Rural Average Income” segment has steadily increased, growing from 12.6% in 2019 to 15.1% in 2023. With rural shoppers continuing to command ever-more attention from retailers, the increase in visits from this segment bodes well for Bealls in 2024.
Ollie’s Bargain Outlet was built for this economy. The chain saw a 13.0% YoY increase in visits in 2023, thanks in part to its popularity among a wide array of budget-conscious consumers. Ollie’s has found success with rural shoppers while maintaining its appeal among value-oriented suburban segments – and the chain’s diverse audience base seems to be setting it apart from other discount retailers.
A closer look at the chain’s captured market data, layered with the Spatial.ai: Personalive dataset, reveals that Ollie’s trade area includes larger shares of the “Blue Collar Suburbs” and “Suburban Boomer” segments when compared to the wider Discount & Dollar Stores category. As the chain plots its expansion, focusing on suburban and rural areas may help Ollie’s meet its customers where they are.
Trader Joe’s has managed to do what few stores can. The company does not invest in marketing, has no online shopping options, and loyalty programs? Forget about it. But despite this unusual approach to running a business, the California native has enjoyed consistent success over the years, with a 12.4% YoY increase in visits in 2023.
Trader Joe’s is particularly popular among younger shoppers, perhaps thanks to the company’s focus on sustainability and social responsibility – as well as its famously low prices. Analyzing the chain’s trade area using the AGS: Panorama dataset reveals that Trader Joe’s attracts more “Emerging Leaders” and “Young Coastal Technocrats” (segments that describe highly educated young professionals) than the average grocery chain. With Gen Z particularly concerned about putting their money where their mouth is, Trader Joe’s is likely to sustain its momentum in 2024 and beyond.
Convenience stores are growing up and evolving into bona-fide dining destinations. And Foxtrot, a Chicago-based chain with 29 stores across Texas, Illinois, Washington, Maryland, and Virginia, is one c-store redefining what a convenience store can be. The chain, which announced a merger with Dom’s Kitchen in November 2023, offers an upscale convenience store experience and is particularly known for including local brands in its product assortment as well as its excellent wine curation and dining options.
Visitors to the chain were significantly more likely to fall into AGS: Behavior & Attitudes dataset’s “Wine Drinker” or “Nutritionally Aware” segments than visitors to nearby convenience stores. The company plans to ramp up store openings, particularly in the suburbs, where convenience and a good bottle of wine might just find the perfect home as a welcome distraction from the daily grind.
Jersey Mike’s is one of the fastest-growing franchise dining chains in the country, operating over 2,500 locations in all 50 states. The sandwich chain has seen its popularity take off over the past few years, with 2023 visits up 14.1% YoY and plans to open 350 new stores in 2024.
The company has long prioritized affluent class suburban customers – and visitation data layered with the Experian: Mosaic dataset reveals that Jersey Mike’s has indeed succeeded in attracting this audience. The percentage of “Booming with Confidence” and “Flourishing Families” (both affluent segments) in Jersey Mike’s trade area was larger than in the trade areas of the average sub sandwich chain. As Jersey Mike’s continues its expansion, focusing on suburban areas may continue to serve the chain well.
The East Coast may not be the first region that pops to mind when thinking about tropical smoothies – but New Jersey-based Playa Bowls is making it work. The company was founded by avid surf enthusiasts determined to bring the flavors of their favorite surfing towns stateside.
Playa Bowls has enjoyed strong visit numbers in 2023, with overall visits up 23.0% and average visits per venue up 17.1% YoY – and part of the chain’s success may be driven by its ability to draw wealthier customers to its stores. The Experian: Mosaic dataset reveals that the “Power Elite” segment is overrepresented in the company’s trade areas: The share of households falling into that segment from Playa Bowl’s captured market exceeded their share in the company’s potential market. As the chain continues expanding its domestic footprint, it seems to have found its niche among a wealthy customer base.
The past year saw a wide range of challenges facing brick-and-mortar retailers as economic fears continued to shake consumer confidence. But there are plenty of bright spots as the new year gets underway. These ten brands prove that the retail world never stands still, and that the next opportunity is just around the corner.
