.png)
.png)

.png)
.png)


Events are foundational to New Orleans’ identity and economic model. From the Sugar Bowl to Jazz Fest and Mardi Gras, to conferences, conventions, exhibitions and meetings of all sizes, the city operates on a year-round cycle of large-scale gatherings that drive consistent visitor inflows. Over the past 12 months, 64.6% of weekend visitors to New Orleans’ downtown, including the French Quarter, Central Business District (CBD), and Arts District, were domestic tourists coming from more than 250 miles away. And as travel behavior continues to evolve post-COVID – making it more difficult to predict attendance patterns from prior-year trends – the complexity of hosting at scale requires increasingly sophisticated, data-driven operational coordination.
Perhaps no event demonstrates this model – and this need – more clearly than Mardi Gras. Running from January 6th through Mardi Gras Day, the carnival season culminates in a surge of parades and celebrations that bring major crowds downtown (French Quarter, CBD, Arts District) and all along the uptown parade route.
Crucially, many of those visitors come from within Louisiana, making the festival a powerful vehicle for strengthening ties between the city and surrounding communities: During the final 12 days of Mardi Gras 2026, 54.2% of them came from within Louisiana, compared to 23.5% during the rest of the year.
And despite an uncertain macroeconomic environment, Mardi Gras’ audience continues to expand. From the Krewe of Cleopatra on February 6 through Mardi Gras Day on February 17, out-of-market visits to downtown New Orleans (French Quarter, CBD, Arts District) increased 10% year over year, reaching their highest level since 2020.
Data also shows that Mardi Gras draws a surprisingly diverse audience. To be sure, young revelers are a big part of the story – on Mardi Gras Day, the French Quarter sees an influx of “Contemporary Households”, a young-skewing segment that includes singles, couples without children, and non-family households. The median household income of the Quarter’s trade area also declines on the big day, as students and early-career professionals crowd into the neighborhood to party.
But some of the season's more family-friendly parades – like the Krewe of Bacchus which took place this year on Sunday, February 15th – have a decidedly different vibe.
On the day of the parade, families gather early along St. Charles Avenue, setting up tents and picnic tables and sharing traditional local food ahead of the evening procession. And surrounding neighborhoods such as the Garden District experience a measurable rise in affluent family segments and median household income, highlighting Mardi Gras’ broad and diverse appeal.
Of course, managing an event of this magnitude requires coordination across agencies, stakeholders, and neighborhoods. And in a post-pandemic environment where past attendance patterns cannot always serve as reliable benchmarks, data has become a critical tool for decision-making.
Audience insights now play a central role in operational planning – identifying where visitors congregate, estimating crowd volumes, and informing preparation by law enforcement, city officials, and other city stakeholders. When large gatherings are anticipated in specific corridors or blocks, recent visitation trends provide actionable context that helps partners allocate resources efficiently and prepare accordingly.
Few cities are as synonymous with celebration as New Orleans. And by combining tradition, diversity, and data-driven operational precision, the city has built the capacity to host complex, high-volume gatherings with consistency and coordination year after year.
.avif)
With roughly one in eight Americans now using GLP-1 medications for weight loss, their rapid adoption is shaping up to be one of the most consequential behavioral shifts in recent memory – with wide-ranging implications for businesses tied to how people spend their time and money.
We analyzed the data to understand how GLP-1 usage may be influencing real-world retail and dining foot traffic. How is grocery store visitation changing? What’s happening in limited-service dining? And which other categories are gaining from a heightened focus on health and wellness – further accelerating trends that began to take hold after the pandemic?
Research from Cornell University shows that GLP-1 users reduce household grocery spending by an average of 5.3% within six months of starting a medication, with the most significant pullbacks concentrated in calorie-dense, processed categories. At the same time, a handful of health-oriented foods – including yogurt, fresh fruit, nutrition bars, and meat snacks – are seeing increased spend.
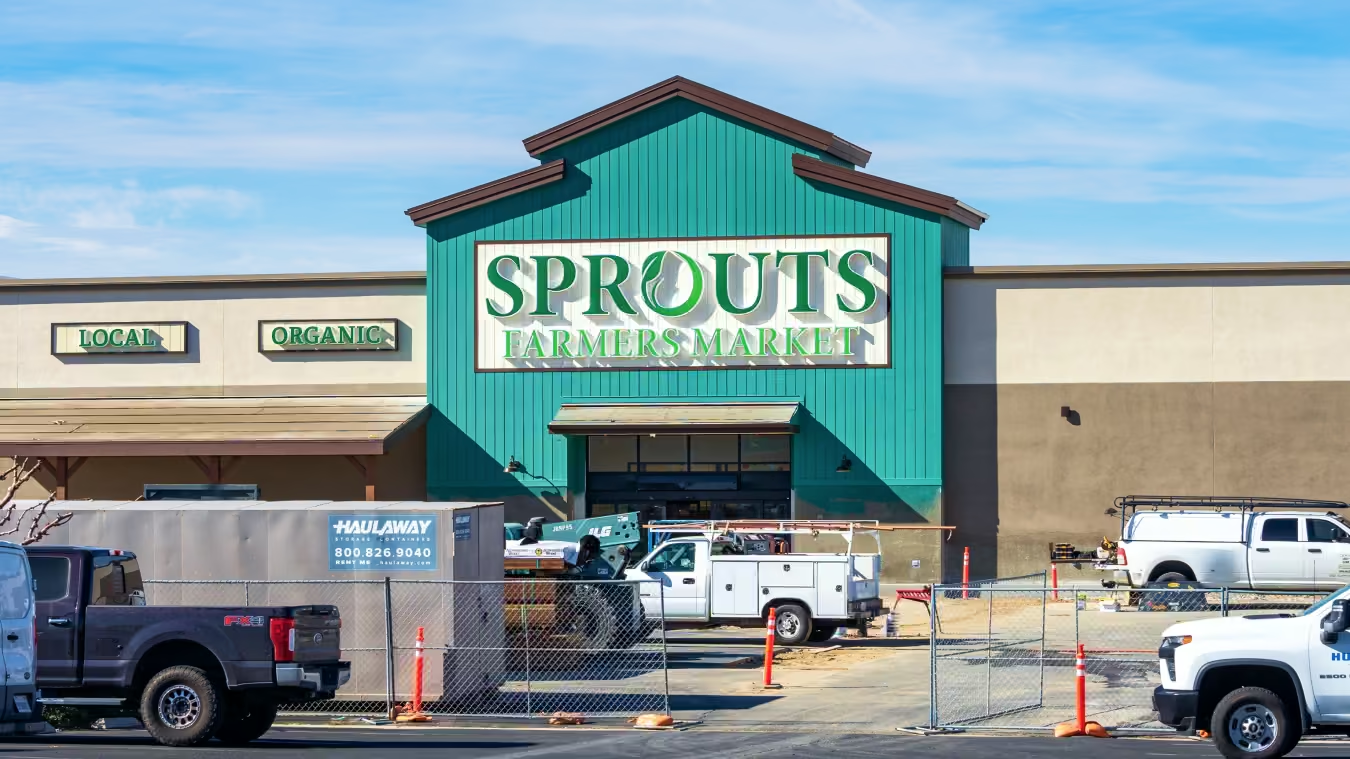
And foot traffic data points to a parallel shift in where consumers are shopping, with a growing share of grocery visits flowing toward fresh-format stores like Trader Joe’s and Sprouts Farmers Market that emphasize high-quality perishables, curated health-oriented assortments, and an elevated in-store experience. While this pivot has been underway for several years, reflecting a broader post-pandemic focus on health and wellness, its recent acceleration coincides with the rise in GLP-1 use.
From Q1 2022 to Q1 2026, these chains steadily expanded their share of overall grocery foot traffic, with momentum accelerating beginning in Q1 2024, even as some experienced per-store softness amid a challenging consumer environment. Over the same period, the median household income within fresh-format chains’ captured markets, which had remained largely stable through early 2024, began to decline. This trend suggests a broadening customer base, as households across income brackets increasingly prioritize higher-quality food and allocate a larger share of their grocery trips to fresh formats.
The reallocation of spending also extends beyond the grocery aisle. Foot traffic data points to a meaningful reordering of food-away-from-home visits over the past three years, with healthier dining segments outperforming more indulgent ones – underscoring a broader shift toward more nutritious options that GLP-1 adoption may be helping to reinforce.
Frozen yogurt chains outpaced ice cream shops in year-over-year visit growth in both 2024 and 2025, as consumers gravitated toward lighter frozen treats. Smoothie and juice chains also captured growing demand, buoyed by expanding footprints from brands like Tropical Smoothie Cafe, Smoothie King, and Playa Bowls, while fast-casual similarly pulled ahead of QSR.
Fitness participation has been on the rise since the pandemic, and the data suggests gym habits are becoming more consistent over time – a trend that GLP-1 users, who often incorporate structured exercise into their routines, may be helping to reinforce.
Between Q1 2023 and Q1 2026, the share of visitors to leading gyms stopping by at least three times in an average month rose from 44.8% to 46.8%, while the share visiting at least four times rose from 37.3% to 39.1%. For a growing segment of the population, going to the gym has become a regular part of the weekly routine – with implications for fitness brands and the broader ecosystem of health-oriented businesses competing for this newly routine-driven consumer.
As consumers deepen their focus on health and fitness, the body transformations associated with GLP-1 use are also reshaping apparel demand. Alongside a growing need for wardrobe replenishment, GLP-1 users are investing more in their appearance and rediscovering the experience of shopping for clothes.
And this trend aligns with recent foot traffic data. Even as discretionary spending continues to face headwinds in a challenging macroeconomic environment, clothing retailers are seeing consistent year-over-year visit growth, driven in large part by the off-price sector – with each year outpacing the broader discretionary retail category by a widening margin. Apparel is pulling away from the pack, likely driven in part by a consumer whose relationship with their body – and with shopping – has fundamentally changed.
The GLP-1 era is still in its early stages – but as programs like Amazon’s new GLP-1 management program expand access, these drugs are likely to continue reshaping shopping behavior in the months and years ahead. The data points to a consumer who is eating differently, moving more, and spending in ways that reflect a new set of priorities, further amplifying the focus on health and wellness that has emerged over the past several years.
For more data-driven retail and dining insights, visit Placer.ai/anchor.

Sprouts Farmers Market entered 2026 expecting a challenging quarter – and Q1 foot traffic trends bore that out. Against a Q1 2025 comparison where comps surged 11.7% year over year (YoY), the company guided Q1 2026 comparable sales to decline between -3.0% and -1.0%, citing both the tough lap and continued pressure on grocery shoppers from elevated food prices. And same-store visits also dropped, falling between -3.0% and -6.0% YoY in Q1.
Still, overall foot traffic rose 1.8%, supported by the 37 stores opened in fiscal 2025 and additional locations added in early 2026, which helped offset softness at existing stores.
Against this backdrop, Sprouts is making several forward-looking investments that could support a traffic recovery later this year. Continued expansion, a new loyalty program launched in 2025, and ongoing merchandising innovation – alongside its transition to self-distribution for fresh meat – all position the company to compete on both quality and value as macro conditions evolve.
Will Sprouts return to same-store visit growth in Q2?
Visit Placer.ai/anchor to find out.
Placer.ai leverages a panel of tens of millions of devices and utilizes machine learning to make estimations for visits to locations across the US. The data is trusted by thousands of industry leaders who leverage Placer.ai for insights into foot traffic, demographic breakdowns, retail sale predictions, migration trends, site selection, and more.
.avif)
In February 2026, Chipotle unveiled its "Recipe for Growth" plan to reverse declining sales by improving operations, boosting marketing, and refreshing its menu. And though the plan has only been in place for a couple of months, traffic data suggests that it may already be having a positive impact on foot traffic to the chain.
After three consecutive quarters of year-over-year declines in average visits per location, Chipotle's foot traffic trends are showing signs of recovery. In Q1 2026, average visits per location were nearly flat (-0.2% YoY), while overall visits grew 5.8% – the strongest growth seen over the past year.
Several branding and menu innovations likely contributed to Chipotle's traffic recovery, including the high protein menu launched in late December 2025 and partnerships with athletes and sporting events. The biggest single driver, however, appears to have been the return of Chicken al Pastor on February 10, 2026 – a fan-favorite protein that had generated more social media requests for its comeback than any other LTO in the chain's history. In the month of its launch, overall visits rose 10.1% YoY and same-store visits grew 5.1%.
Still, the following month, overall visits were up just 3.6% and same-store visits were flat – suggesting that popular menu items can generate meaningful visit spikes, but those spikes may not automatically translate into lasting traffic bumps.
Chipotle appears to be leaning into this dynamic rather than fighting it. Starting April 28, the chain is rotating out Chicken al Pastor in favor of Honey Chicken – its best-performing LTO ever – effectively betting that a steady drumbeat of novelty and scarcity can sustain traffic where any single item cannot.
Another pillar of the company's "Back to Growth" plan entailed creating "new occasions that drive demand into our restaurants" – and Chipotle seems to have accomplished just that with its successful "Tatted Like a Chipotle Bag" BOGO promotion.
On March 13, 2026, from 3 to 4 PM local time, Chipotle offered an in-store BOGO entrée to any customer sporting a tattoo – real, temporary, or hand-drawn – a nod to the iconic tattoo-style graphics on a Chipotle bag. The one-hour activation drove a 55.3% spike in visits above the year-to-date average, with the highest daily visit count recorded since Placer.ai began tracking Chipotle's traffic in 2018. Chipotle also reported March 13th 2026 as the highest daily sales day in the chain's history.
That a single one-hour, in-store promotion could shatter the chain's all-time sales record speaks to the power of Chipotle's brand equity and the effectiveness of leaning into what makes it culturally distinct.
The early results suggest that Chipotle's 'Recipe for Growth' is already working – Q1's traffic recovery was built on a potent mix of menu innovation, viral activations, and renewed cultural relevance. But while the chain's strategy of cycling LTOs and engineering shareable moments has clearly rekindled consumer excitement – whether this delivers consistent same-store visit growth will be the real measure of "Recipe for Growth" success.
For more data-driven dining insights, visit placer.ai/anchor

After a strong Q4 2025 that delivered record single-day sales and one of the largest digital acquisition events in McDonald's history, Q1 2026 posed a harder test. Severe weather, pressure on lower-income consumers, and rising gas prices all weighed on the QSR category. So how did McDonald’s perform in Q1? We dove into the data to find out.
Q1 2026 visits to McDonald’s rose 0.6% year over year (YoY), with average visits per location essentially flat at 0.1%. Given Winter Storm Fern’s outsized impact on January traffic and a consumer environment that grew more selective as the quarter progressed, finishing Q1 in positive territory is a meaningful result.
That resilience reflects momentum built in Q4 2025, when McDonald’s delivered across all three of the pillars the company has identified as central to the brand's recovery: value, marketing, and menu. The September 2025 relaunch of Extra Value Meals helped reestablish McDonald’s value positioning, while MONOPOLY – returning to U.S. restaurants for the first time in nearly a decade – became one of the brand’s largest digital customer acquisition events ever. Meanwhile, the December 2025 Grinch Meal, featuring Dill Pickle McShaker Fries and collectible holiday socks, drove the highest single sales day in company history.
McDonald’s carried that strategy into Q1, bringing back the Shamrock Shake in February and launching the Big Arch Burger nationally in March. But in a quarter shaped by weather disruption and more cautious consumer spending, these initiatives generated more muted traffic responses than Q4’s record-setting activations.
The chart below illustrates McDonald’s uneven performance throughout the quarter. January same-store visits fell 1.3% YoY, due in part to Winter Storm Fern, which swept across more than 30 states late in the month, disrupting operations and driving temporary restaurant closures. February rebounded to +3.8% YoY, supported by pent-up demand and the return of the Shamrock Shake, which delivered a modest but discernable lift during its launch week. March, however, slipped back to -1.2% – reflecting the Big Arch Burger's more muted traffic response and possibly also the tightening of consumer purse strings in the face of rising gas prices.
But despite this consumer caution, the response to McDonald's latest pop-culture collab shows that even in a more demanding environment, the right promotion can still cut through.
On March 31 – the launch date of McDonald's collaboration with Netflix's Oscar-winning animated film KPop Demon Hunters – Tuesday visits reached 11.1% above the year-to-date Tuesday average, the highest single Tuesday reading of the entire first quarter. The promotion featured two dueling adult meals inspired by the film's rival groups, HUNTR/X and the Saja Boys, along with limited-time Korean-inspired items like Ramyeon McShaker Fries. And traffic stayed elevated in the days that followed, contributing to the chain's busiest week of the year so far.
Q1 data shows that McDonald’s can still drive traffic at scale, even in a softer environment. But success increasingly depends on executing consistently across value, marketing, and menu – while also delivering the kind of culturally relevant moments that give consumers a compelling reason to visit. How will the chain perform in Q2 as it rolls out its revamped McValue menu?
Follow Placer.ai/anchor to find out.
Placer.ai leverages a panel of tens of millions of devices and utilizes machine learning to make estimations for visits to locations across the US. The data is trusted by thousands of industry leaders who leverage Placer.ai for insights into foot traffic, demographic breakdowns, retail sale predictions, migration trends, site selection, and more.
.avif)
Starbucks and Dutch Bros may both operate in the coffee space, but they are pursuing distinct strategies that reflect their different stages of growth. Starbucks, the legacy leader, is focused on revitalizing its established brand. Dutch Bros, the newer, fast-growing entrant, is expanding its footprint and building brand awareness. And AI-powered location analytics suggests that both approaches appear to be working.
Dutch Bros is driving traffic through aggressive expansion, a drive-thru–focused model, and ongoing menu innovation. Meanwhile, Starbucks’ “Back to Starbucks” plan centers on closing underperforming stores, re-emphasizing the coffeehouse experience, and simplifying operations. Both chains may also be benefiting from the current consumer headwinds driving demand for affordable treats, with year-over-year (YoY) same-store visits up every month of the past six months.
In September 2024, Starbucks' then-new CEO Brian Niccol announced the Back to Starbucks turnaround strategy, focusing on reestablishing the brand's core identity as a coffee-first, community-centered brand, centered on high-quality coffee, skilled baristas, and a welcoming in-store experience. It also prioritizes improving service speed and consistency, simplifying operations, and strengthening the overall customer experience.
In September 2024, shortly after becoming CEO, Brian Niccol introduced the company's "Back to Starbucks" turnaround strategy, aimed at restoring the brand’s identity as a coffee-first, community-centered experience built on quality coffee, skilled baristas, and welcoming stores. The plan also emphasizes improving speed and consistency, simplifying operations, and enhancing the overall customer experience.
Traffic data reveals that the restructuring plan is already bearing fruit. Over the past two full quarters (Q4 2025 and Q1 2026) the company's overall traffic and average visits per venue increased 4.9% to 5.9% compared to the previous year – a particularly strong performance given broader consumer headwinds. If sustained, this momentum could signal a meaningful and durable return to growth for the brand.
Concurrently, Dutch Bros’ rapid expansion is translating into strong top-line traffic growth, with overall visits rising at a double-digit pace throughout 2025 and into early 2026. Quarterly gains ranged from 12.3% to 17.9% YoY as the brand entered new markets and scaled its footprint.
At the same time, average visits per location have remained relatively stable, suggesting that new store openings are not significantly cannibalizing existing units. This combination of robust overall traffic growth and steady per-location performance points to a healthy expansion strategy, where footprint growth is driving incremental demand rather than diluting it.
As both brands continue to execute on their respective strategies, early traffic trends suggest that there is no single path to growth in today’s coffee space. Starbucks’ operational reset and Dutch Bros’ expansion-led model are each resonating with consumers, albeit in different ways. The key question going forward will be whether these gains can be sustained as macro pressures persist and competition intensifies.
For more data-driven insights, visit placer.ai.anchor
The positive retail momentum observed in Q1 2024 continued into Q2 – as stabilizing prices and a strong job market fostered cautious optimism among consumers. Year-over-year (YoY) retail foot traffic remained elevated throughout the quarter, with June in particular seeing significant weekly visit boosts ranging from 4.7% to 8.5%.
The robustness of the retail sector in Q2 was also highlighted by positive visit growth during the quarter’s special calendar occasions, including Mother’s Day (the week of May 6th) and Memorial Day (the week of May 27th). And though consumer spending may moderate as the year wears on, retail’s strong Q2 showing offers plenty of room for optimism ahead of back-to-school sales and other summer milestones.
On a quarterly basis, overall retail visits rose 4.2% in Q2. And diving into specific categories shows that value continued to reign supreme, with discount and dollar stores seeing the most robust YoY visit growth (11.2%) of any analyzed category.
Other essential goods purveyors, such as grocery store chains (7.6%) and superstores (4.6%), also outperformed the overall retail baseline. And fitness – a category deemed essential by many health-conscious consumers – outpaced overall retail with a substantial 6.0% YoY foot traffic increase.
The decidedly more discretionary home improvement industry performed less well than overall retail in Q2 – but in another sign of consumer resilience, it too experienced a YoY visit uptick. And overall restaurant foot traffic increased 2.6% YoY.
Discount and dollar stores enjoyed a strong Q2 2024, maintaining YoY visit growth above 10.0% for six out of the quarter’s 13 weeks. Only during the week of April 1st did the category see a temporary decline, likely the result of an Easter calendar shift. (The week of April 1st 2024 is being compared to the week of April 3rd, 2023, which included the run-up to Easter)
Some of this growth can be attributed to the continued expansion of segment leaders like Dollar General. But the category has also been bolstered by the emphasis consumers continue to place on value in the face of still-high prices and economic uncertainty.
Dollar General, which has been expanding both its store count and its grocery offerings, saw YoY visits increase between 9.1% and 15.9% throughout the quarter. Affordable-indulgence-oriented Five Below, which has also been adding locations at a brisk clip, saw YoY visits increase between 4.9% and 18.8%.
And though Dollar Tree has taken steps to rightsize its Family Dollar brand, the company’s eponymous banner – which caters to middle-income consumers in suburban areas – continued to grow both its store count and its visits in Q2.
Grocery store chains also performed well in Q2 2024 – experiencing strongly positive foot traffic growth throughout the quarter. Though the sector continues to face its share of challenges, stabilizing food-at-home prices and improvements in employee retention and supply chain management have helped propel the industry forward.
Diving into the performance of specific chains shows that within the grocery segment, too, price was paramount in Q2 2024 – with limited-assortment value grocery stores like Aldi and Trader Joe’s leading the way.
Traditional chains H-E-B and Food Lion (owned by Ahold Delhaize) – both of which are known for relatively low prices – outperformed the wider grocery sector with respective YoY foot traffic boosts of 11.4% and 8.7%. But ShopRite, Safeway (owned by Albertsons), Kroger, and Albertsons also drew more visits in Q2 2024 than in the equivalent period of last year.
Fitness has proven to be relatively inflation-proof in recent years – thriving even in the face of reduced discretionary spending and consumer cutbacks. Indeed, rising prices may have actually helped boost gym attendance, as people sought to squeeze the most value out of their monthly fees and replace pricy outings with already-paid-for gym excursions.
And despite lapping a remarkably strong 2023, visits to gyms nationwide remained elevated YoY in Q2 2024.
Diving into the data for some of the nation’s leading gyms shows that today’s fitness market has plenty of room at the top. Planet Fitness, 24 Hour Fitness, Life Time Fitness, Orangetheory Fitness, and LA Fitness all experienced YoY visit growth in Q2 2024 – reflecting consumers’ enduring interest in all things wellness-related.
But it was EōS Fitness and Crunch Fitness – two value gyms that have been pursuing aggressive expansion strategies – that really hit it out of the park, with respective YoY foot traffic increases of 23.4% and 21.4%.
The week of April 1st saw a decline in YoY visits to superstores – likely attributable to the Easter calendar shift noted above. But the category quickly rallied, and with back-to-school shopping and major superstore sales events coming up this July, the category appears poised to enjoy continued success throughout the summer.
Within the superstore category, wholesale clubs continued to stand out – with Costco Wholesale, Sam’s Club and BJ’s Wholesale Club enjoying YoY foot traffic growth ranging from 12.0% to 7.4%. But Target and Walmart also impressed with 4.6% and 4.0% YoY visit increases.
Inflation, elevated interest rates, and a sluggish real estate market have created a perfect storm for the home improvement industry, with spending on renovations in decline. The accelerated return to office has likely also taken its toll on the category, as people spend more time outside the home and have less availability to immerse themselves in DIY projects.
But despite these challenges, weekly YoY foot traffic to home improvement and furnishing chains remained elevated throughout much of the Q2 – with June and April seeing mostly positive YoY visit growth, and May hovering just below 2023 levels. This (modest) visit growth may be driven by consumers loading up on supplies for necessary home repairs, or by shoppers seeking materials for smaller projects. And given the importance of Q2 for the home improvement sector, this largely positive snapshot may offer some promise of good things to come.
Some chains within the home improvement category continued to perform especially well in Q2 2024 – with rapidly expanding, budget-oriented Harbor Freight Tools leading the pack. But Ace Hardware, Menards, The Home Depot, and Lowe’s also saw foot traffic increases in Q2, showcasing the category’s resilience in the face of headwinds.
Restaurants – including full-service restaurants (FSR), quick-service restaurants (QSR), fast-casual chains, and coffee chains – lagged behind grocery stores and other essential goods retailers in Q2 2024, as price-sensitive consumers prioritized needs over wants and ate at home more often.
Still, YoY restaurant foot traffic remained up throughout most of the quarter. And impressively, the sector saw a YoY visit uptick during the week of Mother’s Day (the week of May 6th, 2024, compared to the week of May 8th, 2023) – an important milestone for FSR.
The restaurant industry’s YoY visit growth was felt across segments – though fast-casual and coffee chains experienced the biggest visit boosts. Like in Q1 2024, fast-casual restaurants hit the sweet spot between indulgence and affordability, outpacing QSR in the wake of fast food price hikes. And building on the positive YoY trendline that began to emerge last quarter, full-service restaurants finished Q2 2024 with a 1.4% YoY visit uptick.
Chain expansion was the name of the restaurant game in Q2 2024, with several chains that have been growing their footprints outperforming segment averages – including CAVA, Chipotle Mexican Grill, Ziggi’s Coffee, California-based Philz Coffee, Raising Cane’s, Whataburger, and First Watch. Chili’s Grill and Bar also outpaced the full-service category average, aided by the revamping of its “3 for Me” menu.
Retailers and restaurants in Q2 2024 continued to face plenty of challenges, from inflation to rising labor costs and volatile consumer confidence. But foot traffic trends across industries – including both essential goods purveyors like grocery stores and more discretionary categories like home improvement and restaurants – suggest plenty of room for cautious optimism as 2024 wears on.
Return-to-office (RTO) trends have been closely watched over the past few years, with relevant stakeholders trying to puzzle out the impact remote and hybrid work have had on business operations and worker performance. And while visits to office buildings, overall, remain below pre-pandemic levels, office recovery varies from city to city – reflecting the complex and nuanced nature of regional economic trends, workforce preferences, and industry-specific needs.
This white paper harnesses location analytics to explore office recovery in the country’s second-largest economy – Los Angeles. The first part of the report is based on an analysis of foot traffic data from Placer.ai’s Los Angeles Office Index – an index comprising 100 office buildings in LA (including several in the greater metro area). The second part of the report broadens the lens to analyze visits by local employees to points of interest (POIs) corresponding to four major LA-area office districts: Century City, Downtown LA, Santa Monica, and Culver City. The white paper examines the impact that return-to-work mandates have had on visits to office buildings, discovers which demographic groups are driving the RTO, and explores the connection between commute time and return-to-office rates.
The return to office in Los Angeles has consistently lagged behind other major cities, underperforming nationwide recovery levels since the pandemic ground in-office work to a virtual halt. Still, the city’s office buildings are seeing a steady increase in visits, with foot traffic tending to spike at the beginning of each year. This indicates that even though office visits in LA are still below national averages, they are on a steady growth trajectory – a promising sign for stakeholders in the city.
A closer examination of Los Angeles office buildings also shows that despite the overall lag, some top-performing buildings in the LA metro area are defying the odds. Visits to the 20 local office buildings with the narrowest Q2 2024 post-COVID visit gaps were down just 8.7% in June 2024 compared to January 2019 – significantly outperforming the nationwide average.
So while overall office recovery in the city is still behind nationwide trends, these top-performing buildings indicate an optimistic outlook for the city’s office spaces.
Diving into the demographics of visitors to LA’s top-performing office buildings reveals an important insight: these buildings are attracting younger workers. This cohort has shown a stronger preference for in-person work compared to their older colleagues.
Analyzing the buildings’ captured markets with psychographics from AGS: Panorama reveals that these buildings are attracting visitors from areas with larger shares of "Emerging Leaders" and "Young Coastal Technocrats" than the broader metro area.
"Emerging Leaders'' – upper-middle-class professionals in early stages of their careers – make up 20.3% of households in the trade areas feeding visits to these top-performing buildings, compared to 14.9% in the broader LA CBSA. Similarly, "Young Coastal Technocrats," young and highly educated professionals in tech and professional services, account for 14.7% of households driving visits to the top-performing buildings, compared to only 12.1% in the broader area.
The trend suggests that companies in these high-performing office buildings employ many early-career professionals eager to accelerate their careers and work in-person with colleagues and mentors. This is a positive sign for the future of the office market in the LA metro area, indicating that it is attractive to key demographic groups that are likely to drive future growth and innovation.
Over the past few years, the debate regarding return-to-office mandates has been a heated one. Will employees follow return-to-office requirements? Can companies enforce the return to office after offering remote and hybrid work options? Recent location analytics data suggests that, at least in the Los Angeles metro area, some return-to-office mandates have been effective.
Three major tech companies – Activision Blizzard, TikTok, and SNAP Inc. – recently made their return-to-office policies stricter. Activision mandated a full return to the office in January 2024. TikTok has also intensified its return-to-office policy while seeking to expand its office presence in the greater Los Angeles area. And SNAP Inc. required employees to return to the office earlier this year as a condition of continued employment.
Visitation patterns at each of these companies' respective headquarters suggest that their policies have directly impacted visit frequency. Since the beginning of the year, the share of repeat office visits (defined as two or more visits per week) has increased for all three locations. Activision saw its share of repeat office visits grow from 52.1% in H1 2023 to 61.4% in the same period of 2024. TikTok’s repeat visits grew from 49.5% to 61.0%, and SNAP’s repeat visits increased from 36.6% to 42.8%.
These numbers highlight how return-to-office policies can lead to noticeable changes in office visit patterns and offer a blueprint to other businesses looking to foster a stronger in-office workforce.
Los Angeles is the second-largest metro area in the country, with several distinct business districts across its sprawling landscape. And a closer look at four major office hubs in the greater LA area – Century City, Downtown LA, Santa Monica, and Culver City – highlights how the office recovery can vary, not just by city or demographic, but on a neighborhood level.
Weekday visits by local employees to all four analyzed business districts have rebounded significantly since 2020 – though each area has followed its own particular trajectory.
Culver City, home to major businesses including Sony Pictures and Disney Digital Network, saw the least pronounced drop in employee visits during the early days of the pandemic. And in Q2 2024, weekday visits by local workers were down just 18.4% compared to Q1 2019.
Century City, on the other hand, saw the most marked drop in local employee foot traffic as the pandemic set in. But the district’s recovery trajectory has also been the most dramatic – with a Q2 2024 visit gap of just 28.5%, smaller than Downtown LA’s 29.7% visit gap. Perhaps capitalizing on this momentum, Century City is expanding its business district with the addition of a major new office building, set to be completed in 2026 and serve as the headquarters for Creative Artists Agency. Santa Monica, for its part, finished off Q2 2024 with a 23.3% visit gap.
Century City stands out within the Los Angeles metropolitan area for its dramatic decline and subsequent resurgence in local employee foot traffic. And looking at another metric of office recovery – employee commute distance – further underscores the district’s remarkable comeback.
The share of employees commuting to Century City from three to seven miles away has nearly returned to pre-COVID levels – suggesting a normalization of commuting patterns by local workers living in the area. In H1 2019, 33.5% of workers in Century City commuted between 3 and 7 miles to work; in 2022, that number had dropped to 29.8%. But by 2024, the share of visitors making that commute had grown to 32.5% – much closer to pre-COVID numbers.
Similarly, the region’s trade area size, which had contracted significantly in the wake of the pandemic, bounced back significantly in 2024. This serves as another indication of Century City’s rebound, cementing Century City’s status as a key business hub within the Los Angeles metropolitan area.
Five years after the upheaval caused by the pandemic, office spaces are still changing. Although the Los Angeles area has taken longer to recover than other major cities, analyzing local visitation data shows significant potential for the city’s business areas. With young employees leading the return-to-office charge, the city is poised to keep driving its strong economy and adjust to an evolving office environment.
Retail media networks (RMNs) have cemented their roles as the future – and present – of advertising. These networks enable advertisers to promote products and services through a retailer’s online properties and physical stores, when consumers are close to the point-of-purchase and primed to buy.
Today, we take a closer look at two newcomers to the retail media space: Costco Wholesale and Wawa. Both chains have an online presence – but both also excel at in-store experiences, offering unique opportunities for consumer engagement and exposure to new products.
This white paper dives into the data to explore some of the key advantages Costco and Wawa bring to the retail media table – and examine how the retailers’ physical reach can best be leveraged to help advertising partners find new audiences.
Wawa and Costco, the latest additions to the growing number of companies with retail media networks, exhibit significant advertising potential. Both brands boast a wide reach and diverse customer base, and both have access to troves of customer data through membership and loyalty programs.
Foot traffic data confirms the robust offline positioning of the two retailers. In Q1 2024, year-over-year (YoY) visits to Costco and Wawa increased 9.5% and 7.5% respectively – showing that their in-store engagement is on a growth trajectory.
And since consumers tend to spend a lot more time in-store than they do on retailers’ websites, Costco’s and Wawa’s strong brick-and-mortar growth positions them especially well to help advertisers reach new customers. In Q1 2024, the average visits to Costco’s and Wawa’s physical stores lasted 37.4 and 11.4 minutes respectively – compared to just 6.7 and 4.6 minutes for the chains’ websites. These longer in-store dwell times can be harnessed to maximize ad exposure and offer partners more extended opportunities for meaningful interactions with customers. Partners can also analyze the behavior and preferences of the two chains’ growing visitor bases to craft targeted online campaigns.
Costco’s retail media network will tap into the on- and offline shopping habits of its staggering 74.5 million members to inform targeted advertising by partners. And the retailer’s tremendous reach offers a significant opportunity to engage customers in-store.
But while Costco is dominant in some areas of the country, other markets are led by competitors like Sam’s Club and BJ’s Wholesale Club. And advertisers looking to choose between competing RMNs or hone in on the areas where Costco is strongest can analyze Costco's performance and visit share – on a local or national level – to determine where to focus their efforts.
An analysis of the share of visits to wholesalers across the country reveals that Costco is the dominant wholesale membership club in much of the Western United States. But Costco also captures the largest share of wholesale club visits in many other major population centers, including important markets like New York, Chicago, Phoenix, and San Antonio. Costco’s widespread brick-and-mortar dominance offers prospective advertising partners a significant opportunity to connect with regional audiences in a wide array of key markets.
Another one of Costco’s key advantages as a retail media provider lies in its highly loyal and engaged audience. In May 2024, a whopping 41.4% of Costco’s visitors frequented the club at least twice during the month – compared to 36.6% for Sam’s Club and 36.0% for BJ’s Wholesale.
Moreover, Costco led in average visit duration compared to its competitors. In May 2024, customers spent an average of 37.1 minutes at Costco – surpassing even the impressive dwell times at Sam’s Club and BJ’s Wholesale Club.
YoY visits per location to Costco, too, were the highest of the analyzed wholesalers, all three of which saw YoY increases. These metrics further establish the wholesaler’s position as an effective retail media provider.
Even when foot traffic doesn't show a brand’s clear regional dominance, location analytics can reveal other metrics that signal its unique potential. Take the Richmond-Petersburg, VA, designated market area (DMA), for example. In May 2024, BJ’s Wholesale Club led the DMA with 41.2% of wholesale club visits, while Costco was a close second with 37.3% of visits.
But despite BJ’s lead in visit share, Costco's Richmond audience was more affluent. Costco's visitors came from trade areas with a median household income (HHI) of $93.2K/year, compared to $73.1K/year for Sam’s Club and $89.5K/year for BJ’s. Additionally, Costco drew a higher share of weekday visits than its counterparts.
Analyzing shopper habits and preferences across chains on a local level can provide crucial context for strategists working on media campaigns. Advertisers can partner with the brands most likely to attract consumers interested in their offerings, and identify where – and when – to focus their advertising efforts.
Convenience stores, or c-stores, are emerging as destinations in and of themselves – and their rising popularity among a wider-than-ever swath of consumers opens up significant opportunities in the retail advertising space.
Wawa is a relative newcomer to the world of retail media, after other c-stores like 7-Eleven and Casey’s launched their networks in 2022 and 2023. But despite coming a bit late to the party, the potential for Wawa’s Goose Media Network is significant – thanks to a cadre of highly loyal visitors who enjoy the physical shopping experience the c-store chain offers.
In May 2024, Wawa’s share of loyal visitors (defined as those who visited the chain at least twice in a month) was 60.1%. In contrast, other leading c-store chains operating in Wawa’s market area – QuickTrip and 7-Eleven, for example – saw loyalty rates of 56.0% and 47.9%, respectively, for the same period.
Additionally, Wawa visitors browsed the aisles longer than those at other convenience retailers. In May 2024, 39.9% of Wawa visitors stayed in-store for 10 minutes or longer, compared to 29.6% at QuickTrip and 25.7% at 7-Eleven.
Wawa's loyal customer base and longer visit durations make it a strong contender in the retail media space. By harnessing this high level of customer engagement, Wawa can draw in advertisers and develop targeted marketing strategies that resonate with its dedicated shoppers.
Wawa has been on an expansion roll over the past few years, with plans to open at least 280 stores over the next decade in North Carolina, Tennessee, Georgia, Alabama, Ohio, Indiana, and Kentucky. The chain has also been steadily increasing its footprint in Florida – between January 2019 and April 2024, Wawa grew from 167 Sunshine State locations to 280, with more to come.
And analyzing changes in Wawa’s visit share in one of Florida’s biggest markets – the Miami-Ft. Lauderdale DMA – shows how successful the chain’s local expansion has been. Between January 2019 and April 2024, Wawa more than doubled its category-wide visit share in the Miami area (i.e. the portion of total c-store visits in the DMA going to Wawa) – from 19.0% to nearly 40.0%.
A look at changes in Wawa’s Miami-Ft. Lauderdale trade area shows that the chain’s growing visit share has been driven by an expanding market and an increasingly diverse audience.
In April 2019, there were some 55 zip code tabulation areas (ZCTAs) in the Miami-Ft. Lauderdale DMA from which Wawa drew at least 3,000 visits per month. By April 2021, this figure grew to 96 – and by April 2024, it reached 129.
Over the same period, the share of “Family Union” households in Wawa’s local captured market – defined by the Experian: Mosaic dataset as families comprised of middle-income, blue collar workers – nearly doubled, growing from 7.4% in April 2019 to 14.4% in April 2024.
Retail media networks that make it easier to introduce shoppers to products and brands that are closely aligned with their preferences and habits offer a win-win-win for retailers, advertisers, and consumers alike. And Costco and Wawa are extremely well-positioned to make the most of this opportunity.