Malls have come a long way since their introduction to the world in the 1950s. These gleaming retail hubs promised shoppers a taste of the American dream, offering a third place for teens, families, and everyone in between to shop, socialize, and hang out.
And though malls have faced challenges in recent years, as e-commerce and pandemic-induced store closures led to shifts in consumer habits, the outlook is brightening. Malls have embraced innovation, incorporating enhanced entertainment, dining, and experiential offerings that attract a diverse range of visitors and redefine their purpose.
This white paper takes a look at the recent location intelligence metrics to gain an understanding of the changes taking place at malls across the country – including both indoor malls and open-air shopping centers. The report explores questions like: Why do malls experience foot traffic bumps during the summer months? How much of an impact do movie theaters have on mall visits, and what can mall operators learn from the Mall of America and American Dream malls’ focus on experiential entertainment?
2024’s Summer Peak at the Mall
Mall visitation is highly seasonal, with strikingly consistent monthly visitation patterns. Each year, visits decline somewhat in February, pick up in March, and begin to trend upward again in May – before peaking again in August. Then, after a slower September and October, foot traffic skyrockets during the holiday season, spiking dramatically in December.
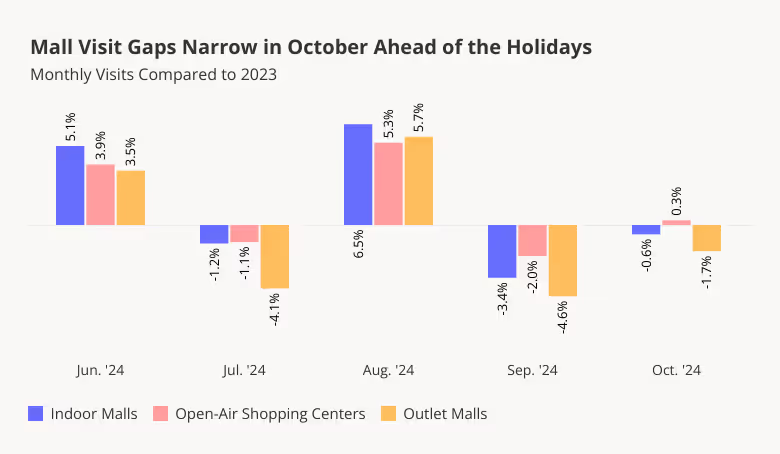
And while these trends follow similar patterns every year, comparing monthly visits throughout 2019, 2023, and 2024 (YTD) to each year’s own January baseline shows that this seasonality is growing more pronounced - especially for indoor malls.
Following a lackluster 2023, visits to both indoor malls and open-air shopping centers peaked higher in March 2024 than in 2019. And this summer, indoor malls in particular saw a much larger visit boost than in previous years. In August 2024, for example, visits to indoor malls were 27.3% higher than in January 2024 – a substantially higher baseline jump than that seen either in August 2019 (17.0%) or in August 2023 (12.0%). And though open-air shopping centers experienced a smaller summer visit boost, they too saw a bigger bump this year than in 2019 or in 2023.
Summer Of Shopping
But malls aren’t just seeing larger visit spikes this year relative to their January baselines – they are also drawing bigger crowds than they did in 2023.
Between June and August 2024, indoor malls and open-air shopping centers both experienced year-over-year (YoY) visit growth. Indoor malls saw the largest YoY foot traffic boost (3.7%) – perhaps owing in part to 2024’s record-breaking heat, which led many patrons to seek refuge in air conditioned spaces. Still, open-air shopping centers, which feature plenty of air conditioned stores and restaurants, also enjoyed a YoY visit boost of 2.8% during the analyzed period.
Malls’ strong summer baseline and YoY foot traffic growth built upon the strong performance seen during most of 2024 so far, leading to the question: What is driving malls’ positive momentum? We delve into some of the factors propelling these changes below.
Blockbuster Attractions Bring Audiences
One offering that continues to play a significant role in driving foot traffic to malls is on-site movie theaters. Summer blockbuster releases, in particular, help attract crowds to theaters, in turn boosting overall visits to malls.
Much like malls, movie theaters have also proven their resilience over the past few years. While pundits fretted about the theater’s impending death, production houses were busy releasing blockbuster after blockbuster and shattering box-office records at an impressive clip. And while 2023 was certainly a banner year for blockbuster summer releases, 2024 has had its fair share of stunning box-office successes, leading to major visit boosts at theaters across the country.
Analyzing visits to malls with and without movie theaters highlights the impact of these summer Hollywood hits. Between June and August 2024, malls with theaters saw bigger visit boosts compared to a monthly year-to-date (YTD) average than malls without – an effect observed both for indoor malls and for open-air shopping centers.
For both mall types, the gap between centers with and without movie theaters was most pronounced in July 2024, likely owing to the release of Inside Out 2 in mid-June as well as the July releases of Deadpool & Wolverine and Twister. But in June and August 2024, too, centers with movie theaters sustained particularly impressive visit boosts – a solid sign that movie theaters and malls remain a winning combination.
Movies at the Mall: An Evening Affair
Malls with movie theaters also drew higher shares of evening visits (7:00 PM - 10:00 PM) this summer than those without. Between June and August 2024, for example, evening outings accounted for 22.9% of visits to open-air shopping centers with movie theaters – compared to 18.2% of visits to centers without theaters. Indoor malls with theaters also saw a larger share of evening visits than those without – 18.1% compared to 15.0%.
This increase in evening traffic is likely driven by major summer movie releases and the flexibility of summer schedules, with many visitors – including families – taking advantage of late-night outings without the concern of early wakeup calls. These summer visitation trends benefit both theaters and malls, opening up opportunities for increased sales through concessions, promotions, and evening deals that attract a more relaxed and engaged crowd.
Families Lead the Summer Mall Surge
Analyzing the demographics of malls’ captured markets also reveals that centers with movie theaters are more likely to attract certain family-oriented segments than those without. (A mall’s captured market consists of the mall’s trade areas – the census block groups (CBGs) feeding visitors to the mall – weighted according to each CBG’s actual share of visits to the mall.)
Between June and August 2024, for example, 14.2% of the captured markets of open-air shopping centers with movie theaters were made up of “Wealthy Suburban Families” – compared to 9.7% for open-air shopping centers without theaters.
Indoor malls saw a similar pattern with regard to “Near-Urban Diverse Families”: Middle class families living in and around cities made up 9.0% of the captured markets of indoor malls with movie theaters, compared to 7.1% of the captured markets of those without.
This increase in foot traffic from middle-class and wealthy family segments can be a boon for malls and retail tenants – driving up food court profits and bolstering sales at stores with kid-friendly offerings.
Malls as the Main Attraction
Willing to Travel: Malls Draw Summer Visits From Afar
Malls have long positioned themselves as destinations for summer entertainment as well as retail therapy, holding – in addition to back to school sales – events like Fourth of July celebrations and even indoor basketball and arena football games. And during the summer months, malls attract visitors from further away.
Between June and August 2024, indoor malls drew 18.2% of visitors from 30+ miles away – compared to just 16.7% during the first five months of the year. Similarly, open-air shopping centers drew 19.6% of visits from 30+ miles away during the summer, compared to 17.1% between January and May.
Extended daylight hours, summer trips away from home, and more free time are likely among the contributors to the summer draw for long-distance mall visitors. But in addition to their classic offerings – from movie theaters to stores and food courts – malls have also invested in other kinds of unique experiences to attract visitors. This next section takes a look at two mega-malls winning at the visitation game, to see what sets them apart.
Mall Of America: Experiential Exuberance
The Minneapolis-based Mall of America opened in 1992, redefining the limits of what a mall could offer. The mall boasts hundreds of stores, games, rides, and more – and is constantly expanding its attractions, cementing its status as a top destination for retail and entertainment.
Between June and August 2024, Mall of America experienced a 13.8% YoY visit increase, far outperforming the 3.7% visit boost seen by the wider indoor mall space. And as a major tourist attraction – the mall hosted a series of Olympic-themed events throughout the summer – it also drew 41.6% of visits from 30+ miles away. This share of distant visitors was significantly higher than that seen at the mall during the first five months of 2024, and more than double the segment-wide summer average of 18.2%.
The Mall of America also seems to be attracting more upper-middle-class families during the summer than other indoor malls: Between June and August 2024, some 18.0% of Mall of America’s captured market consisted of “Upper Suburban Diverse Family Households” – a segment including upper-middle-class suburbanites – compared to just 11.1% for the wider indoor mall segment. The increased presence of these families at the Mall of America may be driven by the variety of events offered during the summer.
American Dream Mall: ArenaBowl Draws Crowds
In 2019, the American Dream Mall in New Jersey opened and became the second-largest mall in the country. Since the mall opened its doors, it has also focused on blending retail and entertainment to draw in as wide a range of visitors as possible – and summer 2024 was no exception.
The mall hosted the Arena Football League Championship, ArenaBowl XXXIII, on Friday, July 19th. The event successfully attracted a higher share of visitors traveling from 30+ miles away compared to the average summer Friday – 35.4% compared to 25.7%.
Visits to the mall on the day of the championship were also 13.6% higher than the Friday visit average for the period between June and August 2024, showcasing the mall’s ability to draw in crowds by hosting major events.
Summer Rush Recap: Mall Visitation in Focus
Malls – both indoor and open-air – continue to evolve while playing a central role in the American retail landscape. Increasingly, malls are emerging as destinations for more than just shopping – especially during the summer – driving up foot traffic and attracting visitors from near and far. And while much is often said about the impact of holiday seasons on mall foot traffic, summer months offer another opportunity to boost mall visits. Malls that can curate experiences that resonate with their clientele can hope to see foot traffic growth – in the summer months and beyond.


.svg)