Dining in 2024 (So Far)
The restaurant space has experienced its fair share of challenges in recent years – from pandemic-related closures to rising labor and ingredient costs. Despite these hurdles, the category is holding its own, with total 2024 spending projected to reach $1.1 trillion by the end of the year.
And an analysis of year-over-year (YoY) visitation trends to restaurants nationwide shows that consumers are frequenting dining establishments in growing numbers – despite food-away-from-home prices that remain stubbornly high.
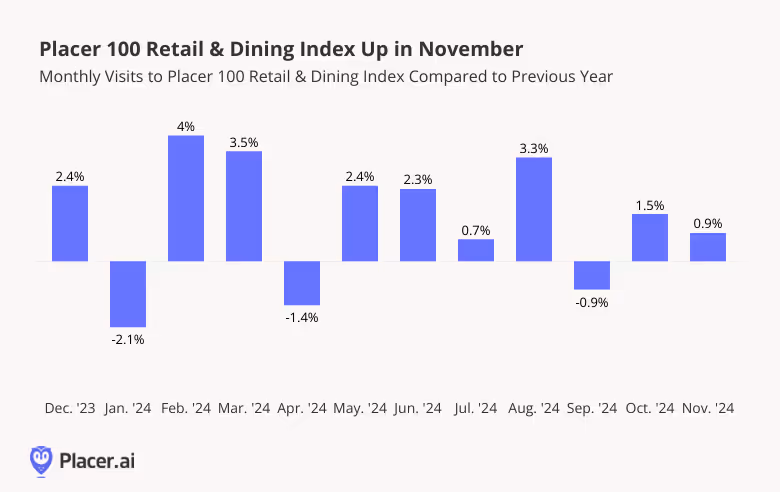
Overall, monthly visits to restaurants were up nearly every month this year compared to the equivalent periods of 2023. Only in January, when inclement weather kept many consumers at home, did restaurants see a significant YoY drop. Throughout the rest of the analyzed period, YoY visits either held steady or grew – showing that Americans are finding room in their budgets to treat themselves to tasty, hassle-free meals.
Still, costs remain elevated and dining preferences have shifted, with consumers prioritizing value and convenience – and restaurants across segments are looking for ways to meet these changing needs. This white paper dives into the data to explore the trends impacting quick-service restaurants (QSR), full-service restaurants (FSR), and fast-casual dining venues – and strategies all three categories are using to stay ahead of the pack.
Dollar-Driven Dining Decisions
Overall, the dining sector has performed well in 2024, but a closer look at specific segments within the industry shows that fast-casual restaurants are outperforming both QSR and FSR chains.
Between January and August 2024, visits to fast-casual establishments were up 3.3% YoY, while QSR visits grew by just 0.7%, and FSR visits fell by 0.3% YoY. As eating out becomes more expensive, consumers are gravitating toward dining options that offer better perceived value without compromising on quality. Fast-casual chains, which balance affordability with higher-quality ingredients and experiences, have increasingly become the go-to choice for value-conscious diners.
Fast-casual restaurants also tend to attract a higher-income demographic. Between January and August 2024, fast-casual restaurants drew visitors from Census Block Groups (CBGs) with a weighted median household income of $78.2K – higher than the nationwide median of $76.1K. (The CBGs feeding visits to these restaurants, weighted to reflect the share of visits from each CBG, are collectively referred to as their captured market).
Perhaps unsurprisingly, quick-service restaurants drew visitors from much less affluent areas. But interestingly, despite their pricier offerings, full-service restaurants also drew visitors from CBGs with a median HHI below the nationwide baseline. While fast-casual restaurants likely attract office-goers and other routine diners that can afford to eat out on a more regular basis, FSR chains may serve as special occasion destinations for those with more moderate means.
Who Can Afford to Raise Prices?
Though QSR, FSR, and fast-casual spots all seek to provide strong value propositions, dining chains across segments have been forced to raise prices over the past year to offset rising food and labor costs. This next section takes a look at several chains that have succeeded in raising prices without sacrificing visit growth – to explore some of the strategies that have enabled them to thrive.
Shake Shack: Drawing Affluent Audiences
The fast-casual restaurant space attracts diners that are on the wealthier side – but some establishments cater to even higher earners. One chain of note is NYC-based burger chain Shake Shack, which features a captured market median HHI of $94.3K. In comparison, the typical fast-casual diner comes from areas with a median HHI of $78.2K.
Shake Shack emphasizes high-quality ingredients and prices its offerings accordingly. The chain, which has been expanding its footprint, strategically places its locations in affluent, upscale, and high-traffic neighborhoods – driving foot traffic that consistently surpasses other fast-casual chains. And this elevated foot traffic has continued to impress, even as Shake Shack has raised its prices by 2.5% over the past year.
Texas Roadhouse: Thriving Through Price Hikes
Steakhouse chain Texas Roadhouse has enjoyed a positive few years, weathering the pandemic with aplomb before moving into an expansion phase. And this year, the chain ranked in the top five for service, food quality, and overall experience by the 2024 Datassential Top 500 Restaurant Chain.
Like Shake Shack, Texas Roadhouse has raised its prices over the past year – three times – while maintaining impressive visit metrics. Between January and August 2024, foot traffic to the steakhouse grew by 9.7% YoY, outpacing visits to the overall FSR segment by wide margins.
This foot traffic growth is fueled not only by expansion but also by the chain's ability to draw traffic during quieter dayparts like weekday afternoons, while at the same time capitalizing on high-traffic times like weekends. Some 27.7% of weekday visits to Texas Roadhouse take place between 3:00 PM and 6:00 PM – compared to just 18.9% for the broader FSR segment – thanks to the chain’s happy hour offerings early dining specials. And 43.3% of visits to the popular steakhouse take place on Saturdays and Sundays, when many diners are increasingly choosing to splurge on restaurant meals, compared to 38.4% for the wider category.
QSR Limited-Time Offers (LTOs) to the Rescue
Though rising costs have been on everybody’s minds, summer 2024 may be best remembered as the summer of value – with many quick-service restaurants seeking to counter higher prices by embracing Limited-Time Offers (LTOs). These LTOs offered diners the opportunity to save at the register and get more bang for their buck – while boosting visits at QSR chains across the country.
Hardee’s August Combo Deal: A Recipe for Loyalty
Limited time offers such as discounted meals and combo offers can encourage frequent visits, and Hardee’s $5.99 "Original Bag" combo, launched in August 2024, did just that. The combo allowed diners to mix and match popular items like the Double Cheeseburger and Hand-Breaded Chicken Tender Wraps, offering both variety and affordability. And visits to the chain during the month of August 2024 were 4.9% higher than Hardee’s year-to-date (YTD) monthly visit average.
August’s LTO also drove up Hardee’s already-impressive loyalty rates. Between May and July 2024, 40.1% to 43.4% of visits came from customers who visited Hardee’s at least three times during the month, likely encouraged by Hardee’s top-ranking loyalty program. But in August, Hardee’s share of loyal visits jumped to 51.5%, highlighting just how receptive many diners are to eating out – as long as they feel they are getting their money’s worth.
McDonald’s Special Meal Deal
McDonald’s launched its own limited-time offer in late June 2024, aimed at providing value to budget-conscious consumers. And the LTO – McDonald’s foray into this summer’s QSR value wars – was such a resounding success that the fast-food leader decided to extend the deal into December.
McDonald’s LTO drove foot traffic to restaurants nationwide. But a closer look at the chain’s regional captured markets shows that the offer resonated particularly well with “Young Urban Singles” – a segment group defined by Spatial.ai's PersonaLive dataset as young singles beginning their careers in trade jobs. McDonald's locations in states where the captured market shares of this demographic surpassed statewide averages by wider margins saw bigger visit boosts in July 2024 – and the correlation was a strong one.
For example, the share of “Young Urban Singles” in McDonald’s Massachusetts captured market was 56.0% higher than the Massachusetts statewide baseline – and the chain saw a 10.6% visit boost in July 2024, compared to the chain's statewide H1 2024 monthly average. But in Florida, where McDonald’s captured markets were over-indexed for “Young Urban Singles” by just 13% compared to the statewide average, foot traffic jumped in July 2024 by a relatively modest 7.3%.
These young, price-conscious consumers, who are receptive to spending their discretionary income on dining out, are not the sole driver of McDonald’s LTO foot traffic success. Still, the promotion’s outsize performance in areas where McDonald’s attracts higher-than-average shares of Young Urban Singles shows that the offering was well-tailored to meet the particular needs and preferences of this key demographic.
Michelin Star Success
While QSR, fast-casual, and FSR chains have largely boosted foot traffic through deals and specials, reputation is another powerful way to attract diners. Restaurants that earn a coveted Michelin Star often see a surge in visits, as was the case for Causa – a Peruvian dining destination in Washington, D.C. The restaurant received its first Michelin Star in November 2023, a major milestone for Chef Carlos Delgado.
The Michelin Star elevated the restaurant's profile, drawing in affluent diners who prioritize exclusivity and are less sensitive to price increases. Since the award, Causa saw its share of the "Power Elite" segment group in its captured market increase from 24.7% to 26.6%. Diners were also more willing to travel for the opportunity to partake in the Causa experience: In the six months following the award, some 40.3% of visitors to the restaurant came from more than ten miles away, compared to just 30.3% in the six months prior.
These data points highlight the power of a Michelin Star to increase a restaurant’s draw and attract more affluent audiences – allowing it to raise prices without losing its core clientele. Wealthier diners often seek unique culinary experiences, where price is less of a concern, making these establishments more resilient to inflation than more venues that serve more price-sensitive customers.
The Final Plate
Dining preferences continue to evolve as restaurants adapt to a rapidly changing culinary landscape. From the rise in fast-casual dining to the benefits of limited-time offers, the analyzed restaurant categories are determining how to best reach their target audiences. By staying up-to-date with what people are eating, these restaurant categories can hope to continue bringing customers through the door.


.svg)