Many retail and dining chains performed well in 2024 despite the ongoing economic uncertainty. But with the consumer headwinds continuing into 2025, which brands can continue pulling ahead of the pack?
This report highlights 10 brands (in no particular order) that exhibit significant potential to grow in 2025 – as well as three chains that have faced some challenges in 2024 but appear poised to make a comeback in the year ahead. Which chains made the cut? Dive into the report to find out.
1. Sprouts
Through 2024, visits to Sprouts Farmers Market locations increased an average of 7.2% year-over-year (YoY) each month, outpacing the wider grocery segment standard by an average of six percentage points. And not only were visits up – monthly visits per location also grew YoY.
The promising coupling of overall and visits per location growth seems driven by the brands’ powerful understanding of who they are and what they bring to the market. The focus on high quality, fresh products is resonating, and the utilization of small- format locations is empowering the chain to bring locations to the doorstep of their ideal audiences.
This combination of forces positions the brand to better identify and reach key markets efficiently, offering an ideal path to continued growth. The result is a recipe for ongoing grocery success.
2. CAVA
CAVA has emerged as a standout success story in the restaurant industry over the past several years. Traditionally, Mediterranean concepts have not commanded the same level of demand as burger, sandwich, Mexican, or Asian fast-casual concepts, which is why the category lacked a true national player until CAVA's rise. However, evolving consumer tastes have created a fertile landscape for Mediterranean cuisine to thrive, driven by factors such as social media influence, expanded food options via third-party delivery, growing demand for healthier choices, the rise of food-focused television programming, and the globalization of restaurant concepts .
CAVA’s success can be attributed to several key factors. Roughly 80% of CAVA locations were in suburban areas before the pandemic, aligning well with consumer migration and work-from-home trends. Additionally, CAVA was an early adopter of digital drive-thru lanes, similar to Chipotle’s "Chipotlanes," and began developing these store formats well before the pandemic. The brand has also utilized innovative tools like motion sensors in its restaurants to optimize throughput and staffing during peak lunchtime hours, enabling it to refine restaurant design and equipment placement as it expanded. CAVA’s higher employee retention rates have also contributed to its ability to maintain speed-of-service levels above category averages.
These strengths allowed CAVA to successfully enter new markets like Chicago in 2024. While many emerging brands have struggled to gain traction in new areas, CAVA’s visit-per-location metrics in recently entered markets have matched its national averages, positioning the brand for continued growth in 2025.
3. Ashley Furniture
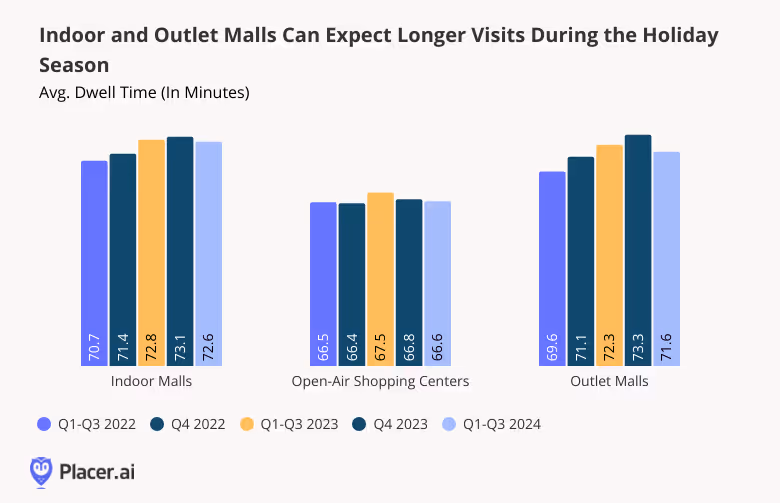
Ashley’s recent strategy shift to differentiate itself through experiential events, such as live music, workshops, and giveaways, is a compelling approach in the challenging consumer discretionary category. Post-pandemic, commercial property owners have successfully used community events to boost visit frequency, dwell time, and trade area size for mall properties. It’s no surprise that retailers like Ashley are adopting similar strategies to engage customers and enhance their in-store experience.
The decision to incorporate live events into its marketing strategy reflects the growing demand for experiential and immersive retail experiences. While home furnishings saw a surge in demand during the pandemic, the category has struggled over the past two years, underperforming other discretionary retail sectors compared to pre-pandemic levels. Recognizing this challenge, Ashley’s rebrand focuses on creating interactive and memorable experiences that allow customers to engage directly with its products and explore various design possibilities. In turn, this has helped to drive visits from trade areas with younger consumers with lower household incomes.
Ashley has leaned into collaborations with interior designers and industry experts to offer informative sessions and workshops during these events. These initiatives not only attract traffic but also provide valuable insights into customers’ preferences, which can be used to refine product offerings, enhance customer service, and shape future marketing efforts. This approach is particularly relevant as millennials and Gen Z drive new household formation. While still early, Ashley’s pivot to live events is showing promising results in attracting visits and increasing customer engagement.
4. Nordstrom
Department stores have had many challenges in navigating changing consumer behavior and finding their place in an evolving retail landscape. Nordstrom, an example of department store success in 2024, has been able to maintain a strong brand relationship with its shoppers and regain its footing with its store fleet. While the chain has certainly benefited from catering to a more affluent, and less price sensitive, consumer base, it still shines in fostering a shopping experience that stands out.
Value might be a driver of retail visitation across the industry, but for Nordstrom, service and experience is paramount. The retailer has downplayed promotional activity in favor of driving loyalty among key visitors. Nordstrom also has captured higher shares of high-value, younger consumer segments, which defies commonly held thoughts about department stores. The chain was a top visited chain during Black Friday in 2024, showcasing that it’s top of mind for shoppers for both gift giving and self-gifting.
What’s next? Nordstrom announced at the end of December that it plans to go private with the help of Mexican retail chain Liverpool. We expect to see even more innovation in store experience, assortments and services with this newfound flexibility and investment. And, we cannot forget about Nordstrom Rack, which allows the retailer to still engage price-conscious shoppers of all income levels, which is certainly still a bright spot as we head into 2025.
5. Sam’s Club
Visits are up, and the audience visiting Sam’s Club locations seems to be getting younger which – when taken together – tells us a few critical things. First, Sam’s Club has parlayed its pandemic resurgence into something longer term, leveraging the value and experience it provides to create loyal customers. Second, the power of its offering is attracting a newer audience that had previously been less apt to take advantage of the unique Sam’s Club benefits.
The result is a retailer that is proving particularly adept at understanding the value of a visit. The membership club model incentives loyalty which means that once a visitor takes the plunge, the likelihood of more visits is heightened significantly. And the orientation to value, a longer visit duration, and a wide array of items on sale leads to a larger than normal basket size.
In a retail segment where the value of loyalty and owning ‘share of shopping list’ is at a premium, Sam’s Club is positioned for the type of success that builds a foundation for strength for years to come.
6. Raising Cane’s Chicken Fingers
Raising Cane’s exemplifies the power of focus by excelling at a simple menu done exceptionally well. Over the past several years, the chain has been one of the fastest-growing in the QSR segment, driven by a streamlined menu that enhances speed and efficiency, innovative marketing campaigns, and strategic site selection in both new and existing markets. Notably, Raising Cane’s ranked among the top QSR chains for visit-per-location growth last year. Unlike many competitors that leaned on deep discounts or nostalgic product launches to boost traffic in 2024, Raising Cane’s relied on operational excellence to build brand awareness and drive visits. This approach has translated into some of the highest average unit sales in the segment, with restaurants averaging around $6 million in sales last year.
Raising Cane’s operational efficiency has also been a key driver of its rapid expansion, growing from 460 locations at the end of 2019 to more than 830 heading into 2025. This includes over 100 new store openings in 2024 alone, placing it among the top QSR chains for year-over-year visit growth. The chain’s ability to maintain exceptional performance while scaling rapidly highlights its strong foundation and operational strategy.
7. Life Time
While Life Time has fitness at its core, it has also expanded to become a lifestyle. Healthy living is its mantra and this extends to both the gym aspect, but also the social health of its members with offerings like yoga, childcare, personalized fitness programs, coworking, and even an option for luxury living just steps away.
With all these choices, it’s no wonder that its members are more loyal than others in its peer group.
8. Barnes & Noble
To the delight of book lovers everywhere, Barnes & Noble is back in force. With a presence in every single state and approximately 600 stores, location options are growing to browse bestsellers, chat with in-store bibliophiles, or grab a latte. Stores are feeling cozier and more local, with handwritten recommendations across the store. The chain’s extensive selection of gifts and toys mean that one can stop in for more than just books. The membership program is also relaunching, rewarding members for their purchases. Even though some locations have downsized, efficiency is up with average visits per square foot increasing over the last 3 years. Customers are also lingering, with nearly 3 in 10 visitors staying 45 minutes or longer.
With options for a “third place” that’s not home or work dwindling, Barnes & Noble is poised to fill that hole.
9. H Mart
From its origins as a corner grocery store in Queens, NY 42 years ago, H Mart now boasts over 80 stores throughout the US. Shoppers are enticed by the aroma of hot roasted sweet potatoes wafting through the store, the opportunities to try new brands like Little Jasmine fruit teas, and the array of prepared foods such as gimbap and japchae. In addition to traditional Korean, Chinese, and Japanese groceries, H Mart’s assortment has expanded to staple items and American brands as well like Chobani yogurt or Doritos.
As the Hallyu wave sweeps across the nation and K-pop stars like Rose top the charts for the eight straight week with the catchy “APT”, so too is the appetite for Asian food. At the second-most visited H Mart in the nation in Carrollton, TX, the ethnic makeup of customers is 39% White, 14% Black, 23% Hispanic or Latino, and 20% Asian – reflecting the truly universal appeal of this supermarket chain.
10. Bluemercury
Beauty retail had a transformative 2024, with a general cooling off in demand for the category. Competition between chains has increased and delivering quality products, expertise and services is critical to maintain visits. Against this backdrop, Bluemercury stands out as a shining star in parent company Macy’s portfolio of brands, with the brand well positioned to take on this next chapter of beauty retail.
Bluemercury’s success lies in its ability to be a retailer, an expert, and a spa service provider to its consumers. Placer data has shown that beauty chains with a service and retail component tend to attract more visitors than those who just specialize in retail offerings, and Bluemercury is no exception. The chain also focuses solely on the prestige market within the beauty industry and caters to higher income households compared to the broader beauty category; both of those factors have contributed to more elastic demand than with other retailers.
Bluemercury’s bet on product expertise and knowledge combined with a smaller format store help to foster a strong connection between the beauty retailer and its consumers. The brand overindexes with visitors “seeking youthful appearance” and has cemented itself as a destination for niche and emerging beauty brands. As the larger Macy’s brand grapples with its transformation, Bluemercury’s relevance and deep connection to its consumer base can serve as an inspiration, especially as the beauty industry faces mounting uncertainty.
3 Potential Surprises for 2025
1. Starbucks
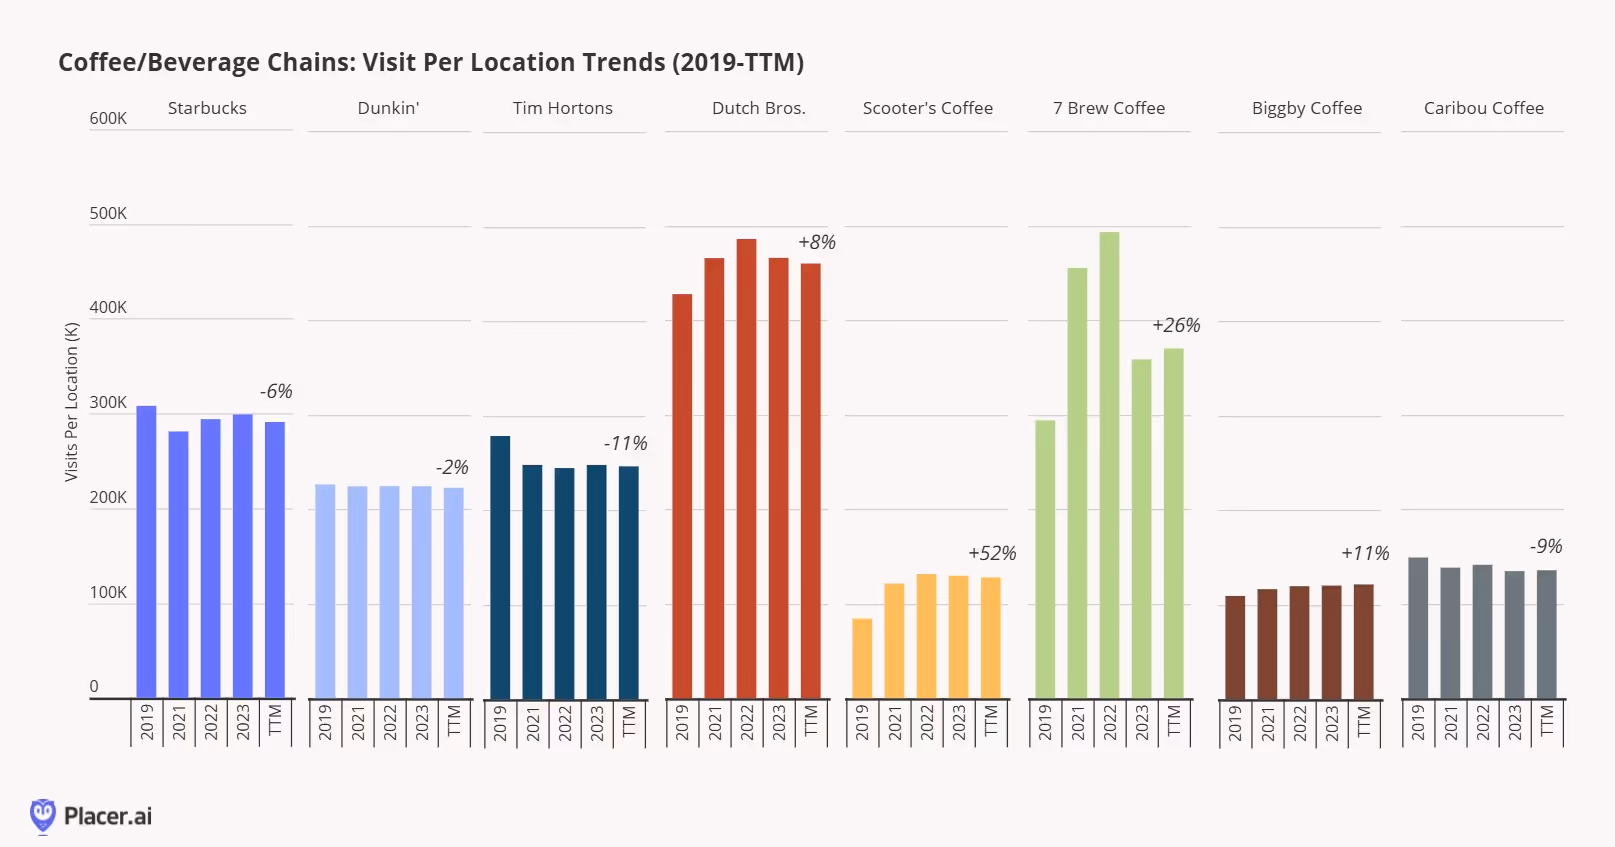
Competitors like Dutch Bros and 7Brew are on the rise, critical office visitation patterns remain far behind pre-pandemic levels, and the chain did not end the year in the most amazing way in terms of visit performance. But there is still so much to love about Starbucks – and the addition of new CEO Brian Niccol positions the coffee giant to rebound powerfully.
The focused attention on leaning into its legendary ‘third place’ concept is in excellent alignment with the shift to the suburbs and hybrid work and with audiences that continue to show they value experience over convenience. But the convenience-oriented customer will likely also benefit from the brand’s recent initiatives, including pushes to improve staffing, mobile ordering alignment and menu simplification. In addition, the brand is still the gold standard when it comes to owning the calendar, as seen with their annual visit surges for the release of the Pumpkin Spice Latte or Red Cup Day and their ability to capitalize on wider retail holidays like Black Friday and Super Saturday.
The combination of the tremendous reach, brand equity, remaining opportunities in growing markets and the combined ability to address both convenience and experience oriented customers speaks to a unique capacity to regain lost ground and drive a significant resurgence against the expectations of many.
2. Adidas
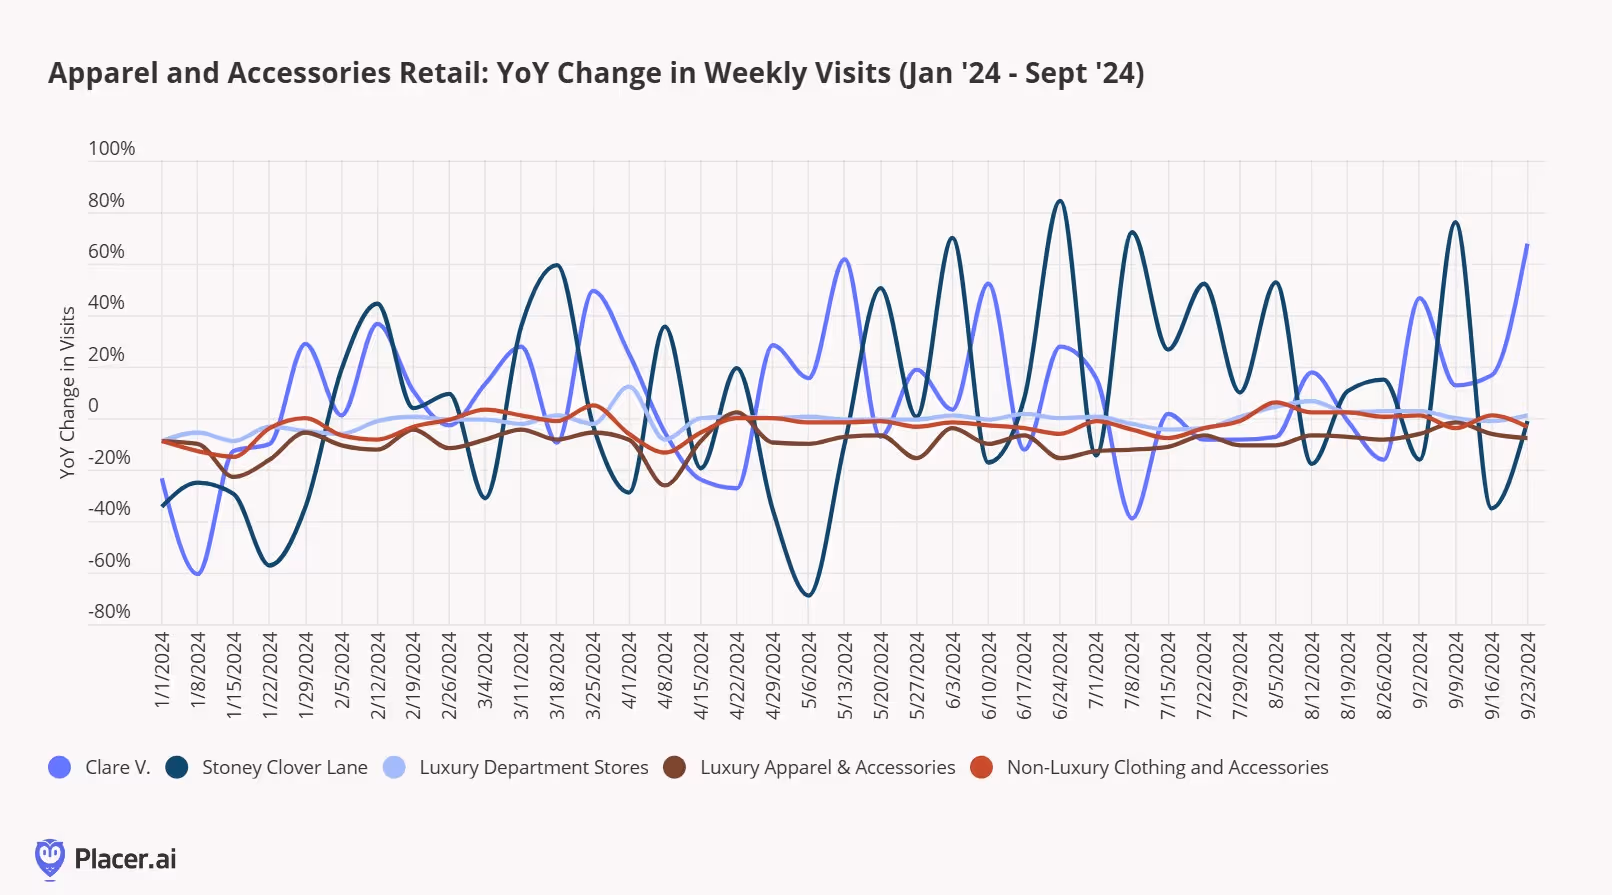
Retail has had its challenges this year, with many consumers opting for off-price to snag deals – but the strength of the Adidas brand should not be underestimated. Gazelles and Sambas are still highly coveted, and a partnership with Messi x Bad Bunny racked up over a million likes. Consumers are favoring classic silhouettes across both shoes and clothing, and nothing says classic like those three stripes.
3. Gap Inc.
Gap, and its family of brands including Old Navy and Banana Republic, are synonymous with American apparel retail. The namesake brand has always been at the center of comfort, value and style, but over time lost its way with consumers. However, over the past year and a half, the reinvigoration of the Gap family of brands has started to take shape under the direction of CEO Richard Dickson.
New designs, collaborations, splashy marketing campaigns and store layouts have taken shape across the portfolio. While we haven’t seen a lot of change in visitation to stores over the past year, trends are certainly moving in the right direction and outpacing many other brands in the apparel space. Gap has also reinserted itself into the fabric of American fashion this past year with designs for the Met Gala.
The benefit of Gap Inc.’s portfolio is that each brand has a distinct and unique audience of consumers that it draws from. This allows each brand to focus on meeting the needs of its visitors directly instead of trying to be all things for a broader group of consumers. Old Navy in particular has a strong opportunity with consumers as value continues to be a key motivator.
Gap has done all of the right things to not only catch up to consumers’ expectations but to rise beyond them. Even as legacy store-based retail brands have seen more disruption over the past few years, Gap is ready to step back into the spotlight.
Variety of Paths to Success in 2025
The diversity of brands featured in this report highlight the variety of categories and strategic initiatives that can drive retail and dining success in 2025.
Sprouts’ focus on quality products and small-format stores, CAVA’s rise as a suburban dining powerhouse, and Nordstrom’s commitment to customer experience all highlight how understanding and responding to consumer needs can drive success. Brands like Ashley Furniture, Sam’s Club, H Mart, and Life Time have shown how offering a unique value proposition within a crowded segment, leveraging loyalty, and creating memorable experiences can fuel growth. And Raising Cane’s demonstrates the power of simplicity and operational efficiency in building momentum.
At the same time, niche players like Bluemercury are excelling by catering to specific audiences with authenticity and expertise. And while Starbucks, Adidas, and Gap Inc. face challenges, the three companies’ brand equity and revitalization efforts suggest potential for a significant comeback.


.svg)