DC residents and businesses have been on tenterhooks ever since plans were announced in December 2023 to move the Caps and Wizards to Potomac Yard in Alexandria, VA. Original plans called for a new Wizards practice facility, a separate performing arts center, a media studio, new hotels, a convention center, housing and shopping. Meanwhile, DC mayor Muriel Bowser worked furiously to keep the teams, eventually putting together a $500 million+ deal that was officially approved in the last week, so that the teams would stay in the District until “at least 2050.” That is good news for those businesses by Gallery Place/Chinatown, and the teams can keep the Washington moniker, as opposed to potentially being the “National Landing” teams were they to have moved to the Potomac Yard area.
Migration to the Mountain States has been on an upward trend in recent years. And one state in particular – Utah – has received an impressive influx of new residents. Which areas are experiencing the most growth? And what is driving migration to the Beehive State? We take a closer look.
Bracha Arnold
Apr 4, 2024
4 minutes
Migration to the Mountain States, named for the sprawling Rocky Mountain range that runs through the region, has been on an upward trend in recent years. And one state in particular – Utah – has received an impressive influx of new residents.
Which areas are experiencing the most growth? And what is driving migration to the Beehive State? We take a closer look.
Key Takeaways
Relocators to Utah are coming from states with a lower HHI and higher age compared to the Utah median.
Not all metro areas are benefiting equally from Utah’s migration boom: Between January 2020 and January 2024, net migration to the Provo-Orem and Ogden-Clearfield CBSAs was positive, while net migration to the Salt Lake City CBSA was negative.
Provo-Orem and Ogden-Clearfield receive newcomers from areas with a lower median HHI and similar median age as Salt Lake City.
Utah Is Younger and Wealthier Than its Feeder States
Utah, with its iconic national parks and burgeoning tech industry, is growing fast. According to Placer.ai’s Migration Trends Report, Utah experienced an 5.5% rise in population between January 2020 and January 2024, partially driven by inbound domestic migration: 1.8% of the state’s January 2024 population moved in between January 2020 and January 2024.
Utah has a relatively young population – the median age in Utah (according to the 2021 ACS 5-Year Projection dataset) is 31. But relocators to the state seem to be coming from older states – the weighted median age in the states of origins of newcomers moving to Utah over the past four years was 38.
But although Utah’s median age is lower than the median age in the states of origin, the median HHI in the Beehive State is higher than in its feeder states. Between January 2020 and January 2024, the weighted median HHI in the states feeding migration to Utah was $71K/year, lower than the Utah median of $79K/year (although higher than the national average of $69.0K/year).
Provo-Orem and Ogden-Clearfield Receive Largest Migration Boost
Although Utah as a whole has seen positive net migration over the past four years, the new residents are not evenly distributed across the state’s major metropolitan areas. Inbound domestic migration was particularly strong in the Provo-Orem and Ogden-Clearfield CBSAs (core-based statistical areas), with both states also seeing significant increases in their population (10.7% and 5.1%, respectively) over the past four years. But during the same period, the migrated share of the population of Utah’s largest CBSA – Salt Lake City – has declined, and the overall population in the Salt Lake City CBSA grew by just 1.0%. So what is driving migration to Provo-Orem and Ogden-Clearfield?
Younger People from Lower Median HHI Areas Moving to Provo & Ogden
January 2020 to January 2024 migration data reveals that relocators to Provo and Ogden come from CBSAs with a lower median age and HHI compared to those moving to Salt Lake City: Newcomers to the Provo-Orem and Ogden-Clearfield CBSAs came from CBSAs with a weighted median HHI of $73K and $72K, respectively, compared to a $75K median HHI for CBSAs feeding migration to the Salt Lake City CBSA. And the weighted median age in the CBSAs of origin for Provo-Orem and Ogden Clearfield was 25 and 32, respectively, compared to 33 in the CBSAs of origin for Salt Lake City.
Niche’s Neighborhood Grades – available in the Placer.ai Marketplace – assigns grades to various types of regions based on a variety of factors, including job opportunities. And comparing the Niche rating for “Jobs” assigned to Utah’s three largest CBSAs with the aggregate “Jobs” grade assigned to the CBSAs of origin also suggests that Provo and Ogden’s economic opportunities are driving migration to these smaller metro areas.
All three Utah CBSAs analyzed received a higher “Jobs” grade than their CBSAs of origin – indicating that the employment opportunities in all three metro areas are likely drawing newcomers. But while Salt Lake City only got a “B+” in “Jobs” – just one grade up from the aggregate grade assigned to its areas of origin – Provo-Orem and Ogden-Clearfield got a “Jobs” grade of “A-”, or two notches up from the “Jobs” grade in their CBSAs of origin. The highly robust job markets in these smaller CBSAs may explain why newcomers seem to prefer Provo-Orem and Ogden-Clearfield to Salt Lake City.
Utah-ly Amazing
Utah’s population growth makes it one of the most exciting states to watch, and the state’s promising employment opportunities seems to be a major draw for newcomers to the state.
Will Utah continue to experience population growth?
Visit placer.ai to keep up with the latest migration trends.
This blog includes data from Placer.ai Data Version 2.0, which implements improvements to our extrapolation capabilities, adds short visit monitoring, and enhances visit detection.
Many brands are turning to experiential retail to draw visitors into brick-and-mortar stores. We take a look at three companies with different types of experiential offerings – Michaels, DICK’S, and Lowe’s Home Improvement – to understand what experiential retail can look like in 2024.
Bracha Arnold
Apr 3, 2024
5 minutes
In a world where convenience is key and online shopping reigns supreme, many brands are turning to experiential retail to draw visitors into brick-and-mortar stores. We take a look at three companies with different types of experiential offerings – Michaels, DICK’S, and Lowe’s Home Improvement – to understand what experiential retail can look like in 2024.
Key Takeaways:
Experiential retail can take many different forms.
Some retailers – including DICK’s – are designing entire venues as immersive hubs, with others – like Lowe’s – are adding experiential zones to their regular stores.
Companies can also empower customers to create their bespoke in-store experience.
DICK’S: Elevating The Sporting Experience
Some retailers are encouraging consumers to engage fully in their brand by dedicating entire brick-and-mortar venues entirely to immersive experience. Sporting goods brands in particular, including Lululemon with its yoga studios and Nike and its training studios, have employed this strategy to directly engage with their core audience. And perhaps the best example of this is the DICK’S House of Sport concept, launched in 2021 by sporting goods retailer DICK’S.
DICK’S currently operates 12 House of Sports locations where visitors can repair their bikes, pick out a golf club, use a climbing wall or batting cage. The concept has been highly successful, especially as more people engage in some form of recreational sports or fitness activities, and the chain is looking to add at least 100 more of these experiential stores in the next five years.
Quarterly foot traffic patterns suggest that the new locations will be met with enthusiasm. Visits to the three longest-running House of Sports stores in Q4 2023 were 7.2% higher than they were in Q4 2022, while visits to DICK’S Sporting Goods stores nationwide were 2.3% lower for the same period. Psychographic data also reveals that House of Sport visitors also tend to be slightly older and more established than visitors to DICK’S nationwide – and this older audience may be more inclined to spend more than their younger counterparts.
By creating an immersive athletic experience that taps into the growing popularity of personal fitness, House of Sport can continue to draw in visitors and foster community – and serve as a model for other sporting goods retailers looking to expand their experiential offerings.
Lowe’s: Empowering DIY Enthusiasts
Retailers who don’t want to devote an entire location to their experiential offering can also leverage their regular venues to offer visitors hands-on engagement with their products on certain days or time slots. Rising costs have led more people than ever to turn to DIY – and meeting that demand, leading home improvement retailer Lowe’s has introduced a DIY workshop on Saturdays and Sundays at 100 locations across the country. Visitors heading to participating Lowe’s stores will be able to participate in workshop stations and take advantage of all-day demos – with no registration required. The company also runs a family-friendly Weekending at Lowe’s program, which allows visitors to register to free workshops focused on child-friendly activities, such as creating a butterfly biome or a tabletop basketball game
Providing people with a hands-on, practical approach to home repairs may help Lowe’s expand its customer base as more people embrace DIY concepts. Participants in the DIY workshops may feel more confident in tackling new projects at home. They are also more likely to choose Lowe’s products due to familiarity with the store and its offerings — a win for the company.
Comparing year-over-year (YoY) visits at Lowe’s locations with DIY workshops to the foot traffic performance of the chain as a whole indicates that the DIY venue, while experiencing the effects of the ongoing retail headwinds, are managing to perform better than Lowe’s stores overall. And analyzing locations using the Spatial.ai: PersonaLive dataset reveals that Lowe’s DIY stores are particularly popular among rural segments, with more "Rural Average Income" and "Rural Low Income" segments in their captured markets than their potential market*.
*A chain’s potential market refers to the population residing in a given trade area, where the Census Block Groups (CBGs) making up the trade area are weighted to reflect the number of households in each CBG. A chain’s captured market weighs each CBG according to the actual number of visits originating to the chain from that CBG.
Lowe’s can harness this data if it seeks to expand the DIY concept further to help it capitalize on its success among rural audiences – and other retailers can take note of the demand for hands-on workshops from this segment.
Michaels: Embracing Family Fun
A third model for experiential retail empowers the customer to take the reins and decide when to schedule the in-store event – and who to add to the guest list. Craft chain Michaels, which has long emphasized child-friendly experiences like summer camps and free classes, recently introduced store-hosted birthday parties for kids up to age 13.
Demographic data from both potential and captured trade areas suggest that this focus on kids activities is succeeding in attracting the family households in its trade area. Michaels attracts a larger share of married couples with children in its captured market than in its potential market, and has a captured market household size of 2.6, slightly larger than its potential market household size. The share of households in Experian: Mosaic’s “Suburban Style,” “Flourishing Families”, and “Family Union” segments were also all higher in Michaels captured market than in its potential market.
Michael’s seems to be positioning itself as a one-stop shop for crafters of all ages, and focusing on children’s events may help the chain attract more family segments to its stores. This serves as a reminder of the draw that quality children’s entertainment can provide and offers a blueprint for retailers wishing to attract more families to their locations.
Experience Is Everything
These three chains prove that there are plenty of ways to attract people into brick-and-mortar stores. By offering workshops, events, and in-store attractions, the three chains are building brand awareness and increasing their foot traffic.
Will experiential retail continue to dominate in 2024?
Visit placer.ai/blog to stay up-to-date on the latest retail trends.
This blog includes data from Placer.ai Data Version 2.0, which implements improvements to our extrapolation capabilities, adds short visit monitoring, and enhances visit detection.
One of the major stories of 2023 was the rise in food prices, and the increasing costs of food and other goods have helped discount grocers thrive. We checked back in with two bargain grocers – Aldi and Lidl – to see how they’re doing.
Bracha Arnold
Apr 2, 2024
4 minutes
One of the major stories of 2023 was the rise in food prices, with costs up roughly 25% since 2020 – and the increasing costs of food and other goods have helped discount grocers thrive.
We checked back in with two grocery chains known for their bargain prices and private labels – Aldi and Lidl – to see how they’re doing.
Key Takeaways:
Visit numbers to Aldi and Lidl continue to grow year-over-year.
Despite Aldi and Lidl’s similar merchandising strategies, the two chains serve different audiences.
Lidl’s visitors tend to come from higher-income areas with larger household sizes compared to Aldi.
Low-Cost Leaders
Aldi offers prices that rival those of discount grocers, making it a major player in the discount grocery segment. And these attractive prices have helped the company see significant visit growth over the past few years. Year-over-year (YoY) monthly visits to Aldi were up throughout 2023 and into 2024, with some of the growth due to the chain’s aggressive expansion. And the company plans to grow even further – Aldi has announced plans to open another 800 stores over the next few years.
Lidl – another German-based grocer – opened its first location in Virginia in 2017. The chain currently has around 170 locations in the country, primarily on the East Coast, and is also expanding – albeit at a slower pace. Between February 2023 and February 2024, YoY visits to Lidl were up almost every month with only a slight dip in January 2024 – perhaps due to the unseasonal cold – a promising sign for the discount grocer as more consumers than ever choose low-cost food options.
Similar Value, Different Visitors
Although both Lidl and Aldi are German-owned discount grocers, examining the demographics for the two brands' tradeareas nationwide sheds light on the differences between the two chain’s consumer bases.
Analyzing the trade area median HHI reveals that Lidl attracts a higher-income clientele than Aldi: The median household income (HHI) in Aldi’s trade area was slightly lower than the the nationwide median, with the median HHI in the chain’s captured market even lower than the median HHI in its potential market. This indicates that Aldi locates its stores in areas that are accessible to the average consumer and succeeds in attracting also the slightly lower income segments within its potential trade area.
Meanwhile, Lidl’s potential market median HHI stood at $78.8K/year in 2023, and the median HHI in its captured market was even higher – $88.1K/year – indicating that Lidl stores are located in more affluent areas, and that the company caters to the wealthier households within those neighborhoods.
The share of households with children in Aldi’s potential and captured market was also almost identical to the nationwide average – indicating once again Aldi’s success in reaching the average U.S. grocery shopper. Lidl, on the other hand, saw more households with children in both its captured and potential markets, with the share of households with children in its captured market around two percentage points higher than the share of households with children nationwide. So while Aldi and Lidl do share some similarities in terms of origins, preference for private label, and pricing, the trade area analysis points to major differences between the two chains’ audiences.
*A chain or venue’s potential market refers to the people that reside in its trade area, based on the business’ True Trade Area and weighted by census block group (CBG) within the trade area according to the size of its population. Captured markets represent the population that visits the business in practice, and the data is obtained by weighting each CBG according to its share of visits to the chain or venue in question.
Similar Concepts, Different Customer Bases
Diving into the psychographic data for Aldi and Lidl adds another dimension to the trends revealed by the demographic data. While both brands are popular among suburban audiences – Aldi tends to attract a more blue-collar customer, while Lidl is frequented by a wealthier suburban segment. The share of visitors falling into the “Small Town Low Income” category was 7.5% for Aldi compared to 0.9% for Lidl. Conversely, Lidl saw 16.7% of its visitors falling into the “Upper Suburban Diverse Families” segment, while Aldi had 10.6% of its consumers in that category.
And while Aldi and Lidl have a hold on different suburban segments, the chains’ expansion strategies seem geared to grow each chain’s reach outside the other’s orbit. Lidl has been opening stores in big cities along the East Coast, including New York City’s tony Chelsea neighborhood, perhaps in a bid to reach more of the wealthier customers that favor the brand. Aldi, meanwhile, recently acquired grocery chains Winn-Dixie and Southeast Grocers, brands that typically attract a more price-sensitive consumer. This acquisition will significantly expand Aldi’s presence and will likely appeal to value-oriented shoppers, a segment already receptive to its offerings.
Room For Everyone
The past few years have seen the grocery space adapting to an increasingly value-oriented consumer, and Aldi and Lidl have benefitted from this shift. As inflation cools and both companies expand their footprints, will they continue on their upward trajectory?
Follow Placer.ai’s data-driven retail analyses to find out.
This blog includes data from Placer.ai Data Version 2.0, which implements improvements to our extrapolation capabilities, adds short visit monitoring, and enhances visit detection.
Texas has been a favored destination for Americans relocating from major population centers - but which metro areas are attracting new residents? Are people moving to major cities like Dallas, Houston, Austin, and San Antonio, or are they heading out to the suburbs? We take a closer look.
Lila Margalit
Apr 1, 2024
3 minutes
Since COVID, millions of Americans have relocated from major population centers in California, New York, and Illinois (among others) to other regions of the country. Whether in search of job opportunities, affordable housing, or simply a change of scenery, thousands of people have decamped to places like Tampa, Florida, Bozeman, Montana, and Portland, Maine. And the great state of Texas – with its wide open spaces and relatively affordable cost of living – has emerged as a favored destination.
So with 2024 underway, we dove into the data to explore domestic migration trends in the Lone Star State. How much has the population of Texas grown as a result of domestic migration over the past several years – and which metro areas (CBSAs) are attracting new residents? Are people moving to major cities like Dallas, Houston, Austin, and San Antonio, or are they heading out to the suburbs?
Bigger is Better in the Lone Star State
Between December 2019 and December 2023, Texas’ population grew by 4.3% – with nearly a third of this increase driven by new residents hailing from elsewhere in the U.S.
Perhaps unsurprisingly, many of these new arrivals made a bee-line to Texas’ four most populous metropolitan areas – Austin-Round Rock-Georgetown, San Antonio-New Braunfels, Dallas-Fort Worth-Arlington, and Houston-The Woodlands-Sugar Land. During this time period, each of these CBSAs experienced positive net migration (meaning that more people moved to these areas than away from them) ranging from 0.4% to 3.4%.
All Hat and No Cattle?
But a deeper analysis of foot traffic trends reveals that, even as the CBSAs as a whole added new residents, the primary cities anchoring the CBSAs often lost more domestic migrants than they gained. Austin proper lost 6.1% of its population to relocation, while Dallas, Houston, and San Antonio lost 4.2%, 3.9%, and 3.2%, respectively. Only Fort Worth – Texas’ fifth-most-populous city – experienced positive net migration over the past four years.
An Urban / Suburban Divide
Why are major metropolitan areas seeing population influxes, even as their central urban hubs experience outflows? Drilling down even deeper into zip-code level location intelligence provides a striking snapshot of what’s actually happening on the ground.
In all four CBSAs, zip codes belonging to the metro area’s flagship city were more likely to experience negative net migration – while those in further-away suburbs and towns were more likely to see positive inflow.
The relative growth experienced by Fort Worth can be understood against this backdrop: Fort Worth may be one of Texas’ biggest cities, but it is smaller – and less expensive – than Dallas, which dominates the metro area.
Suburban life offers residents many of the benefits of proximity to major urban centers, without some of the drawbacks – like smaller homes. And with more Americans free today to live further away from the office, many appear to be choosing suburban chill over big-city hassle.
Key Takeaways
Home to the Alamo, a premier state fair, and arguably one of the cultiest grocery chains in the country (H-E-B, of course), Texas has become a key destination for Americans seeking greener (and cheaper) pastures. And though major metropolitan centers in the Lone Star State have seen significant positive net migration over the past four years – much of that growth has taken place outside of the state’s biggest cities.
How will Texas’ population continue to evolve over the next months and years? Will big cities make a comeback – or are suburbs and smaller towns poised to remain the main drivers of growth?
Follow Placer.ai’s data-driven domestic migration analyses to find out.
This blog includes data from Placer.ai Data Version 2.0, which implements improvements to our extrapolation capabilities, adds short visit monitoring, and enhances visit detection.
Brands like M&Ms, Hershey’s, and Jelly Belly are redefining what it means to be as happy as a “kid in a candy store.” With their life-size M&M characters on a flagship in Orlando, FL, a chocolate Statue of Liberty sculpted out of 800 pounds of Hershey’s chocolate on the Las Vegas Strip, or a working jellybean factory tour in Fairfield, CA, manufacturers are literally bringing their brands to life. M&M’s World in Orlando, FL posted particularly impressive year-over-year visits in the second half of 2023.
Recently, Hollywood darling Timothee Chalamet starred in the fantastical movie Wonka, grossing $600M+ worldwide. In other headline news, the “tried to jump on the wagon but failed miserably” fiasco of the unauthorized Willy’s Chocolate Experience in Scotland reveals that the appetite for sweets and chocolate is insatiable. Never fear, if you missed the Candytopia pop-up a few years ago, you can head over to Dylan’s Candy Bar for an experience right out of Charlie and the Chocolate Factory. It’s clear that demand peaks in the summer, probably due to locations that see summer tourists. The holidays are another popular season for buying sweets.
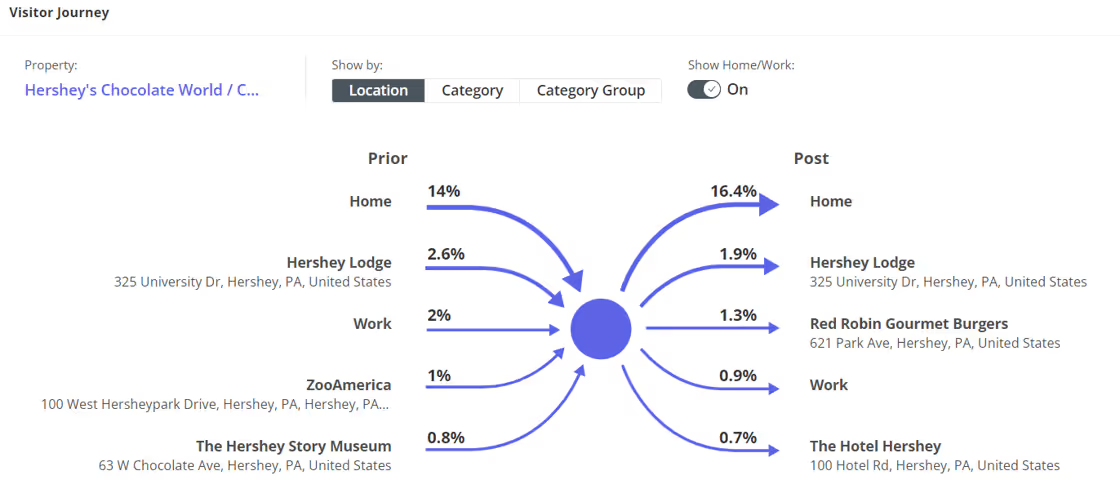
At Hershey’s Chocolate World, one can be immersed in all-things chocolate, from creating your own candy to taking a selfie with a life-size Reese’s peanut butter cup. The dessert options are limited only by your imagination. That tower of S’mores sure looks tempting!
Many visitors also opt to visit the Hershey Story Museum or stay at Hershey Lodge or the Hotel Hershey.
If you prefer your sweets in liquid form, there are three Coca-Cola Stores--in Atlanta, Las Vegas, and Orlando--to satisfy your cravings. Here, you can buy a Coke plushie, flout the famous “Enjoy Coca-Cola” slogan shirt in a variety of languages, or dress yourself head-to-toe in comfy Coke PJs. One of the coolest options is an international tasting flight that lets you try out Coca-Cola beverages from around the world, with flavors like sparberry from Zimbabwe.
At the Coca-Cola Store in Orlando, FL, visitation jumps during vacations like Spring Break, summer, and Christmas holidays.
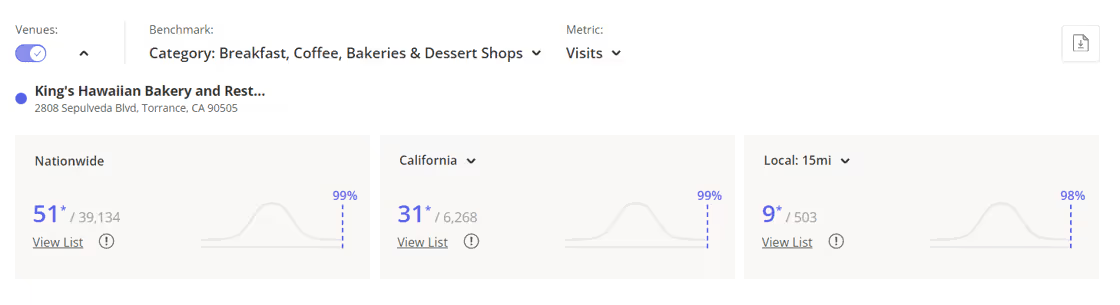
Another beloved brand that has made its way into brick-and-mortar is King’s Hawaiian. Founded in 1950, they were famous for their round loaves of sweet and fluffy Hawaiian bread. Fast forward three-quarters of a century later, and they have added new options like savory dinner rolls or pull-apart pans of bread. One can experience gastronomic delights made with Hawaiian bread at their Torrance-based King’s Hawaiian Bakery and Restaurant.
The restaurant menu includes breakfasts featuring their famous King’s Hawaiian Sweet Bread as French toast, lunch and dinner options like Macadamia Nut Onion Rings, Chicken Katsu Curry Loco Moco, and Saimin noodles, but it’s the bakery that literally takes the cake. The Paradise Delight Cake has three layers of chiffon cake in enticing flavors like guava, passionfruit, and lime. It is then topped with layers of fresh strawberries, peaches, and kiwis. One can also choose from chocolate, coconut, pineapple, raspberry cakes, and more.
With Placer's ranking of "Breakfast, Coffee, Bakeries, and Dessert Shops" indicating that King's is in the top 1% nationwide and statewide, it looks like they've found a sweet recipe for success.
How shifting consumer priorities are reshaping value perceptions across QSR, fast casual, and casual chains.
July 9, 2026
The New Definition of Value
As consumer sentiment hovers near historic lows and the cost of goods remains elevated, value has become a defining theme across the dining industry. Yet within the sector's diverse restaurant categories – and for individual brands – the question is no longer whether consumers are seeking value, but what value actually means. A closer look at chains across the industry suggests that, amid ongoing economic pressure, perceptions of value are evolving. For some consumers, value may be tied to affordability and promotions; for others, it may come from quality, convenience, or experience. The result is a market with multiple paths to winning consumer traffic.
Dining Traffic Remains Unstable in 2026
After an uneven but largely resilient 2025, dining traffic in 2026 tipped into a sustained decline.
Monthly visits to the overall dining industry have trailed year-ago levels throughout 2026, with February standing as the lone exception. That month saw a 3.7% year-over-year (YoY) increase in visits, driven in part by comparisons to the period of initial tariff announcements in early 2025. But broader trends remained challenged, and May's 2.5% YoY decline marked the steepest monthly drop of the past twelve months as rising gas prices and weakening consumer sentiment appear to have added pressure to an industry already navigating a difficult environment.
Breaking Down the Industry
These headwinds, though, have not landed evenly. Across the dining sector, some segments have faced more intense pressure than others, with much of the divide coming down to how consumers are perceiving value against experience.
QSR’s Value Proposition Under Pressure From Grocery Stores & Superstores
Over the past several years, inflation and rising menu prices have gradually weakened a cost-based value proposition that has long been central to the QSR segment. More recently, elevated gas prices have added another deterrent, making a trip through the drive-thru a less compelling choice for some consumers.
Strong performance at grocery stores and superstores suggests that competition for share-of-stomach is increasingly extending beyond traditional restaurant rivals. With expanding selections of ready-to-eat and pre-prepared meals, these channels are offering consumers a combination of value, convenience, and quality that can increasingly match limited-service dining options. At the same time, ongoing pressure on household budgets appears to be driving more consumers toward lower-cost meals made at home, creating additional headwinds for the QSR segment.
Fine Dining and the Fast Casual Middle Hold Firm
Yet for many consumers, there is still a time and place for dining out, and in the face of mounting economic pressure, several dining formats have found foot traffic success. Fine dining has posted traffic growth in nearly every month of 2026, with March standing as the lone exception. That decline was likely influenced by a calendar shift, as March 2026 contained one fewer Saturday than March 2025 – a meaningful headwind for full-service restaurants given the outsized role weekends play in driving visits. The segment's sustained growth points to the resilience of higher-income consumers and the enduring appeal of premium, occasion-driven dining experiences.
Fast casual and casual dining have also proven relatively resilient. The fast casual category saw positive YoY foot traffic in every month of 2026 so far, while casual dining's performance has rebounded since the March calendar shift that likely weighed on YoY traffic. A second calendar shift in May 2026 led to an extra Saturday in the month, which likely helped the segment's overall trend. These trends suggest that both fast casual and casual dining occupy an increasingly attractive middle ground where value is defined as a combination of affordability and experience. At the same time, years of menu price hikes at QSR chains have altered the cost equation in fast casual and casual dining's favor, narrowing the price gap between fast food and more elevated dining formats. As that gap has narrowed, consumers may be placing greater emphasis on experience and quality when deciding where to dine.
Inside the Playbooks of Fast Casual Standouts
The balance between price and elevated experience has made fast casual a favorite for value in the dining industry in 2026. A closer look at two of the segment's largest players, CAVA, a relatively young concept, and Chipotle, a legacy chain navigating operational challenges, shows how brands can deliver on that value proposition in different ways and win in today’s dining landscape.
Chipotle Creates Value With LTO Experiences and Loyalty Perks
Chipotle's traffic trends in 2026 have improved compared to 2025, with the brand offering a clear example of how fast casual brands can create value by pairing menu innovation with loyalty perks.
Chipotle outpaced the broader fast casual category in YoY visits nearly every week of 2026 so far. And the graph below shows that the chain's strongest traffic gains tended to coincide with major menu launches and loyalty initiatives – a key component of its ongoing "Recipe for Growth" strategy.
The return of fan-favorite Chicken al Pastor in the week of February 9, 2026 helped drive a 16.6% YoY increase in visits. Two months later, the launch of "Rewards on Repeat" – a refreshed loyalty program offering freebies upon sign-up – generated the period's largest weekly traffic gain, with visits rising 18.2% YoY. And the introduction of Honey Chicken on April 28 provided another boost, as the chain continued to rotate limited-time protein offerings and give customers reasons to return.
These performance peaks suggest that Chipotle has been particularly effective at pairing menu novelty with loyalty perks to reinforce a value proposition anchored by quality and experience.
Chipotle's "Recipe for Growth" Drives Traffic With Loyalty and LTO Launches
Year-over-Year Change in Weekly Visits, Chipotle vs. Fast Casual, Jan.–Jun. 2026
ChipotleFast Casual
Dashed lines mark key Chipotle promotional launch dates. Week-of dates shown; launches may have occurred mid-week.
Share
Embed:
CAVA Expansion and Differentiated Dining Experience
If Chipotle illustrates the power of menu innovation and loyalty-driven engagement, CAVA highlights a different approach to creating value – one rooted in variety, customization, and a consistently differentiated dining experience.
CAVA's overall visits climbed well above 20% YoY in every month of 2026, a pace largely driven by aggressive unit expansion. Meanwhile, same-store visits, which measure traffic at locations open for at least twelve months, sustained positive YoY growth – evidence of genuine demand at existing restaurants alongside a rapidly growing footprint.
While Chipotle leans on limited-time offers, CAVA's growth rests on a consistent, customizable experience. A deep roster of proteins paired with a wide range of bases, dips, and toppings, gives the chain built-in variety that helps keep the concept feeling fresh. In addition, CAVA's Mediterranean-inspired menu offers flavors and combinations that are less easily replicated at home, helping the brand maintain a differentiated experiential value proposition and drive growth.
O Though Chipotle and CAVA are at different points in their evolution and have taken different paths to growth, both highlight the enduring appeal of fast casual's balance of value and quality. In a dining environment where consumers are increasingly weighing cost against experience, the segment's ability to deliver on both has helped make it one of the industry's strongest-performing formats.
Casual Chains Thrive On Everyday Value
Fast casual isn't the only dining segment benefiting from consumers' evolving perception of value. In 2026, several casual dining chains have found success by pairing accessible price points with the elevated experience of a sit-down meal.
Brands such as BJ's Restaurant & Brewhouse, Chili's Grill & Bar, Bonefish Grill, Cicis, and The Cheesecake Factory all posted positive YoY visit growth in multiple months this year, demonstrating that even in a challenging economic environment, diners are motivated when they feel they are getting more in return. These results are particularly notable given the impact of calendar shifts, which weighed on March 2026 comparisons – and provided a tailwind to May performance.
Unlike many fast casual chains, these brands have not relied heavily on a steady stream of limited-time offers to drive traffic. While menu innovation remains part of the playbook, promotions often serve as ticket builders or engagement tools rather than primary traffic catalysts. Instead, these successful casual dining chains have focused on creating everyday value that diners can depend on, narrowing the price gap between limited-service restaurants and full-service dining.
The result is a value equation that encompasses table service, a more relaxed dining environment, and a place to socialize or celebrate an occasion. In an environment where consumers are increasingly weighing cost against overall experience, that combination appears to be helping several casual dining chains maintain positive traffic momentum.
The State of Dining in 2026
Although dining traffic has softened in 2026, the industry's performance suggests that consumers have not stopped spending on restaurants altogether. Instead, they have become more selective about where they dine and what they expect in return.
Across segments, the strongest performers have found different ways to deliver value. For some brands, that means menu innovation, loyalty engagement, and differentiated experiences. For others, it means dependable affordability paired with the service and atmosphere of a sit-down meal. As economic pressures continue to shape consumer behavior, the data suggests that value is no longer defined by price alone, but by the balance of cost, convenience, quality, and experience.
Find out where Americans are moving in 2026, why they're relocating, and how developers, investors, and retailers can stay ahead of the trends.
June 18, 2026
The Geography of Domestic Migration
During the pandemic and its aftermath, Americans were on the move. Millions left expensive coastal markets for lower-cost destinations across the Sun Belt, while boomtowns such as Bozeman, Boise, and Austin struggled to keep pace with the influx of new residents.
That wave of relocation has since cooled, as return-to-office mandates, higher mortgage rates, and a shrinking affordability gap between coastal cities and many COVID-era hotspots have dampened the incentive to move. But even in a slower market, domestic migration remains one of the most powerful forces shaping local economies, housing markets, and consumer demand.
This report leverages AI-powered location analytics to examine the relocation patterns reshaping the United States in 2026 – where Americans are moving, the demographic and economic forces driving those decisions, and how retailers, investors, developers, and policymakers can respond to the opportunities and challenges created by these shifts.
Which major metros are attracting the most new residents? Which pandemic-era standouts have seen growth stall or reverse? And what factors best predict a large metro area's domestic migration growth potential in 2026?
Interstate Flows: Which States Gained and Lost Residents?
South Carolina and Delaware Set the Pace
The latest statewide migration data shows that the slower relocation pace observed in 2024 persisted into 2025. No state recorded net inflows or outflows exceeding 0.7% of its starting population. And while several smaller states continued to attract new residents at meaningful rates, none of the nation's six most populous states saw net in-migration exceed 0.2%.
Among those smaller states, South Carolina and Delaware led the nation with net in-migration equal to 0.7% of their populations, followed by Idaho (0.6%), Maine (0.5%), Tennessee (0.4%), and North Carolina (0.3%). For most of these states, migration accelerated relative to 2024, though Delaware's inflow rate moderated slightly and North Carolina held steady.
Despite their differences, these states tend to offer a similar mix of lifestyle amenities, relatively low congestion, and opportunities for growth. Many also benefit from business-friendly climates, favorable taxpolicies, or housing costs that remain attractive relative to the higher-cost markets from which they draw new residents.
Vermont Trails Behind
At the other end of the spectrum was Vermont, which saw the nation’s largest net outflow as share of population in 2025, losing 0.4% of its population to domestic relocation. The decline deepens a reversal that first emerged in 2024, when the state swung to a net loss of 0.2%, after attracting inflows of 0.8% and 0.5% in 2022 and 2023, respectively.
Vermont's reversal likely reflects a combination of factors, including return-to-office mandates and the waning appeal of remote work. Housing undersupply in the state may have alsocontributed, illustrating how important infrastructure investments are to sustaining migration gains over time.
South Carolina, Delaware, and Idaho Lead the Nation in Domestic Migration Growth in 2025
Net Domestic Migration as a Share of Each State's Starting Population, 2025
Net Migration by State
−0.4%0.0%0.7%
Top Migration Magnets
2024
2025
*Analysis for each year is from Jan. – Dec.
Share
Embed:
Florida Sees Accelerated Inflow as Legacy Exodus States Slow Losses
Among the nation's six most populous states, Florida was the only one to see accelerating net in-migration in 2025, attracting new residents equal to 0.2% of its starting population, up from 0.1% the year before. Texas, by contrast, slowed from 0.1% net in-migration in 2024 to essentially flat in 2025, highlighting the cooling of what was once one of the country's strongest pandemic-era migration magnets.
Meanwhile, the legacy "exodus" states continue to lose residents, but at a slower pace than in previous years. Illinois and California have seen their migration deficits steadily narrow, with further improvement in 2025. Between 2022 and 2025, Illinois moved from -0.8% → -0.2% → -0.2% → -0.1%, while California moved from -0.9% → -0.4% → -0.3% → -0.2%. And though New York has held steady at -0.2% over the past two years, this marks a significant moderation from 2022, when the state experienced net outmigration equal to 1.1% of its population.
Major Insights:
Smaller states dominated migration gains in 2025, led by South Carolina, Delaware, Idaho, Maine, Tennessee, and North Carolina.
Vermont posted the nation's largest outflow after attracting strong inflows just a few years earlier.
Florida was the only top-population state to see meaningful net in-migration in 2025.
Texas' migration boom continued to cool, with net in-migration falling to flat in 2025.
Outmigration from New York, Illinois, and California is slowing, but these states are still losing residents overall.
Zooming In: Net Migration Across Metro Boundaries
Statewide trends reveal important shifts, but a closer look at the nation's ten largest metropolitan areas suggests that broader interstate averages increasingly mask diverging local realities. Several metros are attracting residents through interstate domestic migration even when their states as a whole are experiencing little or no net migration growth.
Phoenix (+0.3%), for example, stood out as the nation's top-performing large metro in 2025, despite Arizona's absence from the list of leading migration destinations – with the majority of its inflow coming from out of state.
Dallas (+0.2%) ranked second, continuing its rebound from -0.1% in 2023 even as Texas' statewide migration gains cooled. Like Phoenix, Dallas drew a majority of its new residents from outside the state, underscoring its growing appeal as a national migration destination. Houston, meanwhile, moved in the opposite direction, falling from 0.1% net in-migration in 2023 to -0.1% in 2025. While it is too early to call this a sustained reversal, the divergence between the two metros may reflect Dallas's growing pull as a corporate magnet alongside rising housing costs and weather-related challenges in Houston.
Metro-level data also suggests that the pandemic-era "big-city exodus" narrative is continuing to fade. Los Angeles improved from -0.8% in 2023 to -0.3% in 2025, while New York held steady at -0.3% after improving in 2024. Even Miami (-0.6%), which ranked last among major metros despite Florida's continued statewide gains, saw its outflows moderate from 2023 levels. And while Illinois continued to post net outmigration, Chicago (0.0%) reached migration neutrality in 2025 after recording losses in both 2023 and 2024.
Major Insights:
Phoenix was the nation's top large-metro migration destination in 2025.
Dallas gained momentum while Houston lost ground, highlighting growing divergence within Texas.
Miami continued to post the largest outflows among major metros despite Florida's broader migration success.
The LosAngeles, Chicago, and the New York metro areas all saw migration losses ease.
Florida Dominates Large Metros
Despite Miami's struggles – and Florida’s relatively modest 0.2% inflow – a look beyond the top 10 large metros reveals that the Sunshine State is home to six of the nation's eight fastest-growing large metros nationwide.
Those top-performing metros, defined as CBSAs with 500K+ residents that added at least 0.8% of their population through net domestic migration over the past year, share a similar profile: lower housing costs, retiree appeal, suburban density, and an easy drive to a larger economic hub.
Much of the growth of these Florida metro areas, however, is being fueled from within Florida itself. While major out-of-state metros such as New York (6.1%) and Chicago (2.0%) remained important sources of new residents, nearly half of the net migration into Florida's top destination metros came from elsewhere in the state. In 2025, Miami (22.5%), Orlando (13.0%), Tampa (5.8%), and Naples (4.2%) together accounted for 45.5% of the net positive migration feeding these fast-growing markets.
Major Insights:
Mid-sized Florida metros dominate the national migration leaderboard.
Florida's migration pipeline is overwhelmingly driven by in-state movement.
The Affordability Factor
The migration flows feeding the nation’s fastest-growing large metros suggest that affordability remains a powerful driver of domestic relocation.
In 2025, seven of the eight top destination metros analyzed above had lower typical home values than their largest feeder markets. Lakeland–Winter Haven, FL, for example, had a typical home value of $313.4K in December 2024, compared with $404.9K in Orlando and $380.2K in Tampa – its two largest sources of net migration. Even North Port–Bradenton–Sarasota, FL – the most expensive Florida metro in this group – drew its largest share of net migration from the New York metro area, where home values are substantially higher.
The lone exception was Charleston–North Charleston, SC, whose largest source of net migration was Baltimore – a market with lower typical home values than the destination. Even in Charleston, however, affordability appears to have played a role. New York, a significantly more expensive market, ranked a close second in 2025, accounting for 6.5% of net positive migration into Charleston, just behind Baltimore’s 6.8%.
While housing costs are only one factor influencing migration decisions, the data suggests that households continue to gravitate toward markets where homeownership is comparatively more attainable than in the places they leave behind.
Most Top Migration Destinations Pull Residents From More Expensive Housing Markets
Typical Home Values* in Top Feeder Markets to Destination Hubs, 2025
Destination HubTop Feeder Market
*Typical home value based on Zillow Research’s Zillow Home Value Index (ZHVI) for Dec. 2024, immediately preceding the analyzed migration period (Jan.–Dec. 2025).
Share
Embed:
Major Insights:
Most high-growth metros attract residents from more expensive housing markets.
Relative affordability continues to be a primary driver of domestic migration.
Demographics Over Dollars
But as important as affordability is in explaining today’s domestic migration patterns, age appears to be an even stronger determinant of where people choose to relocate.
Among mid-sized and large metros (250K+ residents) experiencing significant population shifts – defined as gaining or losing at least 1.0% of their starting population through domestic migration over the past two years – households are increasingly moving toward older, more established communities.
The data reveals a clear negative relationship between migration performance and age differential – a metric calculated by subtracting the median age of the destination market from the weighted median age of its feeder markets. Negative values indicate movement toward older communities, while positive values indicate movement toward younger ones. In other words, the metros attracting the strongest migration inflows tend to be older than the markets sending them residents.
The data also shows a clear positive relationship between migration performance and retiree concentration. Metros with larger shares of residents aged 65 and older generally saw stronger migration gains over the past two years, while younger metros tended to attract fewer newcomers. This suggests that retiree-driven relocation has become an increasingly important driver of migration. At the same time, the influx of younger residents points to the broader appeal of these communities, which offer a mix of affordability, amenities, and lifestyle advantages.
Relocators are Gravitating Towards Older, More Established Communities – With Retirees Helping Fuel the Trend
Net Migration as Share of Starting Population, 2024–2025*
Net Migration vs. Weighted Age Differential
Net Migration vs. Share of Residents 65+
*Analysis includes metro areas with 250K+ residents and domestic migration gains or losses of at least 1.0% during the study period. Weighted Age Differential compares the destination market’s median age with the weighted median age of origin markets, with positive values indicating migration toward younger markets and negative values indicating migration toward older markets. Age data: Census ACS 2020–2024.
Share
Embed:
Major Insights:
People are moving to older, more established communities.
Markets with larger 65+ populations are attracting more domestic relocators.
The New Migration Map: Strategic Implications
The pandemic-era urban exodus is giving way to a more nuanced migration landscape. Large urban markets are stabilizing, while growth is increasingly concentrated in smaller states, secondary metros, and intra-state corridors. Affordability remains a powerful pull, but retirees, lifestyle considerations, and local market dynamics are also playing an increasingly important role in where Americans choose to live.
To capitalize on these shifts in 2026, civic leaders, commercial real estate (CRE) investors, retailers, and developers should:
Monitor smaller states gaining migration momentum. Among the nation's most populous states, only Florida saw (modest) net in-migration in 2025. By contrast, smaller states like South Carolina, Delaware, Idaho, Maine, Tennessee, and North Carolina continued to attract substantial inflow. Investors, retailers, and developers that monitor these patterns may be better positioned to identify emerging growth opportunities.
Invest ahead of growth. Vermont's reversal shows how important it is for housing supply and infrastructure to keep pace with demand. High-growth communities will also need the retail, healthcare, transportation, and service capacity required to support expanding populations.
Look beyond state-level narratives that can obscure local opportunities. Florida led the nation in fast-growing large metros even as Miami lost residents, while Texas saw Dallas gain momentum as Houston fell behind. Likewise, although Arizona was not a top destination state, Phoenix remained the nation's leading major metro for migration gains.
Treat states as migration ecosystems. In Florida, for example, domestic migration is increasingly redistributed across a network of interconnected metros – as costs rise in one market, residents shift to nearby alternatives. Tracking these spillover effects can help identify tomorrow's growth markets before they show up in the rankings.
Don't write off major urban markets. While New York, Los Angeles, and Miami continue to experience net outflows – and Chicago has yet to return to positive territory – migration losses have moderated substantially from their pandemic-era peaks. As these markets stabilize, investments in livability, affordability, and quality of life could help strengthen their long-term competitiveness and economic vitality.
Protect affordability as a competitive advantage. Across the nation's fastest-growing metros, migration flows continue to move from more expensive housing markets to less expensive ones. As demand rises, preserving attainable housing will be critical to maintaining the cost advantages that attract new residents and businesses.
Prepare for a retiree-driven demographic realignment. Older Americans are playing an outsized role in shaping domestic migration patterns, but the communities attracting them are increasingly appealing to a broader range of households as well. As these markets grow, demand is likely to increase for healthcare, recreation, hospitality, and housing, creating opportunities across a wide range of sectors.
Explore key signals guiding data-driven site selection from brands actively expanding their brick-and-mortar footprints.
May 21, 2026
Predicting The Next Best Location
Across segments, retail and dining expansions converge on a common set of priorities, including identifying markets with strong demand, ensuring alignment with target audiences, and leveraging local consumer behavior to drive synergy. Using AI-powered location intelligence, we analyzed five expanding brands and segments to uncover the core principles driving successful site selection.
1. Identifying Sustainable Growth in an Increasingly Saturated Market
Nationwide visits to coffee chains are up in 2026, with established brands and newcomers alike seeing their traffic increase as consumer headwinds lead some to shift their discretionary spend towards more affordable indulgences. But past visit growth does not necessarily indicate future opportunity – it may instead signal market saturation. Relying solely on overall visit trends to guide expansion could lead chains into highly competitive markets where existing supply already meets demand.
For example, analyzing traffic trends in 10 major metro areas where coffee visits increased year-over-year (YoY) in Q1 2026 reveals significant gaps between overall traffic trends and per-location demand. In some CBSAs, overall traffic growth significantly outpaced per-location traffic trends – suggesting that supply is already meeting (or exceeding) demand and limiting room for new coffee locations despite overall category growth. But in other metro areas, where overall visit growth appears smaller, per-location traffic is actually booming – indicating that the underlying demand is resilient enough to support additional coffee concepts.
These patterns highlight the importance of looking beyond topline growth to identify where true whitespace still exists.
Strategic Takeaways:
Relying solely on aggregate category performance can obscure regional white space. A market-level view may reveal opportunities for stronger returns in areas where consumer demand is gaining momentum.
Combining overall visit and visits per location data offers a more complete view of where demand is both strong and sustainable.
2. Ensuring Demographic Alignment on the Hyperlocal Level
Effective site selection matches both regional and local demographics to a brand’s target customer, supporting performance and reinforcing positioning. But even in well-aligned metros, results depend on site-level precision – locations where the trade area visitor profile most closely reflects the brand’s core audience are best positioned to drive incremental upside.
An analysis of Alo locations in the DC area suggests that the company is adopting this strategy. Within the already high-income metro area of Washington-Arlington-Alexandria, individual Alo Yoga stores are placed in centers that draw even more affluent visitors – maximizing the revenue potential of each location.
In fact, Alo's newest stores in the metro area – One Loudoun and Bethesda Row – drive traffic from households with higher median incomes than even the established area locations. This signals a clear focus on premium retail corridors and affluent consumer segments, which reinforces the brand’s positioning while capturing higher-spending customers at the site level.
Strategic Takeaways:
Beyond traffic potential, effective site selection requires a clear understanding of both regional and hyperlocal demographics, as well as the brand’s target audience.
As brands expand, aligning locations with core customer bases can drive success while reinforcing brand positioning.
3. Finding Retail Nodes With Complementary Visitation Patterns
Beyond driving traffic potential and demographic alignment, site selection should also ensure that a brand’s identity and operating model are well matched to the visitation patterns of prospective locations. Barnes & Noble offers a clear example. The company’s ongoing resurgence has relied in part on repositioning itself as a local cultural and social hub, with a stronger emphasis on local curation and community-driven events.
And analyzing Barnes & Noble’s 2026 openings shows a clear tilt toward centers with a higher share of local traffic than the chain average – supporting its shift away from a purely transactional retail model toward a more community-centric experience built around local curation, events, and repeat visitation. By prioritizing locally driven centers, the company’s site selection strategy not only captures relevant traffic but also reinforces its broader repositioning as a neighborhood-oriented brand.
Strategic Takeaways:
Site selection strategy should look to align a brand’s identity and operating model with real-world visitation patterns at prospective locations.
For brands leaning into local curation, choosing centers with predominantly nearby visitors may be the key to performance and preserving brand identity.
4. Understanding the Benefits of Competitor Proximity
Effective site selection recognizes that proximity to competitors can function as a demand driver, amplifying traffic rather than diluting it.
In practice, this often takes the form of clustering – deliberately locating near similar or complementary concepts to capture shared demand. Shake Shack provides a clear example. Analyzing the chain's store fleet shows that many locations sit near other QSR and fast-casual concepts, creating opportunities to capture dining-based traffic. At the same time, strong cross-visitation patterns indicate that these co-located brands share a common customer base, positioning the brand closer to consumers who are already likely to visit. And, at least for Shake Shack, this strategy appears to be working – traffic to the chain increased 19.9% YoY in Q1 2026.
Strategic Takeaways:
As in retail, co-tenancy in the restaurant space can be mutually beneficial – establishing a center as a dining destination, driving incremental traffic, and increasing a brand’s opportunities to win share-of-stomach.
Incorporating cross-visitation analysis into site selection helps pinpoint locations where target customers are already visiting nearby brands. Centers that already attract a brand’s overlapping customer base provide a stronger foundation for incremental growth.
5. Balancing Growth and Cannibalization Risk
Incorporating trade area analysis into site selection can also help determine whether a new location will generate new traffic or risk cannibalizing existing demand. Aldi, a rapidly expanding grocery chain, offers a relevant example.
The company opened a fourth Las Vegas store on S Decatur Blvd in October 2025, positioned between existing locations on W Craig Rd and S Rainbow Blvd, approximately eight miles from each. And analyzing the core trade area of each of the four Las Vegas locations indicated limited visitor cannibalization over the last six months, despite the stores’ close proximity. Only 6.2% and 7.6% of the S Decatur Blvd store’s trade area overlapped with the W Craig Rd and S Rainbow Blvd stores’ trade areas, respectively.
These findings show that there is no one-size-fits-all approach to store spacing – it varies by brand, category, and market. Analyzing a company’s existing store network alongside competitor density and overall demand can help determine how closely locations can be placed without hurting performance. In many cases – especially in high-frequency categories like grocery – markets can support stores that are closer together than expected.
Strategic Takeaways:
Site selection strategy needs to take into account local demand and visitation behavior typical of the category as a whole and of existing locations in particular.
Trade area analysis can reveal where a market allows for network densification without significant risk of visit cannibalization.


.svg)


.avif)
.png)
.avif)
.avif)

%20(1).avif)
.png)
.avif)


.png)
.png)

.avif)
.png)


.avif)


