


.svg)






It almost feels like a throwback to the COVID era, with more people raising backyard chickens – but this time, it’s driven by skyrocketing egg prices due to bird flu. So, what’s the trickle-down effect on food and retail establishments? Breakfast-focused restaurants, where eggs are a staple – from classic dishes like eggs with bacon, sausage, potatoes, and toast to essential ingredients in pancakes and waffles – are feeling the impact most acutely.
Breakfast Chains Implement Surcharge to Offset Egg Price Spikes
According to a recent USDA report, retail egg prices increased by 13.8% in January 2025, following an 8.4% rise in December 2024. The agency has now revised upwards its initial forecast of a 20% increase in egg prices for 2025 and now projects a 41.1% rise for the year. Data from the U.S. Bureau of Labor Statistics on the average price of a dozen large Grade A eggs also highlights the significant nature of this recent price surge from a historical perspective.
To offset this unprecedented surge in egg prices, several breakfast chains have implemented surcharges on egg-based menu items in February. Waffle House introduced a 50-cent surcharge per egg across all its locations. Similarly, Denny's added surcharges across its 1,500 locations, with fees varying based on regional impacts. Other establishments, such as Biscuitville, also imposed similar surcharges to manage escalating expenses. These measures reflect the industry's efforts to navigate the financial strain caused by the egg shortage while striving to maintain menu affordability for customers.
Visits Slow to Breakfast-First Restaurant Concepts in 2025
Broadly speaking, foot traffic across much of the retail and dining sector declined as February progressed, likely due to factors such as post-holiday spending pullbacks, decreased consumer confidence, weather, and other macroeconomic conditions. However, breakfast-first chains–including IHOP, Denny’s, Waffle House, Broken Yolk Cafe, Huddle House, Bob Evans Restaurant, Another Broken Egg Cafe, and Silver Diner have underperformed other retail and restaurant chains in our Placer 100 index.
First Watch and Silver Diner Outperform Broader Category
Year-to-date weekly visitation trends for the largest breakfast-focused chains show that First Watch and Silver Diner are the only brands with positive year-over-year growth. In contrast, chains that implemented egg price surcharges like Waffle House and Denny’s have understandably underperformed compared to the broader category.
Silver Diner and First Watch also pull visitors from higher-income trade areas (below), which allows them to absorb costs more effectively without risking a decline in visitation.
The surge in egg prices, which has compelled many breakfast chains to introduce surcharges, already seems to be having an impact on visitation trends to egg-forward restaurant chains. Dining concepts catering to higher-income consumers – or those less reliant on breakfast visitation – are likely to have more success weathering the current challenges.
For more data-driven dining insights, visit placer.ai.
This year is expected to present challenges for many restaurant operators, including (1) an uncertain macroeconomic environment; (2) growing encroachment from grocers, warehouse clubs, and convenience stores; and (3) difficulties connecting with consumers as they prioritize both value and convenience. Against this backdrop, Chipotle’s management is forecasting low- to mid-single-digit comparable sales growth for the full year. The company faces tough year-over-year (YoY) comparisons—our data shows a 4.2% increase in visits per location in 2024, placing Chipotle among the top-performing restaurant chains with more than 100 locations. However, despite the uncertain landscape, our data highlights several reasons why Chipotle may surpass this forecast.
Honey Chicken Could Be The Latest in a String Successful Menu Innovations
Between 2020 and 2024, Chipotle introduced several new protein options that significantly contributed to its growth and customer engagement. In 2021, the launch of Smoked Brisket became a fan favorite, leading to its return in 2024 due to popular demand. The re-introduction of Chicken al Pastor also played a role in boosting visits, significantly lifting visits trends during the second quarter of 2024. These innovative protein additions have not only diversified Chipotle's menu but also resonated with customers, driving sales and enhancing the brand's market presence.
Chipotle introduced Honey Chicken as a limited-time protein option systemwide on March 7th 2025. According to management, Honey Chicken was the brand’s best-performing limited-time offer test, excelling in both early sensory testing and broader market trials. To validate this claim, we examined YoY visitation data for the 55 locations in Sacramento and 25 locations in Nashville where Honey Chicken was tested in the fall of 2024. Launched on August 27th, 2024, our data indicates an immediate boost in visits per location in Sacramento and sustained outperformance in Nashville.
While it’s difficult to extrapolate the success of a limited-time product nationwide based on its performance in a few test markets, our data indicates that Chipotle’s Honey Chicken will likley be among the best performing new product launches in 2025.
Smaller Markets Continue to Represent a Significant Opportunity
In recent years, Chipotle Mexican Grill has experienced notable success by expanding into smaller markets across the United States. This strategic move has led the company to increase its long-term goal from 6,000 to 7,000 North American locations, with many new restaurants opening in towns with populations around 40,000. These small-town locations have demonstrated unit economics comparable to or even surpassing those in larger markets.
Our data shows continued visit outperformance in smaller markets in 2024, with Chipotle locations in non top-25 markets seeing greater visits per location than locations in top 25 markets. And this strategic expansion sets the stage for continued outperformance as store openings in the company’s smaller markets continue to enter the comparable sales base in 2025.
Chipotlane Format Stores Unlock Throughput Opportunities
Chipotle's “Chipotlane” format stores—which include a dedicated drive-thru lanes for digital order pickups—has significantly enhanced operational efficiency. According to management, Chipotlane location stores often see transactions completed in less than a minute, which compares favorably to traditional QSR drive-thru times. This swift service has led to a 10%-15% increase in sales at Chipotlane-equipped locations compared to traditional formats. Chipotle now has more than 1,000 Chipotlane locations, with plans to include this feature in the majority of new restaurants, aiming for an annual unit growth of 8% to 10%.
We grouped the first 100 Chipotlane locations with our data to better understand the impact on throughput and operational efficiency. Our data indicates that Chipotlane locations outperformed the chain average by a meaningful amount – especially during peak lunch and dinner hours – adding further support for the company’s potential outperformance in the year ahead.
Chipotle’s Strategies for Success in 2025
Overall, while 2025 presents a challenging landscape for the restaurant industry, Chipotle appears well-positioned to navigate these headwinds and potentially exceed its growth expectations. The company’s proven track record of successful menu innovations, along with the promising early results of Honey Chicken, demonstrate its ability to resonate with consumers. Additionally, Chipotle's strategic expansion into smaller markets and the continued rollout of Chipotlane locations are key drivers that could boost visitation and operational efficiency. Despite a difficult macroeconomic environment and increased competition, Chipotle’s combination of menu innovation, market expansion, and enhanced convenience through Chipotlanes sets the stage for continued success in 2025.
Wondering why Dave's Hot Chicken is reportedly in talks to sell itself to Roark Capital for $1 billion? One key reason is its strong growth potential. In 2024, chicken chains outpaced the broader QSR category in both new restaurant openings and increased visits per location. Dave's Hot Chicken stands out among them, with Placer's data showing it was one of the top performers in visit-per-location growth among chains with more than 100 locations last year.
2024 was a challenging year for the restaurant industry, marked by increased competition from other food retail channels, intensified value wars, and rising operational costs, all of which contributed to a surge in bankruptcies. The start of 2025 has been equally difficult.
Despite these challenges, our data continues to show strong consumer demand for dining out. However, the way consumers interact with restaurants is evolving more than ever before. Below, we highlight several key shifts in consumer behavior that restaurant operators, suppliers, and investors should consider in the year ahead.
How to Balance Convenience Versus Experience?
With Starbucks' renewed focus on its coffeehouse roots under CEO Brian Niccol, an important question emerges: have today’s restaurants become too complex? Starbucks originally built its brand as a “third place” away from home and work – an inviting space for customers to gather. However, this focus began shifting about a decade ago with the rollout of Mobile Order and Pay. As e-commerce surged in the early 2010s, consumers became accustomed to making purchases online or via mobile apps, making digital ordering a necessity for most retailers and restaurants. Yet, prioritizing convenience through mobile ordering and pickup created a disconnect with Starbucks’ experience-driven identity, leading to friction between its convenience-oriented and experience-focused customers.
This tension between experience and convenience has been a challenge for many restaurant operators in recent years. It explains why QSR chains have reduced store footprints while expanding drive-thru capacity, why fast-casual and casual-dining restaurants have increasingly adopted pickup and drive-thru windows, and why many chains now allocate dedicated space for delivery orders. Even Darden, long resistant to third-party delivery, ultimately embraced it to adapt to changing consumer behavior.
Visitation trends in 2024 reinforced the difficulty of balancing experience and convenience within the same restaurant model. Among chains with more than 100 locations, those with the highest year-over-year (YoY) growth in visits per location were largely drive-thru specialists, such as Raising Cane’s, In-N-Out Burger, 7 Brew Coffee, and PJ’s Coffee. Meanwhile, non-drive-thru leaders like CAVA and Chipotle thrived by focusing on customization, underscoring that consumers are willing to pay a premium for personalized experiences that align with their preferences.
The rise of convenience-based restaurants does not signal the end of experiential dining – far from it. Below, we’ve outlined monthly year-over-year (YoY) visit trends for major restaurant categories in 2024. While QSR value wars dominated industry headlines throughout the year, casual- and fine-dining chains actually outperformed the QSR segment in YoY visit growth.
Some of this success can be attributed to well-executed promotions, such as Chili’s "3 for Me" deal – which helped the chain finish just behind Raising Cane’s in visit-per-location growth for 2024 – and Buffalo Wild Wings’ "All You Can Eat Wings" promotion. However, the strong YoY performance of fine-dining chains further underscores that experience-driven dining remained highly in demand throughout the year.
We also see this trend reflected in dwell time across the restaurant industry. With the rise of drive-thru and takeout orders during and after the pandemic, combined with advancements in mobile ordering technology, it’s no surprise that dwell times for limited-service restaurants have remained below pre-pandemic levels (below). However, the opposite is happening in full-service restaurant categories, where dwell times are on par with or even exceeding pre-pandemic levels.
While many casual dining chains have seen an increase in takeout and delivery orders over the past few years, the growth of experiential dining concepts like Kura Sushi and GEN Korean BBQ, along with the continued expansion of eatertainment venues such as Topgolf, Puttshack, and Pinstripes—where dwell times often exceed 90 minutes—has helped maintain overall category dwell times. Meanwhile, the increase in dwell time for fine-dining establishments suggests that guests are making the most of their time when dining out, reinforcing the growing consumer preference for experience over convenience.
“Familiarity” and Its Impact on New Store Contribution
We've previously highlighted the importance of familiarity in consumer dining decisions, particularly in a challenging macroeconomic environment. With years of elevated inflation across food, rent, healthcare, and insurance, consumers have fewer discretionary dollars to spend. As a result, when they choose to dine out, they gravitate toward brands they know and trust.
In collaboration with the team at Bloomberg Second Measure, we analyzed data on the percentage of revenue generated from new customers at both full-service and limited-service restaurants. Our findings revealed a noticeable decline in new customer revenue during the second half of 2024, further reinforcing the idea that consumers are prioritizing familiarity when making dining choices.
This preference for familiar brands may be creating challenges for restaurant chains expanding into new markets. Traditionally, a new restaurant location in an unfamiliar market could expect to generate around 75% of the sales/visits seen in an established market—after an initial “honeymoon” phase when consumers try the brand for the first time. However, our data suggests that visit trends for restaurants entering new markets are now significantly lower than historical averages. Unsurprisingly, many operators have told us that their 2025 expansion plans will prioritize in-filling existing markets rather than expanding into new ones.
Portillo’s—the Chicago-based chain known for its Chicago-style hot dogs, Italian beef sandwiches, and char-grilled burgers—has experienced mixed visit trends when entering new markets. Below, we present visit per location trends for Portillo’s nationwide, in its home market of Chicago, and in several states where it has expanded in recent years. In its latest investor presentation, Portillo’s acknowledged that its average unit volumes are highest in its home market ($11.3 million in sales per location), compared to other Midwest markets ($6.0 million) and Sunbelt locations ($6.6 million). While these figures are still strong, they reflect the broader challenge that many restaurant brands face when expanding beyond their core markets.
Conclusion
As the restaurant industry navigates 2025, operators must strike a delicate balance between convenience and experience while adapting to shifting consumer preferences. The demand for dining out remains strong, but consumers are making more intentional choices, favoring trusted brands and prioritizing either speed and efficiency or immersive, experiential dining. At the same time, new market expansion presents growing challenges, with visit trends suggesting a preference for familiarity over novelty. As brands refine their strategies, those that successfully integrate innovation with operational excellence—whether through streamlined digital convenience, compelling promotions, or differentiated in-store experiences—will be best positioned for long-term success in an increasingly competitive landscape.

Looking at the discretionary categories that outperformed this holiday season, we may be on the cusp of a new trend heading into 2025: reinvention. Our data highlights that home furnishings, beauty, and apparel were among the top-performing discretionary retail categories in terms of year-over-year visits during November and December, as shown below.
The performance of these three categories is notable for different reasons. After significant declines earlier in the year, the home furnishings category rebounded strongly. As discussed in November, this recovery was supported by strength in the housewares category and mattress retailers. Housewares retail has generally outperformed home furnishings over the past few years – a trend partly attributed to increased out-of-home entertaining. While purchasing gifts for hosts likely drive visits for some home furnishing retailers, we may now be entering a replacement cycle for many home furnishing products purchased during the pandemic, which could further support the category’s recovery. In other words, many consumers may be looking to reinvent their personal spaces starting with their homes.
The strength in beauty and apparel may reflect a broader trend of personal reinvention. What fueled this movement? It could be as simple as buying a new outfit for a holiday party or experimenting with seasonal beauty products. However, several apparel retailers we spoke to over the past few months pointed to additional factors, including health and wellness trends. 2024 saw a rise in in-person workouts (one of the strongest retail categories in year-over-year visitation), greater adoption of technology-driven fitness and wellness routines, and increased use of wellness supplements and GLP-1 drugs like Ozempic and Mounjaro. Retailers noted that healthier lifestyles during 2024 drove increased demand for apparel this holiday season—a trend that could have substantial implications for the year ahead.

Black Friday 2024 provided valuable insights into consumer behavior as we look ahead to 2025. Placer’s blog highlighted a +2.7% increase in Black Friday weekend visits compared to last year, with shoppers focusing on value while also seeking unique and differentiated products, evidenced by strong year-over-year trends at off-price retailers like HomeGoods, Marshalls, and T.J. Maxx. Pandemic-era categories like home furnishings and sporting goods may also be seeing signs of a resurgence.
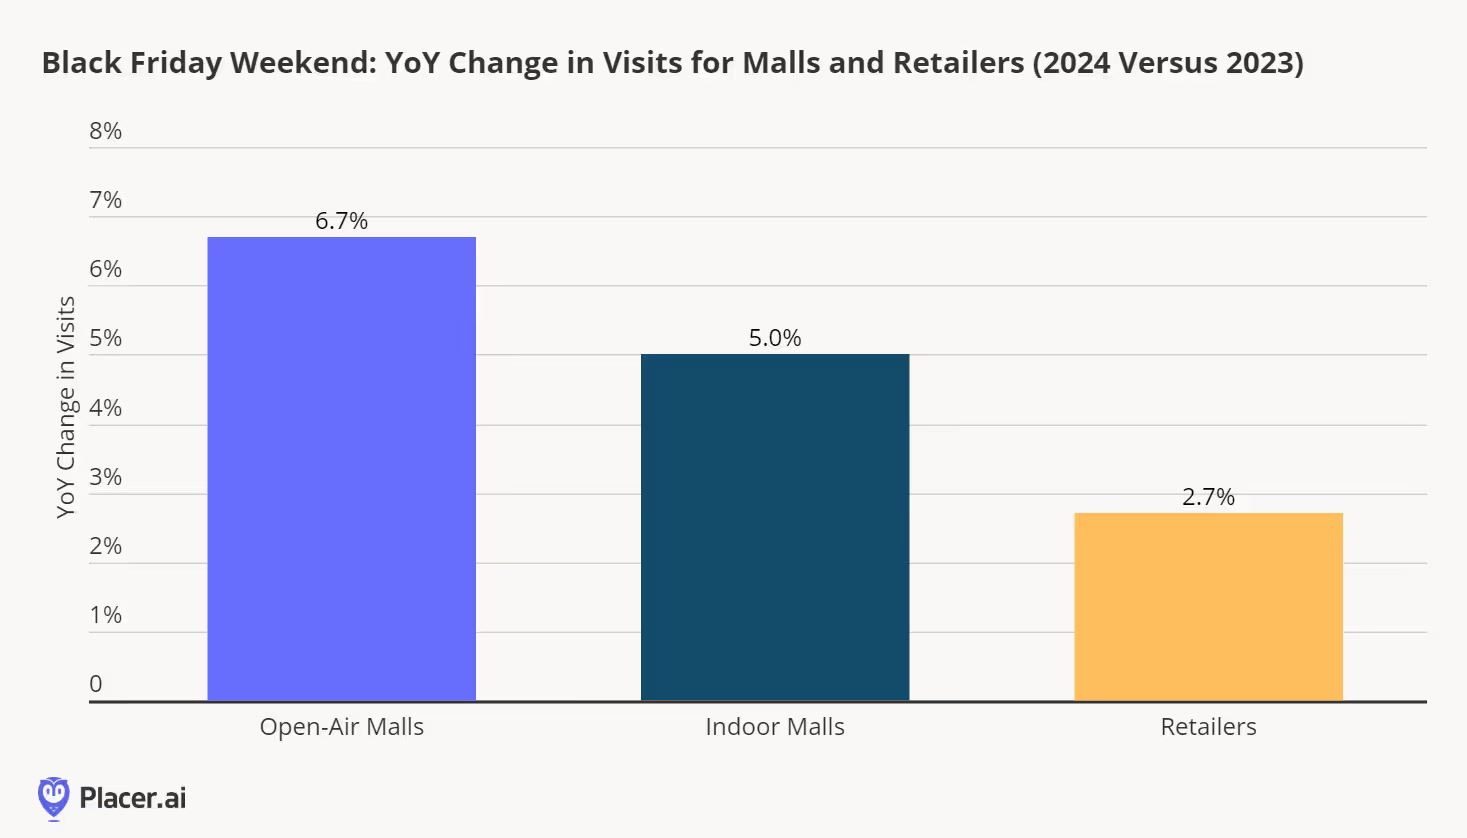
The standout takeaway, however, was the evolving role of malls. Mixed-use developments and placemaking, a key trend for malls heading into 2024, proved pivotal this Black Friday weekend. Open-air and indoor malls saw larger year-over-year visit increases (6.7% and 5.0%, respectively) than retailers across all property types (up 2.7%). This was a trend echoed by operators like Simon, further underscoring the mall’s continued relevance in modern retail.
Retailers remain integral to malls, but seasonal attractions, entertainment options, and a more diverse tenant mix have transformed malls into community hubs and prime destinations for both residents and tourists. These attractions have a symbiotic effect, driving greater foot traffic to mall tenants compared to standalone stores of the same brands.
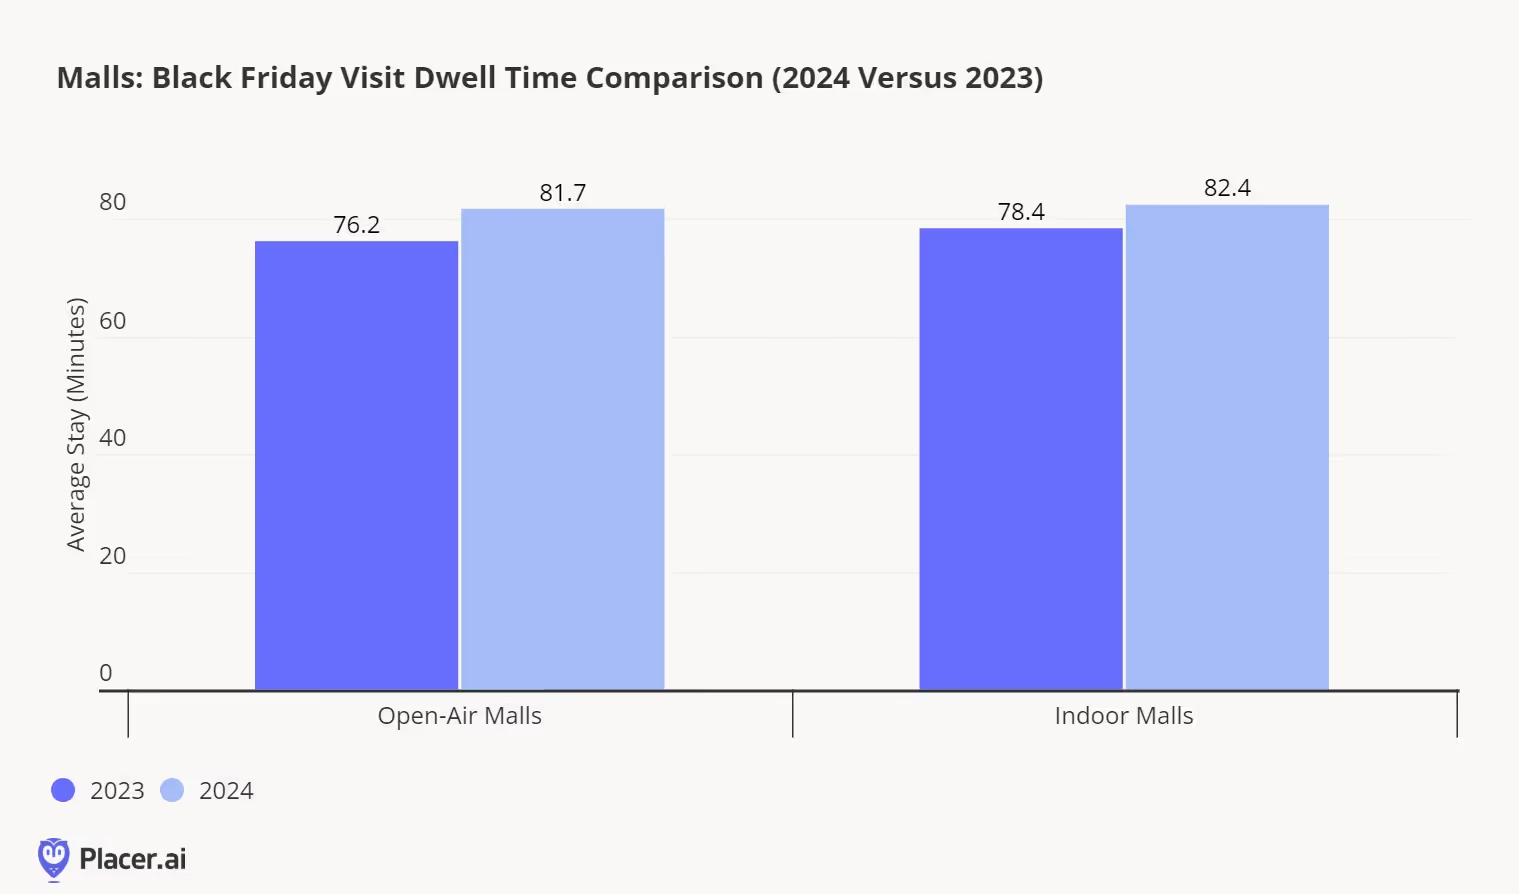
Need evidence that this strategy works? Consumers are staying longer. Our data shows that open-air malls experienced a 7.2% increase in dwell time over Black Friday weekend, while indoor malls saw a 5.1% rise. As we've highlighted before, the longer consumers spend at a mall, the more likely they are to make a purchase.
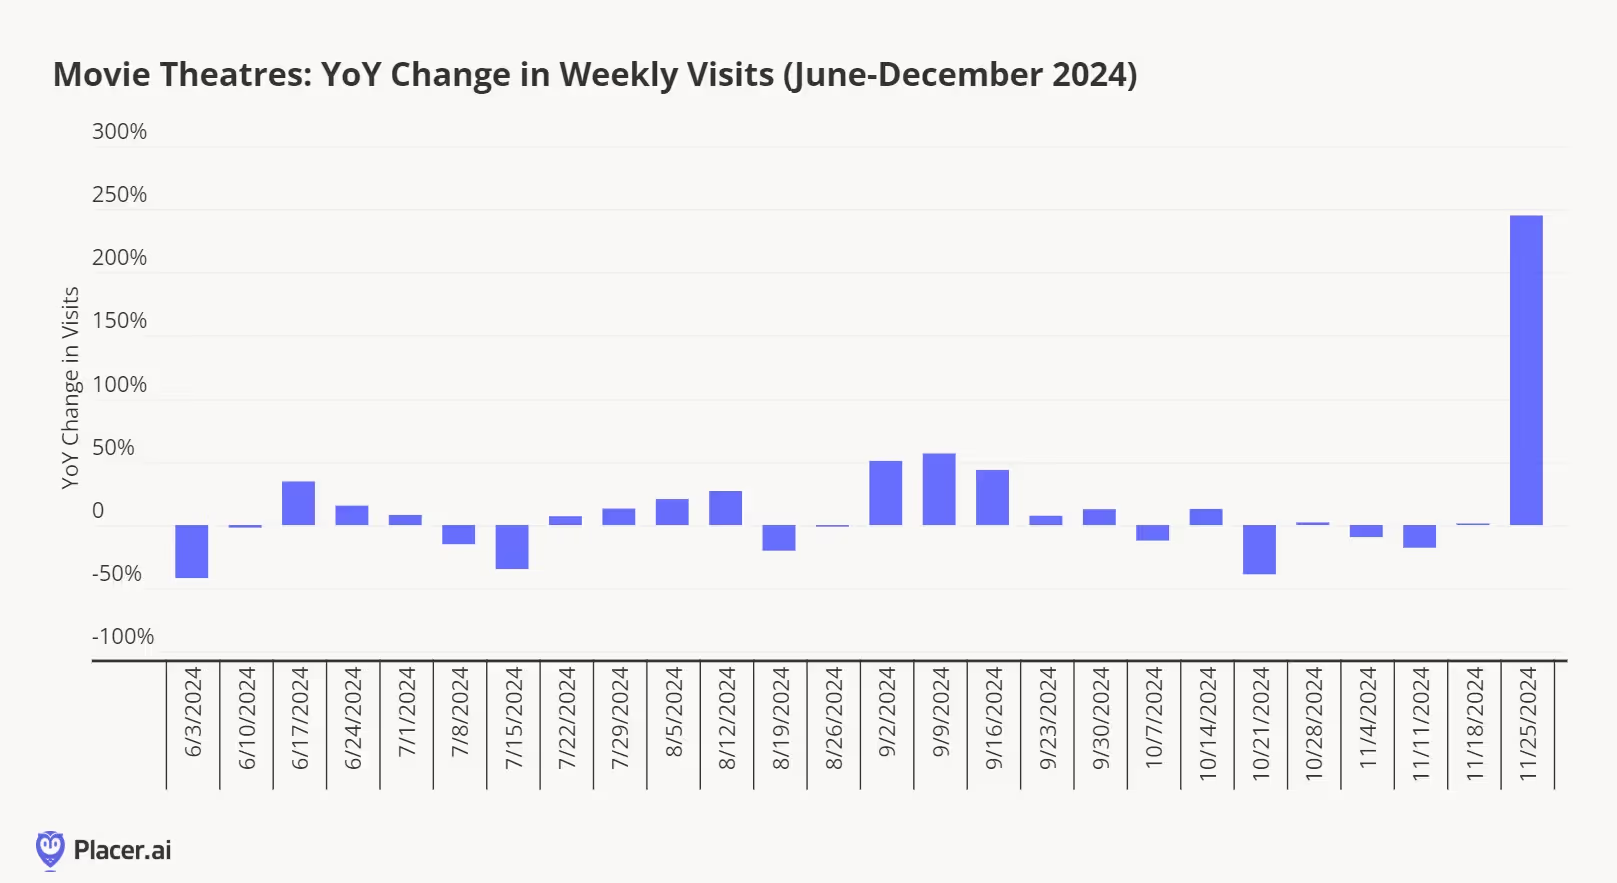
A strong box office undeniably played a role in Black Friday visit trends and dwell time. Our data shows a nearly 250% increase in visits to movie theaters this Black Friday compared to last year (below). However, the data also reveals that many malls with unique holiday attractions and effective marketing strategies experienced increased visits, indicating that mall traffic was driven by more than just blockbuster movies.
Taken together, our data reinforces that malls have become more vital than ever to modern retail, evolving from traditional shopping hubs into multifaceted destinations that blend commerce, entertainment, and community experiences. Changes in tenant mix have introduced a diverse array of retailers, including digitally native brands, experiential stores, and unique local offerings, catering to broader consumer tastes. Increased visitor attractions, such as dine-in theaters, fitness studios, and immersive art installations, create compelling reasons that drive repeat visits for more than just shopping. Mall-focused events, from seasonal pop-ups to live performances, further enhance the draw by fostering engagement and creating a sense of occasion. This strategic evolution has positioned malls as essential anchors in the retail ecosystem, blending convenience and experience to meet the demands of today’s shoppers.
1. Executive Summary
Five years ago, the neighborhood and lifestyle center playbook was built around apparel anchors, department stores, and soft goods. Today, that model is giving way to a service-first tenant mix centered on health and wellness, food and beverage, fitness, grocery, and off-price retail.
The shift reflects a lasting change in how consumers use physical retail space. The pandemic accelerated demand for health, wellness, and dining; e-commerce continued to erode traditional apparel traffic; and value-oriented and service-based concepts proved more resilient. The result is a new ecosystem in which different tenants take on the roles once filled by the traditional anchor.
Fitness, grocery, and coffee drive frequent visits. Dining extends dwell time and encourages cross-shopping. Wellness captures fast-growing demand that is largely insulated from e-commerce. And off-price retail continues to generate resilient discretionary traffic.
Six years of foot-traffic and tenant-mix data across neighborhood and lifestyle centers point to seven key takeaways for landlords and advisors repositioning their portfolios:
- Apparel has lost its traditional anchor role. Apparel visits fell nearly 25% between 2019 and 2025, while fitness, wellness, coffee, grocery, and off-price / value retail gained traffic.
- The next generation of anchors requires a new approach to tenant evaluation. Landlords should look beyond square footage and traditional anchor status and evaluate tenants based on metrics like visit frequency, traffic growth growth, e-commerce risk, and dwell time – with the strongest mixes combining categories that bring different strengths to the center.
- Neighborhood and lifestyle centers require different ecosystems. Neighborhood centers remain grocery-led and should layer in high-frequency and service-oriented uses. Lifestyle centers are increasingly dining- and experience-led and should optimize for dwell time and destination appeal.
- Fitness, wellness, and food & beverage have emerged as new primary anchors that strengthen centers in different ways. Fitness creates exceptionally frequent, long visits, while wellness brings fast-growing, e-commerce-resistant demand. Dining adds another dimension by extending dwell time and creating destination appeal, particularly at lifestyle centers.
- Off-price is the exception within apparel – and a meaningful opportunity. Ross, Burlington, and the TJX banners continue to grow traffic and store counts even as much of traditional apparel contracts.
- Local trade area considerations should shape the tenant mix. The category framework may hold across markets, but landlords should match specific concepts and banners to the income profile and customer base of the trade area.
2. What Drove the Shift: Three Accelerants
The transformation of the American retail center was driven by three compounding forces that permanently altered consumer behavior and retail economics.
The Pandemic Reset (2020–2021)
COVID-19 permanently altered consumer behavior. Fitness studios, med-spas, and the restaurants that survived captured demand as competitors closed and leaned into digital loyalty programs, while apparel chains lost customers to e-commerce.
The E-Commerce Reckoning (2021–2023)
Offline apparel sales slowed as consumers shifted to digital shopping for traditional fashion. Department stores ceded both sales and market share to off-price for more than a decade, and the pace accelerated after the pandemic. Crucially, many of the categories that held their ground share a common trait: They sell experiences and services that cannot be shipped to a doorstep.
The Wellness Economy Surge (2022–2026)
As the pandemic receded, health and wellness surged. The U.S. med-spa industry reached $17.5 billion by 2022, and was forecast to keep growing at roughly 10 percent a year through 2027. Wellness uses are also among the fastest-growing sources of retail leasing demand.
Strategic Takeaways
- Health, wellness, and food uses gained durable loyalty during the pandemic, while traditional apparel lost it to e-commerce.
- Off-price has been taking share from department stores for over a decade, and the pandemic only accelerated it.
3. The New Anchor Decision Framework
To meet this challenge, centers need to assemble tenant mixes in which different categories perform distinct but complementary roles. Rather than relying on a single dominant anchor, the strongest centers combine tenants that collectively drive frequency, dwell time, growth, and durable physical-world demand. Some generate frequent repeat visits; others contribute fast-growing, e-commerce-resistant demand or resilient discretionary retail traffic.
A. Visit Frequency
Visit frequency is one of the clearest measures of an anchor’s value to its neighbors. A tenant that brings the same customer back every week creates far more exposure for the rest of the center than one that generates occasional destination trips.
And the data reveals a clear hierarchy. Fitness leads by a wide margin, with the average gym visitor returning 4.2 times per month. Coffee follows at 2.5 visits per month and grocery at 2.4, reflecting the routine nature of those categories. Limited-service dining, at 1.9 visits per month, also functions as a meaningful frequency engine.
At the other end of the spectrum are apparel and full-service restaurants, at 1.2 monthly visits per visitor, and spa and wellness, at 1.1. These categories tend to be more purpose-driven than routine-driven.
B. Growth Trends and E-Commerce Risk
But low frequency is not disqualifying. Just as important are a category’s growth trajectory and the durability of its demand in an increasingly e-commerce-driven retail environment.
Spa and wellness chains, for example, rank last in visit frequency at 1.1 average visits per visitor per month. But the category leads all segments in post-pandemic visit growth, up 31.8% since 2019, with effectively no e-commerce exposure.
Off-price follows at 28.6% visit growth, followed by coffee (+26.7%) and fitness (+22.6%) – both of which pair strong growth with high visit frequency and limited digital risk.
C. Dwell Time
Dwell time adds a third dimension: how long customers remain on site. Longer visits, of course, do not automatically translate into cross-shopping, but they increase the opportunity for customers to interact with other tenants and amenities within a center.
Here too fitness stands out, with the largest share of visits lasting 30 minutes or more. Full-service restaurants, off-price retailers, and spa and wellness tenants also perform strongly on this measure, with more than half of visits lasting at least half an hour.
Strategic Takeaways
- Rather than square footage or traditional anchor status, landlords should prioritize a mix of factors that reflect how customers actually interact with tenants.
- Make visit frequency a major input into anchor and tenant-mix decisions.
- Prioritize categories that combine multiple strengths. Fitness, for example, pairs high frequency with strong growth and durable physical demand; grocery combines frequency, stability, and long-term lease commitments.
- Placemaking can help maximize frequency. Shared amenities, walkability, and events give customers a reason to linger and return, compounding the frequency advantage of service and food & beverage (F&B) tenants.
4. Center-Level Trends
Shopping centers have been reshaping their tenant mixes around the categories gaining traffic and leasing demand – but not uniformly. The role each category plays, and the priorities for landlords, differ by format.
A. Lifestyle Centers
Lifestyle centers compete primarily on experience and time-on-site rather than on convenience. And a tenant mix that gives shoppers multiple reasons to come – and to stay – can create a virtuous cycle: Longer visits encourage more cross-shopping, which in turn supports the higher rents commanded by specialty and premium tenants.
Traditionally, the lifestyle-center experience was anchored by dining and apparel, including the department stores that defined the format for decades. As recently as 2019, apparel was the second-largest draw, accounting for 16.2% of visits across the eight categories analyzed below.
But apparel’s pull has weakened. The category’s share of visits fell 3.2 percentage points between 2019 and 2025, dropping behind both limited-service restaurants and grocery. Dining, meanwhile, has become even more central – despite the national headwinds facing full-service restaurants, FSRs’ share of lifestyle-center visits declined by just 1.4 percentage points, leaving them firmly in place as the format’s largest traffic driver. That resilience suggests that the destination dining spots found in lifestyle centers are still doing much of the heavy lifting. Coffee, limited-service restaurants, and grocery all gained visit share over the same period.
Wellness and fitness also posted meaningful gains, as did off-price and value-oriented retailers. Banners such as Nordstrom Rack and Saks OFF 5TH now function as credible affluent-traffic anchors, pairing the appeal of the treasure hunt with access to desirable brands at more approachable prices.
Strategic Takeaways
- Treat the restaurant cluster as the primary anchor, not a secondary amenity.
- Backfill department-store and apparel boxes with wellness, experiential, and premium off-price tenants.
- Match tenant investment with placemaking investment – dwell time only pays off if the center converts it into cross-shopping.
- Investments in placemaking, from plazas and walkable layouts to outdoor dining and programmed community events, can further turn a collection of tenants into a destination, increasing both visit frequency and dwell time across the center.
B. Neighborhood Centers
Neighborhood centers, by contrast, compete on convenience and routine. The winning mix therefore centers on categories that bring the same customer back frequently and reliably.
Traditionally, that routine has been built around the grocery anchor. While grocery’s share of visits has declined modestly since 2019, it still accounted for a majority of visits across the analyzed categories in 2025. With shoppers visiting an average of 2.4 times per month, grocery remains one of the format’s most dependable sources of recurring traffic – and is relatively insulated from e-commerce disruption compared with categories such as apparel.
The more meaningful shift has been in neighborhood centers’ supporting tenant mix. Historically, soft goods, apparel, and bank branches occupied much of the inline space. Today, landlords are increasingly replacing those uses with categories – like fitness – that generate more frequent and durable visitation. Large-format gyms such as Planet Fitness and LA Fitness are increasingly serving as secondary anchors, while spa, wellness, and boutique-fitness concepts fit well into the 2,000–4,000-square-foot inline bays vacated by apparel stores and bank branches.
Restaurants and cafés also remain central. Although their combined share declined slightly, they still represent the second-largest visit driver, accounting for about a third of neighborhood-center visits, with coffee continuing to gain ground. Off-price and value retail, meanwhile, has strengthened its position as a dependable, high-traffic draw.
Strategic Takeaways
- Keep the grocery anchor; surround it with high-frequency, e-commerce-resistant uses that add weekday reasons to visit.
- Right-size vacated apparel and bank bays (2,000–4,000 SF) for spa, boutique fitness, and fast casual.
5. Tailoring the Mix to the Trade Area
The ideal tenant-mix framework is a starting point, but the right execution depends on the characteristics of the local trade area. And one of the clearest differentiators is household income: Brands within the same category often draw from meaningfully different income profiles, making the question not simply whether to add fitness, grocery, dining, or off-price, but which banner best fits the households a center serves.
The data shows a substantial spread. Life Time’s $115.9K trade-area median household income is roughly 51% higher than Planet Fitness’s $76.9K. In off-price, Nordstrom Rack’s $93.9K is about 22% higher than Ross’s $77.1K. And in grocery, Trader Joe’s $92.4K is roughly 20% higher than Kroger’s $77.2K. The category may be right for a center while the wrong banner can still overshoot – or undershoot – the local customer base.
For landlords, that makes trade-area income a useful guide to how premium the mix can go. In higher-income trade areas, the wellness, grocery, F&B, and off-price allocation can skew premium, with concepts such as Life Time, Trader Joe's, chef-driven and experiential dining (for example, True Food Kitchen), and premium off-price (Nordstrom Rack, Saks OFF 5TH). In middle-income and value trade areas, the same categories are better served by large-format value fitness (Planet Fitness, Crunch), mainstream grocery (Kroger), fast-casual and QSR dining, and value off-price (Ross, Burlington). The category framework holds across markets; the specific tenant should be chosen to fit the income profile of the trade area.
Strategic Takeaways
- Trade-area income segments sharply within categories: Premium banners sit in markedly higher-income areas than their value peers.
- Use the ideal-mix framework as a baseline, then tune the specific tenants to the trade area's median income.
6. Strategic Recommendations for Landlords
The neighborhood and lifestyle center model has been fundamentally reinvented. The winning centers of 2026 are built around a service-first ecosystem of health and wellness, food and beverage, grocery, fitness, and off-price retail. Centers that have not begun repositioning face structural risk, and the window for action is the next 36 months.
Immediate Actions (0–12 Months)
- Audit the tenant mix against current visit-mix benchmarks and identify where the center has opportunities to strengthen frequency, dwell time, and cross-shopping.
- Map upcoming lease events and vacancies to the strongest-fit categories and banners. Evaluate fitness, wellness, F&B, grocery, off-price, apparel, and other retail based on the center’s format, trade area, and existing mix.
- Build a fitness and wellness pipeline. Target large-format gyms for suitable anchor or junior-anchor opportunities and boutique fitness, med-spa, and wellness concepts for smaller inline spaces.
- Match F&B opportunities to the center type. Prioritize coffee and limited-service concepts for neighborhood centers and destination dining and upscale fast casual where lifestyle-center positioning supports them.
- Evaluate off-price separately from traditional apparel. Consider value-oriented banners for neighborhood centers and more affluent-oriented off-price concepts for lifestyle centers.
Medium-Term Strategy (1–3 Years)
- Build a wellness ecosystem. Cluster fitness, boutique fitness, and spa and wellness services so they function collectively as a destination rather than as isolated tenants.
- Develop an F&B cluster appropriate to the center. Build restaurant rows or dining districts at lifestyle centers, while strengthening everyday food and beverage at neighborhood centers.
- Layer placemaking onto the strongest clusters. Add outdoor seating, public-realm improvements, gathering spaces, and programming to amplify dwell time and repeat visitation.
- Use grocery as the platform for a broader neighborhood-center ecosystem. Curate adjacent uses that turn recurring grocery trips into longer, multi-purpose visits.
- Establish off-price as a deliberate component of the merchandise mix. Use the right banner for the center’s customer profile and positioning rather than treating all off-price concepts interchangeably.
- Curate categories around complementary trip missions. Over time, create a mix in which grocery drives routine trips, fitness and wellness add frequency and dwell, F&B expands dayparts, and apparel, off-price, and other retail create additional reasons to browse and shop.
For the broker's view on how these traffic patterns translate into leasing decisions, read Cushman & Wakefield's companion piece: The Retail Remix: The New Playbook for Tenant Curation.

Introduction
2024 has been another challenging year for retailers. Still-high prices and an uncertain economic climate led many shoppers to trade down and cut back on unnecessary indulgences. Value took center stage, as cautious consumers sought to stretch their dollars as far as possible.
But price wasn’t the only factor driving consumer behavior in 2024. This past year saw the rise of a variety of retail and dining trends, some seemingly at odds with one another. Shoppers curbed discretionary spending, but made room in their budgets for “essential non-essentials” like gym memberships and other wellness offerings. Consumers placed a high premium on speed and convenience, while at the same time demonstrating a willingness to go out of their way for quality or value finds. And even amidst concern about the economy, shoppers were ready to pony up for specialty items, legacy brands, and fun experiences – as long as they didn’t break the bank.
How did these currents – likely to continue shaping the retail landscape into 2025 – impact leading brands and categories? We dove into the data to find out.
Conventional Value Reaching Its Ceiling
Bifurcation has emerged as a foundational principle in retail over the past few years: Consumers are increasingly gravitating toward either luxury or value offerings and away from the ‘middle.’ Add extended economic uncertainty along with rapid expansions and product diversification from top value-oriented retailers, and you have an explosion of visits in the value lane.
But we are seeing a ceiling to that growth – especially in the discount & dollar store space. Throughout 2023 and the first part of 2024, visits to discount & dollar stores increased steadily. But no category can sustain uninterrupted visit growth forever. Since April 2024, year–over-year (YoY) foot traffic to the segment has begun to slow, with September 2024 showing just a modest 0.8% YoY visit increase.
Discount & dollar stores, which attract lower-income shoppers compared to both grocery stores and superstores, have also begun lagging behind these segments in visit-per-location growth. In Q3, the average number of visits to each discount and dollar store location remained essentially flat compared to 2023 (+0.2%), while visits per location to superstores and grocery stores grew by 2.8% and 1.0%, respectively. As 2024 draws to a close, it is the latter segments, which appeal to shoppers with incomes closer to the nationwide median of $76.1K, which are seeing better YoY performance.
The deceleration doesn’t mean that discount retailers are facing existential risk – discount & dollar stores are still extremely strong and well-positioned with focused offerings that resonate with consumers. The visitation data does suggest, however, that future growth may need to focus on initiatives other large-scale fleet expansions. Some of these efforts will involve moving upmarket (see pOpShelf), some will focus on fleet optimization, and others may include new offerings and channels.
Return of the middle anyone?
Innovative and Disruptive Value Shake Up Retail and Dining
Still, in an environment where consumers have been facing the compounded effects of rising prices, value remains paramount for many shoppers. And brands that have found ways to let customers have their cake and eat it too – enjoy specialty offerings and elevated experiences without breaking the bank – have emerged as major visit winners this year.
Trader Joe’s Drives Visits With Private Label Innovation
Trader Joe’s, in particular, has stood out as one of the leading retail brands for innovative value in 2024, a trend that is expected to continue into 2025.
Trader Joe’s dedicated fan base is positively addicted to the chain’s broad range of high-quality specialty items. But by maintaining a much higher private label mix than most grocers – approximately 80%, compared to an industry average of 25% to 30% – the retailer is also able to keep its pricing competitive. Trader Joe’s cultivates consumer excitement by constantly innovating its product line – there are even websites dedicated to showcasing the chain’s new offerings each season. In turn, Trader Joe’s enjoys much higher visits per square foot than the rest of the grocery category: Over the past twelve months, Trader Joe’s drew a median 56 visits per square foot – compared to 23 for H-E-B, the second-strongest performer.
Chili’s Beats QSR at its Own Game
Casual dining chain Chili’s has also been a standout on the disruptive value front this past year – offering consumers a full-service dining experience at a quick-service price point.
Chili’s launched its Big Smasher Burger on April 29th, 2024, adding the item to its popular ‘3 for Me’ offering, which includes an appetizer, entrée, and drink for just $10.99 – lower than than the average ticket at many quick-service restaurant chains. The innovative promotion, which has been further expanded since, continues to drive impressive visitation trends. With food-away-from-home inflation continuing to decelerate, this strategy of offering deep discounts is likely to continue to be a key story in 2025.
The Convenience Myth
Convenience is king, right?
Well, probably not. If convenience truly were king, visitors would orient themselves to making fewer, longer visits to retailers – to minimize the inconvenience of frequent grocery trips and spend less time on the road. But analyzing the data suggests that, while consumers may want to save time, it is not always their chief concern.
Looking at the superstore and grocery segments (among others) reveals that the proportion of visitors spending under 30 minutes at the grocery store is actually increasing – from 73.3% in Q3 2019 to 76.6% in Q3 2024. This indicates that shoppers are increasingly willing to make shorter trips to the store to pick up just a few items.
At the same time, more consumers than ever are willing to travel farther to visit specialty grocery chains in the search of specific products that make the visit worthwhile.
Cross visitation between chains is also increasing – suggesting that shoppers are willing to make multiple trips to find the products they want – at the right price point. Between Q3 2023 and Q3 2024, the share of traditional grocery store visitors who also visited a Costco at least three times during the quarter grew across chains.
Does this mean convenience doesn’t matter? Of course not. Does it indicate that value, quality and a love of specific products are becoming just as, if not more, important to shoppers? Yes.
The implications here are very significant. If consumers are willing to go out of their way for the right products at the right price points – even at the expense of convenience – then the retailers able to leverage these ‘visit drivers’ will be best positioned to grow their reach considerably. The willingness of consumers to forego convenience considerations when the incentives are right also reinforces the ever-growing importance of the in-store experience.
So while convenience may still be within the royal family, the role of king is up for grabs.
Serving Diners Quicker With Automatization
Chipotle Draws Crowds With Autocado
Convenience may not be everything, but the drive for quicker service has emerged as more important than ever in the restaurant space. Diners want their fast food… well, as fast as possible. And to meet this demand, quick-service restaurants (QSRs) and fast-casual chains have been integrating more technology into their operations. Chipotle has been a leader in this regard, unveiling the “Autocado” robot at a Huntington Beach, California location last month. The robot can peel, pit, and chop avocados in record time, a major benefit for the Tex-Mex chain.
And the Autocado seems to be paying off. The Huntington Beach location drew 10.0% more visits compared to the average Chipotle location in the Los Angeles-Long Beach-Anaheim metro area in Q3 2024. Visitors are visiting more frequently and getting their food more quickly – 43.9% of visits at this location lasted 10 minutes or less, compared to 37.5% at other stores in the CBSA.
Are diners flocking to this Chipotle location to watch the future of avocado chopping in action, or are they enticed by shorter wait times? Time will tell. But with workers able to focus on other aspects of food preparation and customer service, the innovation appears to be resonating with diners.
McDonald’s Leans into Automation in Texas
McDonald’s, too, has leaned into new technologies to streamline its service. The chain debuted its first (almost) fully automated, takeaway-only restaurant in White Settlement, TX in 2022 – where orders are placed at kiosks or on app, and then delivered to customers by robots. (The food is still prepared by humans.) Unsurprisingly, the restaurant drives faster visits than other local McDonald’s locations – in Q3 2023, 79.7% of visits to the chain lasted less than 10 minutes, compared to 68.5% for other McDonald’s in the Dallas-Fort Worth-Arlington, TX CBSA. But crucially, the automated location is also busier than other area McDonald’s, garnering 16.8% more visits in Q3 than the chain’s CBSA-wide average. And the location draws a higher share of late-night visits than other area McDonald’s – customers on the hunt for a late-night snack might be drawn to a restaurant that offers quick, interaction-free service.
Evolving Retail Formats - Finding the Right Fit
Changing store formats is another key trend shaping retail in 2024. Whether by reducing box sizes to cut costs, make stores more accessible, or serve smaller growth markets – or by going big with one-stop shops, retailers are reimagining store design. And the moves are resonating with consumers, driving visits while at the same improving efficiency.
Macy’s Draws Local Weekday Visitors With Small-Format Stores
Macy’s, Inc. is one retailer that is leading the small-format charge this year. In February 2024, Macy’s announced its “Bold New Chapter” – a turnaround plan including the downsizing of its traditional eponymous department store fleet and a pivot towards smaller-format Macy’s locations. Macy’s has also continued to expand its highly-curated, small-format Bloomie’s concept, which features a mix of established and trendy pop-up brands tailored to local preferences.
And the data shows that this shift towards small format may be helping Macy’s drive visits with more accessible and targeted offerings that consumers can enjoy as they go about their daily routines: In Q3 2024, Macy’s small-format stores drew a higher share of weekday visitors and of local customers (i.e. those coming from less than seven miles away) than Macy’s traditional stores.
Harbor Freight Tools and Ace Hardware Serve Smaller Growth Markets With Less Square Footage
Small-format stores are also making inroads in the home improvement category. The past few years have seen consumers across the U.S. migrating to smaller suburban and rural markets – and retailers like Harbor Freight Tools and Ace Hardware are harnessing their small-format advantage to accommodate these customers while keeping costs low.
Harbor Freight tools and Ace Hardware’s trade areas have a high degree of overlap with some of the highest growth markets in the U.S., many of which have populations under 200K. And while it can be difficult to justify opening a Home Depot or Lowe’s in these hubs – both chains average more than 100,000 square feet per store – Harbor Freight Tools and Ace Hardware’s smaller boxes, generally under 20,000 square feet, are a perfect fit.
This has allowed both chains to tap into the smaller markets which are attracting growing shares of the population. And so while Home Depot and Lowe’s have seen moderate visits declines on a YoY basis, Harbor Freight and Ace Hardware have seen consistent YoY visit boosts since Q1 2024 – outperforming the wider category since early 2023.
Hy-Vee Bucks the Trend by Going Big
Are smaller stores a better bet across the board? At the end of the day, the success of smaller-format stores depends largely on the category. For retail segments that have seen visit trends slow since the pandemic – home furnishings and consumer electronics, for example – smaller-format stores offer brands a more economical way to serve their customers. Retailers have also used smaller-format stores to better curate their merchandise assortments for their most loyal customers, helping to drive improved visit frequency.
That said, a handful of retailers, such as Hy-Vee, have recently bucked the trend of smaller-format stores. These large-format stores are often designed as destination locations – Hy-Vee’s larger-format locations usually offer a full suite of amenities beyond groceries, such as a food hall, eyewear kiosk, beauty department, and candy shop. Rather than focusing on smaller markets, these stores aim to attract visitors from surrounding areas.
Visit data for Hy-Vee’s large-format store in Gretna, Nebraska indicates that this location sees a higher percentage of weekend visits than other area locations – 37.7% compared to 33.1% for the chain’s Omaha CBSA average – as well as more visits lasting over 30 minutes (32.9% compared to 21.9% for the metro area as a whole). For these shoppers, large-format, one-stop shops offer a convenient – and perhaps more exciting – alternative to traditionally sized grocery stores. The success of the large-format stores is another sign that though convenience isn’t everything in 2024, it certainly resonates – especially when paired with added-value offerings.
A Resurgence of Legacy Brands
Many retail brands have entrenched themselves in American culture and become an extension of consumers' identities. And while some of these previously ubiquitous brands have disappeared over the years as the retail industry evolved, others have transformed to keep pace with changing consumer needs – and some have even come back from the brink of extinction. And the quest for value notwithstanding, 2024 has also seen the resurgence of many of these (decidedly non-off-price) legacy brands.
In apparel specifically, Gap and Abercrombie & Fitch – two brands that dominated the cultural zeitgeist of the 1990s and early 2000s before seeing their popularity decline somewhat in the late aughts and 2010s – may be staging a comeback. Bed Bath & Beyond, a leader in the home goods category, is also making a play at returning to physical retail through partnerships.
Anthropologie, another legacy player in women’s fashion and home goods, is also on the rise. Anthropologie’s distinctive aesthetic resonates deeply with consumers – especially women millennials aged 30 to 45. And by capturing the hearts of its customers, the retailer stands as a beacon for retailers that can hedge against promotional activity and still drive foot traffic growth.
And visits to the chain have been rising steadily. In Q4 2023, the chain experienced a bigger holiday season foot traffic spike than pre-pandemic, drawing more overall visits than in Q4 2019. And in Q3 2024, visits were higher than in Q3 2023.
Meeting the Evolving Needs of Millennials
And speaking of the 35 to 40 set – the generation that all retailers are courting? Millennials. Does that sound familiar? Yes, because this is the same generational cohort that retailers tried to target a decade ago. As millennials have aged into the family-formation stage of life, their retail needs have evolved, and the industry is now primed to meet them.
Sam’s Club Draws Value-Conscious Singles and Starters
From the revival of nostalgic brands like the Limited Too launch at Kohl’s to warehouse clubs expanding memberships to younger consumers as they move to suburban and rural communities, there are myriad examples of retailers reaching out to this cohort. And Sam’s Club offers a prime example of this trend.
Over the past few years, millennials and Gen-Zers have emerged as major drivers of membership growth at Sam’s Club, drawn to the retailer’s value offerings and digital upgrades – like the club’s Scan & Go technology. Over the same period, Sam’s Club has grown the share of “Singles and Starters” households in its captured market from 6% above the national benchmark in Q3 2019 to 15% in Q3 2024. And with plans to involve customers in co-creating products for its private-label brand, Sam’s Club may continue to grow its market share among this value-conscious – but also discerning and optimistic – demographic.
Taco Bell Brings in Crowds With Value Nostalgia Menu
Millennials are also now old enough to wax nostalgic about their youth – and brands are paying attention. This summer, Taco Bell leaned into nostalgia with a promotion bringing back iconic menu items from the 60s, 70s, 80s, and 90s – all priced under $3. The promotion, which soft-launched at three Southern California locations in August, was so successful that the company is now offering the specials nationwide. The three locations that trialed the “Decades Menu” saw significant boosts in visits during the promotional period compared to their daily averages for August. And people came from far and wide to sample the offerings – with a higher proportion of visitors traveling over seven miles to reach the stores while the items were available.
What Lies Ahead?
Hot on the heels of a tumultuous 2023, 2024’s retail environment has certainly kept retailers on their toes. While embracing innovative value has helped some chains thrive, other previously ascendant value segments, including discount & dollar stores, may have reached their growth ceilings. Consumers clearly care about convenience – but are willing to make multiple grocery stops to find what they need. At the same time, legacy brands are plotting their comeback, while others are harnessing the power of nostalgia to drive millennials – and other consumers – through their doors.

