


.svg)


The holidays conjure up warm, cozy images of families sitting around artfully-set tables and enjoying delicious home-cooked meals. But for many people, Christmas Day is also a time to eat out. And while many restaurants are closed on December 25th, several national and regional chains keep their doors open for patrons eager to enjoy a nice, stress-free meal with loved ones – without the clean-up.
So with the holiday season in the rearview mirror, we dove into the data to explore nationwide December 25th dining trends – focusing our analysis on more than 100 chains, mostly full-service, with significant national or regional presence. Which brands are most popular on Christmas Day? And what differences can be observed in different regions of the country?
The Pacific West Takes the Lead
Nationwide, visits to dining chains nationwide were down 59.7% on December 25th, 2023, compared to a Q4 2023 daily average. But digging down deeper into the different areas of the country reveals significant regional differences.
The Pacific states – including California, Washington, Oregon, Alaska, and Hawaii – saw a drop of just 33.8% in dining visits on Christmas Day compared to the region’s Q4 2023 daily average. Next in line were the various regions of the South, where December 25th foot traffic dropped between 51.2% and 56.9%, followed by the Mountain states. And on the other end of the spectrum lay New England, where visits were down 83.3% compared to a Q4 baseline. Other areas of the Northeast and Midwest also experienced foot traffic dips in excess of 70.0% – indicating that residents of these areas are less likely to dine out on the holiday.
%20(1).avif)
Christmas Day is Breakfast Day
But which chains are most popular on December 25th? Analyzing the distribution of holiday visits among 25 leading Christmas Day restaurant destinations shows that three all-day breakfast chains – Waffle House, IHOP, and Denny’s – dominated the Christmas Day dining market this year.
Together, these 24/7 eateries, which tend to experience significant holiday visit bumps, accounted for an impressive 70.4% of holiday dining foot traffic. After a leisurely morning of presents and hot cocoa, it seems, nothing quite hits the spot like waffles, pancakes, and other breakfast favorites. And with affordable prices, seasonal menus, and special holiday vibes (complete with pajama-clad customers), these restaurants offer plenty of holiday cheer.
But breakfast chains aren’t the only dining venues that draw Christmas Day crowds. Red Lobster, the popular seafood chain, cornered 4.9% of this year’s December 25th dining foot traffic. And Applebee’s, Black Bear Diner, Golden Corral, and TGI Fridays each received between 2.0% and 3.0% of Christmas Day visits.
.avif)
A Variety of Local Favs
Drilling down deeper into the data for holiday visit trends shows that each state has its own favorite Christmas Day destination. In no fewer than 21 states nationwide – including New York, Texas, Michigan, and Florida – IHOP topped the chart. Denny’s and Waffle House, for their parts, each led the charge in 11 states, with Waffle House dominating the Christmas Day scene in much of the South.
But in some places, other chains topped the Christmas Day rankings. In Iowa, Minnesota, and North Dakota, people flocked to Perkins Restaurant & Bakery – the casual-dining chain known for its iconic pies and pancakes. In Wyoming and South Dakota, Red Lobster drew the biggest crowds. And in Oregon, Shari’s – a chain with some 80 locations in the western region of the country – attracted the most holiday visits.
.avif)
More Leisurely Meals
Foot traffic data also reveals, unsurprisingly, that visitors to the three Christmas Day leaders – Waffle House, IHOP, and Denny’s – spent more time in the restaurants on Christmas Day than they usually do. Some 17.3% of Christmas Day Waffle House visits lasted more than one hour – compared to 14.7% on an average day in 2023. IHOP and Denny’s also saw significant holiday increases in dwell time.
.avif)
If You Stay Open, They Will Come
Though many restaurants are closed on December 25th, chains that do stay open – especially all-day breakfast eateries – draw significant crowds. How will holiday winners like Waffle House, IHOP, and Denny’s continue to fare as people settle back into their post-holiday routines? And how will Christmas Day dining trends evolve nationwide in the years to come?
Follow placer.ai/blog to find out.

The Placer.ai Nationwide Office Building Index: The office building index analyzes foot traffic data from some 1,000 office buildings across the country. It only includes commercial office buildings, and commercial office buildings with retail offerings on the first floor (like an office building that might include a national coffee chain on the ground floor). It does NOT include mixed-use buildings that are both residential and commercial.
Has the remote work war run its course? For a while last year, it seemed like not a day went by without another headline proclaiming the demise of WFH. And as return-to-office mandates continued to pile up (et tu, Zoom?), the debate over offsite work productivity grew ever more rancorous.
But amidst all the noise, a new hybrid reality appears to have taken hold, offering both companies and employees the benefits of a mixed model. Yes, productivity can thrive outside the office – but there is something about the intangible spark that ignites when people interact with one another in person that has proven crucial to business success. So while recent survey data shows a precipitous drop in fully remote work over the past three years, most companies aren’t requiring people to go back to the office full time.
With these trends in mind, we dove into the data to explore the state of office foot traffic as the year drew to a close. How did December 2023 office visits compare to pre-COVID? And what impact did the holiday season have on the demographic profile of the typical office-goer?
December Holding Pattern Amidst Regional Differences
Last month, buildings in our Nationwide Office Index received 36.5% fewer visits than they did in December 2019 – reflecting a continuation of the same general holding pattern that has seen foot traffic hovering around 40.0% of pre-COVID levels, with some minor fluctuations.
But delving further into the data for key commercial hubs nationwide highlights the persistence of important regional differences – with New York City emerging as last month’s clear office recovery winner. In December 2023, the Big Apple experienced a year-over-four-year (Yo4Y) visit gap of just 19.2% – the smallest seen by the city in some time. At the other end of the spectrum lay San Francisco, with a Yo4Y visit gap of 53.1%.
.avif)
Who Goes to the Office in December?
But December is a bit of an outlier, work-wise. It’s the heart of the holiday season – kicked off by Thanksgiving at the end of November, and bookended by New Year’s Eve on the other side. And foot traffic data shows a small but distinct shift in the demographic profiles of office buildings’ captured markets – i.e. the areas their visitors come from – during the last month of the year.
Nationwide, and in major cities like New York and San Francisco, office-goers tend to come from relatively affluent areas with greater-than-average shares of one-person households. But over the final three months of 2023, both of these metrics in office buildings’ captured markets gradually declined. November office visitors were more likely to come from larger and lower-HHI households than October visitors – and December visitors were more likely to come from such households than November ones. This may reflect the greater flexibility of higher-HHI employees to work from home more often during the holiday season. It may also reflect a greater tendency on the part of singles to take extended trips to visit family during the holidays, and plug in from afar.
.avif)
Key Takeaways
Hybrid work may be here to stay, but employees and companies will likely continue to negotiate the exact terms of the new model in the months and years ahead. Are the remote work wars really over? And what will office recovery look like in the new year?
Follow placer.ai/blog to find out.
With their experiential vibes and treasured blends of well-known brands and local gems, high-street retail corridors are experiencing something of a renaissance. Iconic shopping districts like Fifth Avenue and SoHo in New York City, Rodeo Drive in Beverly Hills, and Newbury Street in Boston are seeing steady influxes of luxury and high-end apparel brands. And economic headwinds notwithstanding, consumers continue to flock to these important retail destinations to shop, grab a bite to eat, and take in all the sights and sounds they have to offer.
So with the new year upon us, we dove into the data to see how major urban shopping districts nationwide fared this holiday season. How did visits to these corridors in the final months of 2023 compare to last year? And who are the consumers driving the high-street revival?
Visits on an Upswing
Over the past six months, visits to major urban shopping districts have been consistently higher than they were last year. And as the holiday season kicked into gear, the year-over-year (YoY) growth trajectory trended upwards – indicating a robust turnout during this holiday period.
%20(1).avif)
Affluent, Educated Urbanites Driving Growth
To examine some of the factors behind this growth, we analyzed the demographic profiles of the captured markets of POIs (points of interest) corresponding to major high-street corridors throughout the country.
The analysis shows that throughout the U.S., high-street shopping districts hold special appeal for affluent audiences – and for consumers belonging to Spatial.ai’s PersonaLive’s “Educated Urbanite” psychographic segment. This segment encompasses well-educated young singles that live in dense urban areas and make relatively high salaries. Given the demographic profile of their visitors, it’s no wonder that high-street corridors are finding success while expanding their luxury and high-end apparel portfolios.
New York City’s Iconic Corridors
In Q4 2023, the captured markets of Fifth Avenue, SoHo, and Times Square all featured higher median household incomes (HHIs), and greater shares of the “Educated Urbanite” segment than New York’s statewide baselines. Each of these quintessential New York City landmarks, however, drew a somewhat different visitor base.
Fifth Avenue, with its array of museums, luxury high-rises, and expensive department stores, drew the most affluent crowd, with a captured market median HHI of $105.6K – some 35.7% above the statewide median. SoHo, for its part, known for designer apparel stores, trendy cafes, and whimsical tourist attractions (Museum of Ice Cream, anyone?), attracted the largest share of “Educated Urbanites.” And Times Square, a top Big Apple attraction with broad popular appeal, boasted a visitor profile closest to statewide baselines.
.avif)
California’s Main Drags
A look at the visitor profiles of major California shopping districts reveals a similar trend. The captured markets of Beverly Hills’ Rodeo Drive, Santa Monica’s 3rd Street Promenade, Hayes Valley in San Francisco, and Abbot Kinney in Los Angeles all had higher median HHIs in Q4 2023 than the statewide median of $85.7K. Of these, the captured market with the highest median HHI was that of Hayes Valley in San Francisco – an unsurprising finding given the relative affluence of the Bay Area. Not far behind was Rodeo Drive, with a median HHI of $113.9K.
Hayes Valley also led the charge for “Educated Urbanites,” with no less than 61.4% of the population of its captured market – nearly two-thirds – belonging to this segment. But all four of the analyzed high-street corridors were significantly over-indexed for this demographic compared to the California baseline of 13.1%.
.avif)
A Regional Roundup: Boston, Chicago, and Philadelphia
Looking at urban shopping districts in other major cities nationwide – including Newbury Street in Boston, Fulton Market in Chicago, and Walnut Street in Philadelphia – shows that the unique draw of these corridors for young, affluent singles isn’t confined to New York and Chicago. In all three corridors, the median HHIs and shares of “Educated Urbanites” in the captured markets
also exceeded statewide baselines – oftentimes by a wide margin.
.avif)
Final Thoughts
Evolving work routines and post-COVID population shifts continue to present municipalities and other civic stakeholders with significant challenges. But the revival of high-street retail corridors shows that cities are up to the task. How will major urban shopping districts fare in the new year? And how will their audiences continue to evolve?
Follow Placer.ai’s data-driven retail foot traffic analyses to find out.
Streets adorned in holiday lights, bustling Christmas stores and pop-ups, and local festivals all make the holiday season a truly magical time of year. So with Christmas in the rearview mirror, we dug into the data to explore some of the most beloved holiday spots throughout the country. Who visits Christmas stores? How do holiday events affect foot traffic to local hangouts? And what impact do annual parades have on major retail corridors like Chicago’s Mag Mile?
We dove into the data to find out.
Bronner’s: Year-Round Yuletide
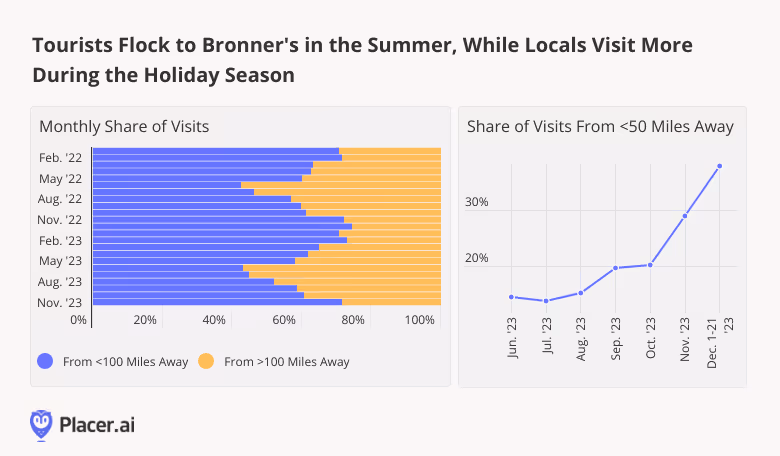
Bronner’s Christmas Wonderland in Frankenmuth, MI is the biggest Christmas store in the country – nay, the world. Spanning some 27 acres, the store carries everything from personalized holiday ornaments to Christmas trees. And the venue, which is open 361 days a year, has emerged as a true destination, where visitors can enjoy a taste of the holiday spirit and load up on all their Christmas essentials.
People visit Bronner’s all year round – but foot traffic to the store really picks up during the holiday season: Between November 1st and December 21st, 2023, the holiday wonderland drew a stunning 438.0% more daily visits, on average, than it did between January and October of this year.
Drilling down deeper into the data shows that much of this visit bump is driven by locals, who flock to Bronner’s during the Christmas season. Throughout the year, Bronner’s draws tourists from all over the country – and in the summer, most visits to the shop are by shoppers living more than 100 miles away. Individuals living within 100 miles of Bronner’s tend to visit closer to Christmas, when the time comes to stock up on supplies for the holiday. And as the holiday approaches, the share of true locals in Bronner’s visitor base – i.e. those living less than 50 miles away from the store – increases significantly.
Mozart’s Light Show
As the Yuletide season kicks into gear, special holiday-themed pop-ups and happenings also spring up throughout the country, with bars, malls, and restaurants all hosting special events filled with holiday cheer.
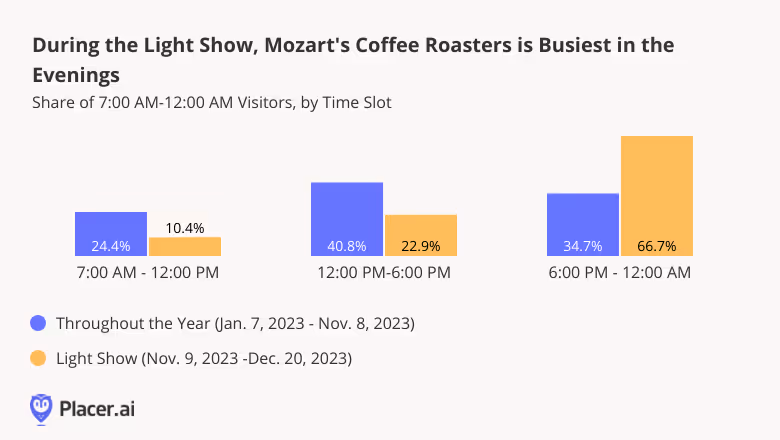
One venue that goes all out for the holidays is Mozart’s Coffee Roasters, the lakeside Austin, TX coffee shop that’s been a local landmark since 1993. With free wifi, expansive seating, and bottomless coffee, Mozart’s is the perfect place for remote employees to get some work done. And with hundreds of artists performing at the venue each year and a weekly open mic night, it’s also a great place to go out in the evenings. In the run-up to Christmas, Mozart’s hosts its famed annual holiday lights show, replete with a Bavarian Marketplace, a silent disco, and this year, an actual piece of Taylor Swift’s dance floor.
During the light show, Mozart’s is positively teeming with customers: Since the start of the event this year (November 9th), the coffee shop drew 104.3% more daily visitors, on average, than it did between January 7th (the end of last year’s show) and November 8th, 2023. And unsurprisingly, foot traffic data shows that most of this visit bump is driven by evening customers: During most of the year, the majority of visits to Mozart’s take place before 6:00 PM, with 24.4% concentrated in the morning hours. But when the festival kicks off, this pattern reverses – with 66.7% of visits taking place between 6:00 PM and midnight.
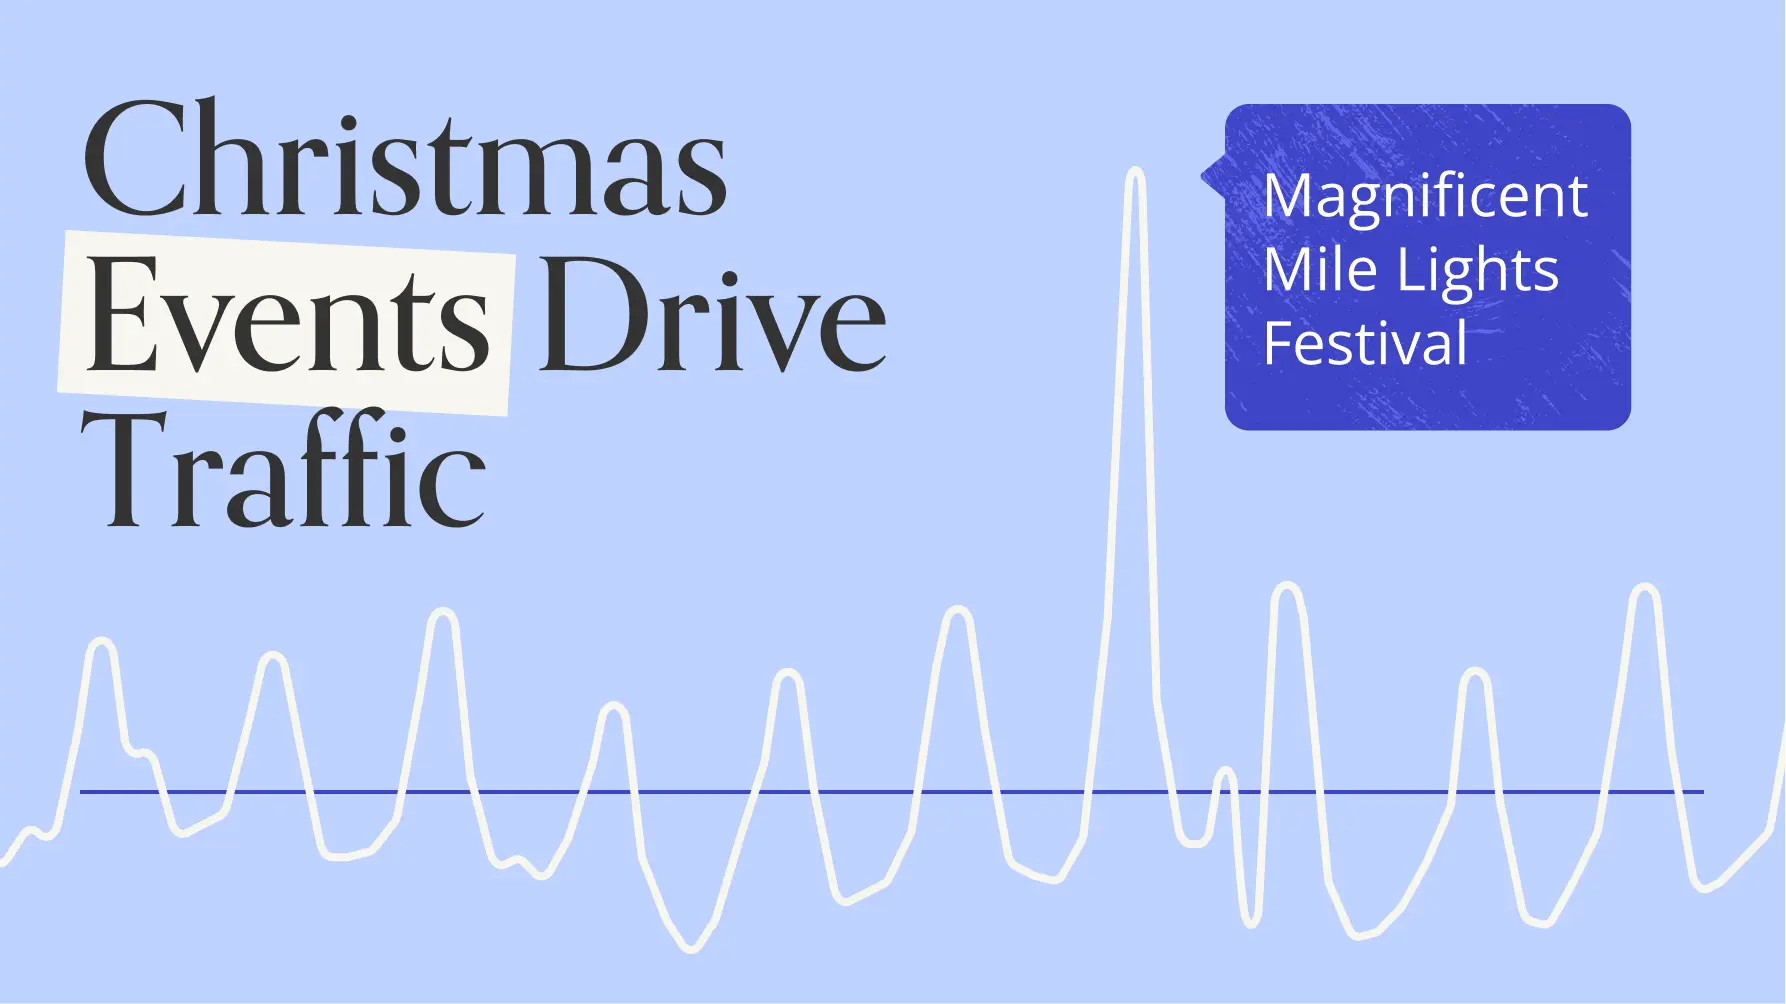
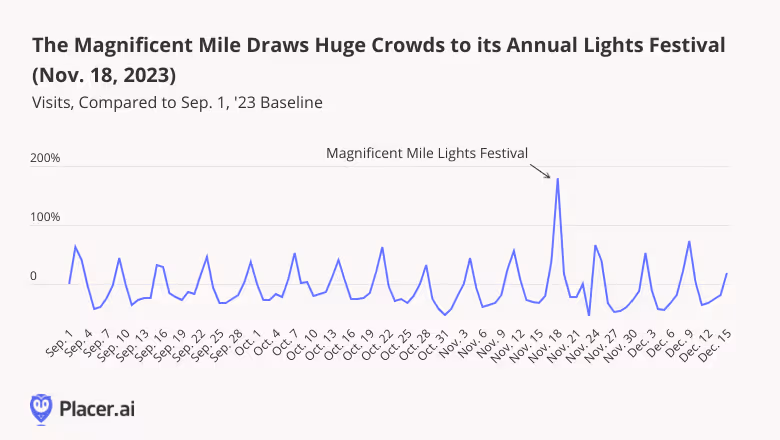
The Magnificent Mile’s Million Lights
Local parades and festivals are another mainstay of the holiday season. From New York’s iconic Macy’s Thanksgiving Day Parade to the Hollywood Christmas Parade in Los Angeles, cities across America draw massive crowds to streets decked out with holiday cheer.
One of the nation’s most timeless Christmas celebrations is Chicago’s Wintrust Magnificent Mile Lights Festival – an all-day bonanza that features a slew of booths and activities, a televised parade, and an impressive fireworks display. The festival, which famously illuminates the city with a million lights, is one of the Mag Mile’s prime events of the year. And comparing November 18th, 2023 foot traffic to the popular Chicago retail corridor – the day of the big event – to a September 1st 2023 baseline, shows that the festivities generated a tremendous 179.5% visit spike.
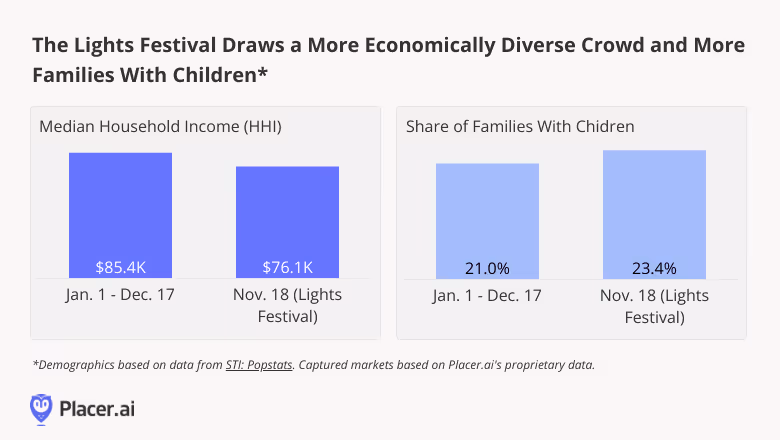
And a look at the demographic characteristics of visitors to the Mag Mile during the Lights Festival reveals that the celebration draws a more economically diverse crowd, as well as a larger share of families with children. Throughout most of this year, the median household income (HHI) of the Magnificent Mile’s captured market was relatively high – $85.4K. At the same time, the share of parental households in the retail corridor’s captured market increased from 21.0% to 23.4%, highlighting the event’s special appeal for families.
Key Takeaways
Everybody needs some seasonal cheer – and the sheer variety of holiday-themed events and festivals means there’s something for everybody. How will Christmas stores fare as the retail environment continues to evolve? And how will shifting urban landscapes impact local events, parades, and festivals in the years to come?
Follow Placer.ai’s data-driven retail and civic analyses to find out.

College students make up a small percentage of the overall U.S. population. But they often have money to spend – and back-to-college shopping is a significant driver of retail sales. This year in particular, students heading back to school were expected to spend record amounts on dorm decor, clothing, and other campus essentials. And since today’s college students make up a large chunk of tomorrow’s affluent consumers, retailers across industries are eager to cement positive relationships with the segment.
So with fall semester just under way, we dove into the data to explore the spending habits of today’s undergraduate young adults. When do they shop? What do they like to buy? And what can retailers do to get their attention?
A Distinctly Seasonal Affair
To get a sense of when collegians tend to do the most shopping, we analyzed the monthly share of college students in the captured markets of select retailers and segments, using audience segmentation data from Spatial.ai’s PersonaLive. And the analysis revealed that student consumer behavior follows a clear seasonal pattern.
In 2019, the share of college students in the captured markets of big box superstores like Target and Walmart peaked in August, and to a lesser extent in June, July, and September, as collegians enjoyed their summer vacations and did their back-to-school shopping. Additional upticks emerged in January, when many students were on winter break. But during regular school months, when midterms, finals, and homework likely kept many students hunkered down in the library, their share in the chains’ captured markets was much lower. While this pattern was disrupted in the wake of COVID, it returned in full force in 2022. Similar seasonality arose when looking at wider segments like apparel and off-price retail, as well as various dining categories.
Price Isn’t Everything
In addition to seasonality, the above graphs also appear to indicate that despite their tight budgets, collegians don’t necessarily prioritize price over everything else. So to further explore the shopping preferences of college kids, we examined the share of the #College segment in the captured markets of popular chains across categories.
Trade area data seems to indicate that university students shop at Target, frequent non-off-price-apparel chains, eat at fast-casual restaurants – and make up smaller shares of the customer bases of less expensive alternatives. Indeed, as hard-up as they may be, undergrads know how to splurge and are willing to pay for high quality stuff. They can’t get enough Urban Outfitters and love mid to higher range brands like Madewell and lululemon athletica.
At the same time, college students are highly oriented to thrift shops – especially those like Buffalo Exchange and Plato’s Closet, where they can sell their old clothes and snag stylish, name-brand items for a steal.
Seasonal Opportunities
Of course, the share of collegians in the captured market of any given retailer or segment can also be impacted by the behavior of other demographics. For example, if a particular chain attracts an extremely broad audience, a lower relative share of college students may indicate that their presence is being offset by other segments. Still, while a small share of collegians in a chain’s trade area may not necessarily mean that the chain does not appeal to this group, a disproportionate share of students in a chain’s captured market is a strong indication that the brand is embraced by this demographic.
And chains which see a smaller share of college students among their customer base may draw an outsize proportion of undergrads during peak season. Walmart’s captured market, for example, was just 14.0% over-indexed for the #College segment between September 2022 and August 2023, compared to a nationwide baseline. But looking just at August 2023 – peak college Back to School shopping season – the share of #College students in its captured market was 94.0% higher than the nationwide average. Walmart also enjoyed higher-than-average shares of collegians in September, June, July, January, and to a lesser extent – October. Dollar Tree, too, attracted an outsize share of collegians in the summer and in January.
Key Takeaways
Collegian shopping habits are shaped by the rhythms of campus life. And while students are budget-conscious, they place a high premium on quality and are willing to spend money on things that are important to them. Brands that can lean into college students’ seasonal groove – while providing the products they crave at price points that don’t break the bank – will be poised to win over this demographic, gaining customers that may stay with them for life.
How will college spending habits continue to evolve as the school year progresses? Which brands will stand out as collegian favorites?
Follow Placer.ai’s data-driven insights to find out.
Marriott International, Inc. has long been a dominant player on the U.S. hospitality scene. The company boasts a wide-ranging portfolio of some 31 brands, running the gamut from luxury chains like The Ritz Carlton to more budget-friendly options like Courtyard by Marriott. And with more than 8,500 locations worldwide, including some 5,700 in the U.S., the hotel giant is continuing to expand its footprint.
Against this backdrop, Marriott International’s decision last May to launch the hospitality industry’s first media network – leveraging visitor data to let external brands advertise to its customers – should come as no surprise. With millions of customers passing through its doors each year, Marriott is particularly well-placed to help relevant advertising partners reach new audiences. The network, powered by Yahoo, offers both online and offline marketing opportunities, including in-room television and digital-screen promotions.
To better understand the potential reach of Marriott’s advertising network, we dove into the data to explore the characteristics and preferences of the people that visit the hospitality leader’s various brands and locations. By layering foot traffic data with demographic and psychographic metrics from STI: Popstats, AGS Behavior & Attitudes, and Experian’s Mosaic, we examined Marriott’s different captured markets, gaining insight into the habits, interests, and profiles of its customer bases.
*A chain or venue’s captured market refers to the population residing in its trade area, weighted to reflect the actual share of visits from each Census Block Group comprising the trade area.
Something for Everyone
Marriott’s brands are divided into three tiers: Luxury, Premium, and Select. And with something for everyone, the company’s customer base encompasses a wide swath of society – from budget-conscious families looking for inexpensive accommodations, to affluent singles on the hunt for high-end, luxury getaways. Marriott also runs several extended-stay venues, including Residence Inn and TownePlace Suites.
A look at the profiles of visitors to four different Marriott chains shows that, as expected, wealthier patrons tend to frequent the company’s luxury hotels, while less affluent customers tend to visit its more budget-oriented Select brands. But even the company’s less pricey offerings – such as Four Points by Sheraton (acquired by Marriott in 2016) – attract consumers from relatively affluent areas. And certain Select tier destinations, like Marriott’s Millennial and GenZ-oriented Moxy Hotels, draw higher-HHI travelers than some Premium brands.
The household compositions and consumer preferences of visitors to Marriott’s various brands also differ. Four Points stands out as a prime destination for families with children, as well as older couples – while Moxy attracts an outsize share of “Young City Solos.” Moxy and Ritz Carlton guests are more likely to be museum goers and use ride share apps like Lyft and Uber. And visitors to Four Points and Westin locations are more apt to be into DIY home improvement.
Getting into the Groove with Moxy
One Marriott chain that has been doing particularly well in recent months is Moxy Hotels, a brand squarely targeted at the “young at heart.” Positioned as an experiential destination – a place to play, and not just stay – Moxy Hotels’ website exudes youthfulness, inviting travelers to “PLAY ON #ATTHEMOXY,” and touting the chain’s fun communal spaces. The rooms are relatively compact and affordable, and at some locations, guests can check in at the bar and claim a complimentary cocktail.
And the chain, which boasts some 120 properties across 23 countries (including more than 30 in the U.S.), experienced positive year-over-year (YoY) visit growth throughout H1 2023. While some of this growth is undoubtedly due to the chain’s continued expansion, the average number of visits to each Moxy Hotel also increased. The consumer quest for fun experiences, which has propelled experiential models in retail and dining, appears to be leaving its mark on the hotel industry as well.
Moxy Hotel’s highly targeted experiential vibe may make it particularly attractive for advertisers interested in reaching younger consumers. But while Moxy targets a pretty specific demographic, the profile of its customers is far from uniform. Visitors to Moxy’s New Orleans Hotel, for example, are more likely to have a lower HHI and to include families with children than visitors to its Washington, D.C. and East Village (New York) venues. And while more than 60.0% of visitors to the East Village Moxy in H1 2023 were locals hailing from less than 30 miles away, 81.5% of visitors to the New Orleans Moxy came from further away.
Looking Ahead
Buoyed by a post-COVID travel boom that has seen people flocking back to hotels and airlines, Marriott International – along with its media network – appears poised for further growth. While the network will undoubtedly harness Marriott’s own first-party data, including from its Bonvoy loyalty program, location intelligence can offer additional layers of insight into the actual audiences it is likely to reach.
For more data-driven foot traffic insights, visit Placer.ai.

