


.svg)


The Placer.ai Nationwide Office Building Index: The office building index analyzes foot traffic data from over 700 office buildings across the country. It only includes commercial office buildings, and commercial office buildings with retail offerings on the first floor (like an office building that might include a national coffee chain on the ground floor). It does NOT include mixed-use buildings that are both residential and commercial.
Return-to-office mandates are once again the talk of the town, with companies from Amazon to AT&T set to crack down on remote work in the new year – in some cases, demanding that workers show up in person five days a week.
But how did the office recovery shape up in December 2024? We dove into the data to find out.
December Doldrums
December is typically a quiet month for offices, with many Americans taking time off for the holidays to enjoy vacations and family gatherings. So, it may come as no surprise that office visits in December 2024 dropped to their lowest point of the year.
Compared to December 2019, office visits in December 2024 lagged by 39.2% – a bigger visit gap than that seen in either November (37.8%) or October (34.0%), as employees likely embarked on extended “workations” and enjoyed greater WFH flexibility during the holiday season. Put another way, December 2024 office foot traffic clocked in at 60.8% of pre-pandemic (December 2019) levels.
Still, offices were busier this December than last – in December 2023, the recovery compared to December 2019 stood at just 57.2%.
New York, Miami, and … San Francisco?
New York and Miami once again led the regional return to office (RTO) charge with Yo5Y visit gaps of 19.6% and 20.9%, respectively – though both cities’ Yo5Y numbers were weaker than those seen in either October or November.
Atlanta (-34.1%) and Dallas (-35.2%) also outperformed the nationwide average for Yo5Y office foot traffic. And with Dallas-based companies like AT&T and Southwest Airlines starting to enforce stricter in-office policies in the new year, the Texas hub may experience even more accelerated recovery in the coming months. (AT&T also has a strong presence in Atlanta, which may also benefit from the company’s crackdown.)
Meanwhile, San Francisco, which has long lagged in post-pandemic office recovery, finally pulled out of last place in December 2024 with a Yo5Y visit gap of 48.0%, just edging out Chicago. The impressive YoY office visit growth seen by the West Coast hub in recent months – likely fueled in part by Salesforce’s recent RTO mandate – appears to have finally left a tangible mark on the city’s Yo5Y ranking.
Atlanta and Boston Lead YoY Charge
Year over year (YoY), visits to office buildings nationwide were up 6.4% in December 2024 – showing that despite seasonal setbacks, office visits remain overall on an upward trajectory. Atlanta (13.7%) and Boston (12.1%) led the way for YoY office recovery, followed by Washington, D.C. (10.6%) and San Francisco (10.4%).
Looking Ahead
As additional RTO mandates go into effect in the new year, the office recovery needle may move once again. Will additional companies jump on the full-time in-office bandwagon – or will hybrid work models continue to dominate?
Follow placer.ai’s data-driven office index reports to find out.

About the Placer 100 Index for Retail & Dining: The Placer 100 Index for Retail and Dining is a curated, dynamic list of leading chains that often serve as prime tenants for shopping centers and malls. The index includes chains from various industries, such as superstores, grocery, dollar stores, dining, apparel, and more. The goal of the index is to provide insight into the wider trends impacting the retail, dining and shopping center segments.
A Calendar-Driven December Dip
In December 2024, retail and dining visitation slowed slightly, with overall visits to the Placer 100 Retail & Dining Index down 0.8% year over year (YoY). The December dip was likely due in part to an extra Saturday last year – the busiest day of the week for many retail and dining chains.
But comparing overall visits in November and December 2024 to the same months in 2023 shows that visits to the Placer 100 Index remained on par with 2023 levels (+0.0%) during the last two months of the year. So despite headwinds and a shorter shopping season (just 28 days between Thanksgiving and Christmas, compared to 33 last year), brick-and-mortar retail and dining establishments ultimately attracted the same number of holiday season visits, all told, as they did last year.
Value Chains and More
Ever since the launch of Chili’s Big Smasher Burger promotion in late April 2024, YoY visits to Chili’s have been on the rise, buoyed by diners eager to indulge in a full-service experience at a QSR price point. And in December 2024, the chain once again topped the Placer 100 rankings, with visits to the chain up an impressive 21.0% YoY – fewer Saturdays notwithstanding.
Fitness clubs also figured prominently on December’s Placer 100 list, as did budget mainstay Aldi – underscoring the continued robust demand for no-frills, value-oriented grocery offerings. Notably, Family Dollar saw a 4.2% YoY increase in average visits per location – potentially reflecting the success of parent company Dollar Tree’s rightsizing efforts. Meanwhile, Big Lots saw a 5.2% YoY visit bump, likely fueled by strong consumer interest in its liquidation sales.
Nordstrom: A Holiday Season Winner
But value wasn’t the only winner of this year’s holiday season. Upscale department store Nordstrom enjoyed a substantial YoY visit uptick in November and December 2024 – with overall visits to the chain rising 6.5%. This stands in sharp contrast to the wider department stores sector, which experienced a 3.2% decline during the same period.
A look at the demographic profile of Nordstrom’s captured market shows that the chain’s success is likely due in part to its affluent – and young – customer base. In November and December 2024, the median household income of the census block groups (CBGs) from which Nordstrom drew its shoppers – weighted to reflect the share of visitors from each CBG – stood at $113.1K, significantly higher than the $81.3K median for the wider department store space. Nearly a third of Nordstrom's captured market (27.4%) was composed of “Ultra Wealthy Families” – compared to 9.5% for the sector as a whole. And unlike other department stores, which were slightly less likely than average to attract “Young Professionals,” that segment made up 9.7% of Nordstrom’s captured market, well above the nationwide baseline of 5.8%. As Gen-Z leads the charge back to malls, Nordstrom’s robust foothold among younger consumers bodes well for its future success.
Like many department stores, Nordstrom relies on the holiday season to bolster its annual bottom line – in 2024, November and December visits accounted for nearly a quarter (22.5%) of the chain’s total visits for the year. A strong performance during these critical months is a positive signal of good things to come – and with the chain being taken private by its founding family, we may see moves aimed at further solidifying Nordstrom’s position in the months ahead.
Looking Ahead
Despite fewer shopping days, the 2024 holiday shopping season proved resilient – with overall visits to the Placer 100 Retail & Dining Index remaining on par with 2023 levels. While value chains continued to dominate the rankings, upscale retailers like Nordstrom also enjoyed significant success. What trends will the Placer 100 Index uncover in the new year?
Visit placer.ai to find out.

Christmas is a time for gathering at home, but it’s also an occasion when many Americans celebrate by treating themselves to a nice meal out with family and friends. So with the holiday season drawing to close, we dove into the data to see which dining segments benefited from the holiday cheer.
Full-Service Feasting
The holiday season is all about home-cooked meals, and most restaurants close on Christmas Day – so it may come as no surprise that visits to dining establishments dropped significantly on December 25th, 2024. Fast-casual and quick-service restaurants (QSRs) saw the steepest traffic declines of 92.7% and 83.2%, respectively, compared to a year-to-date (YTD) daily average. Meanwhile, full-service restaurants (FSRs), aided primarily by all-day breakfast chains (see below), saw visits dip by a relatively modest 58.0%.
On Christmas Eve, too, restaurant foot traffic slowed, with visits to fast-casual restaurants and QSRs dipping to 35.5% and 25.1%, respectively, below average levels. Once again, FSR led the pack with a smaller 11.0% visit decline. And on December 26th – the day after the holiday – full-service restaurants saw a 7.0% visit uptick, while QSRs and fast-casual saw visits hover just under daily averages.
Christmas Eve: A Premium Experience
But digging deeper into the data reveals a more nuanced picture of the Christmas dining scene. Throughout the holiday, some FSR segments and chains enjoy outsized visit spikes – cementing their roles as key holiday destinations for families seeking to ditch the kitchen chaos and enjoy a hassle-free, celebratory meal.
On Christmas Eve (December 24th, 2024), for example, visits to upscale and fine dining chains surged by a remarkable 54.4% compared to a YTD daily average – fueled by visit spikes at premium chains such as Ruth’s Chris Steak House (129.8%) and Fleming’s Prime Steakhouse & Wine Bar (125.9%). Breakfast spots also enjoyed a significant 18.4% Christmas Eve visit bump, likely bolstered by seasonal offerings like Denny’s Holiday Turkey Bundle. Meanwhile, traffic at eatertainment chains and other casual dining restaurants slowed considerably – though some casual dining brands like experiential The Melting Pot and Benihana also bustled with activity.
Deck the Halls With Breakfast Favorites
On Christmas Day, it was breakfast chains that once again led the day – staying open to serve up hearty meals to those looking for an affordable holiday outing. Visits to leading breakfast spots, including segment leaders like Waffle House, IHOP, and Denny’s soared by 53.6% compared to a YTD daily average, with Waffle House in particular stealing the show with a 109.6% visit boost.
Still, Christmas Day diners also flocked to other full-service chains that kept their doors open. Fogo de Chão, which attracted celebrants with an indulgent seasonal menu, saw visits soar by 111.4%. And after increasing by 63.2% on Christmas Eve (see above), visits to Benihana surged by 103.9% on December 25th, reaffirming the restaurant’s place in holiday dining lore (“A Benihana Christmas”, it seems, isn’t just for fans of The Office).
Winding Down With Eatertainment
On December 26th, all the analyzed FSR segments enjoyed visit bumps, as many Americans took the day off to extend the holiday cheer. But it was eatertainment chains that saw the most pronounced traffic boost (26.2%), buoyed by families and friends looking to unwind with good food and games – many armed with holiday gift cards.
But plenty of other FSRs also thrived on Boxing Day with impressive mid-week traffic increases, including perennial favorites like P.F. Chang’s (+35.2%), The Cheesecake Factory (+28.1%), and Buffalo Wild Wings (+26.1%).
A Very Merry Showing
Food remains at the heart of the holiday experience – with elevated dining, affordable comfort food, and eatertainment all adding to the festive spirit. And in 2024, restaurants delivered very merry results. How will the industry continue to perform in the new year?
Follow Placer.ai’s data-driven dining analyses to find out.

After reaching new heights in October 2024, how did the office recovery fare in November? We dove into the data to find out.
Two Steps Forward, One Step Back…
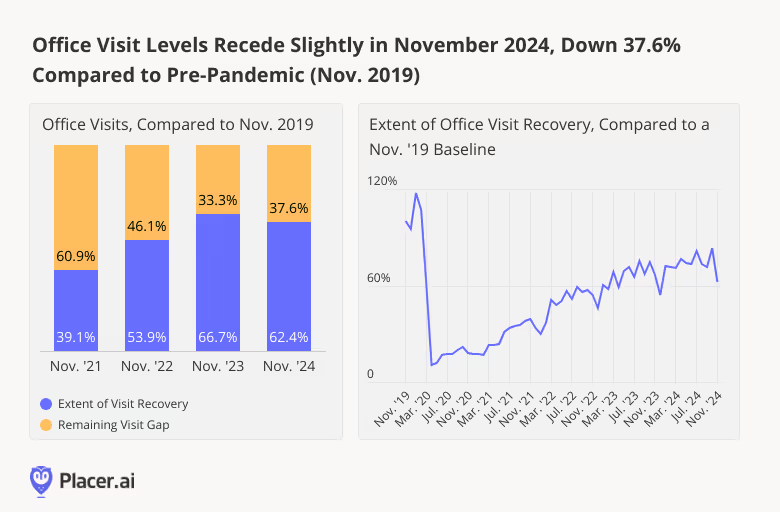
In November 2024, visits to office buildings nationwide were 62.4% of what they were in November 2019, down from 66.7% in November 2023. This marks the most substantial drop in office foot traffic since January 2024 – and a sharp decline from October 2024.
But though significant, November’s downturn is likely a reflection of this year’s record-breaking Thanksgiving travel rather than of any real office recovery slowdown. Millions of Americans took to the skies and roads to spend the holiday with loved ones. And with remote work making it easier than ever before for professionals to plug in from virtually anywhere, many likely extended their trips without taking extra days off – leading to fewer office visits in the days leading up to the holiday.
Miami and New York Continue to Lead in Post-Pandemic Recovery
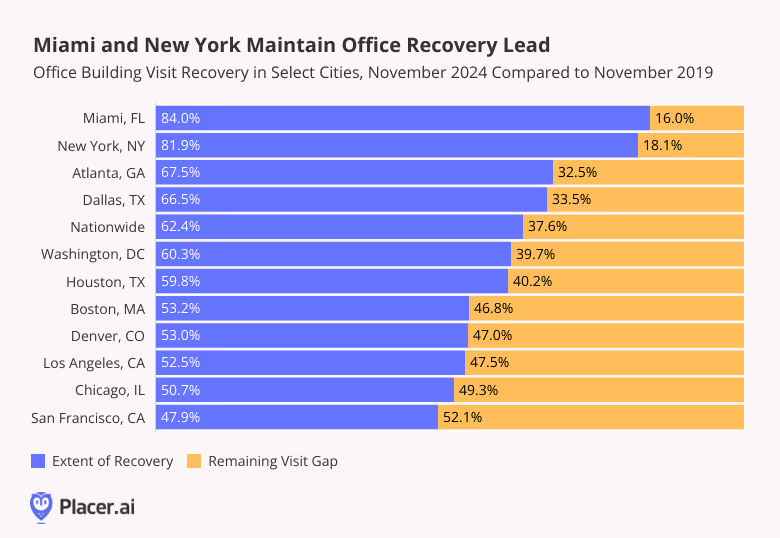
Taking a look at regional trends, Miami continued to outshine other cities in November 2024, with visits at 84.0% of pre-pandemic levels – perhaps due in part to strict return-to-office (RTO) policies implemented by major players within the city’s growing tech and finance sector. New York came in second with recovery at 81.9%, while San Francisco continued to lag behind other major cities. But with major projects like the September 2024 grand opening of the revamped Transamerica Pyramid set to revitalize the city’s Financial District, more accelerated recovery may be ahead for this West Coast hub.
Miami and San Francisco Buck the (YoY) Trend
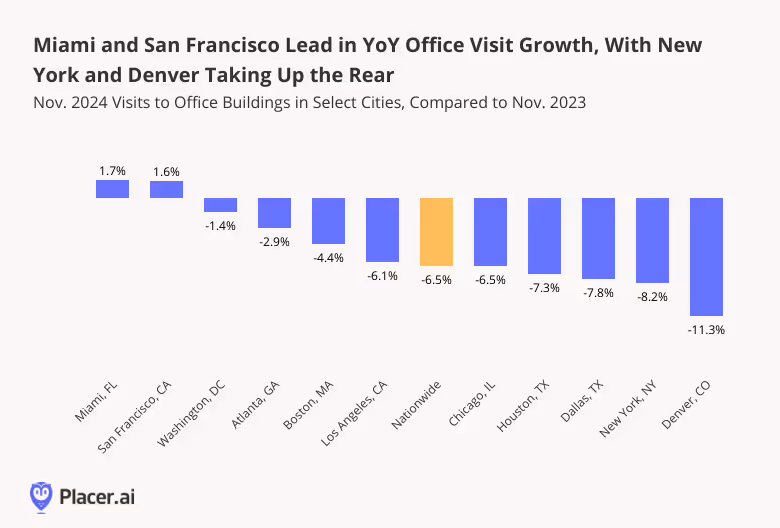
Indeed, San Francisco was among November 2024’s regional leaders for year over year (YoY) office visit growth. Nationwide, office building foot traffic was down 6.5% YoY. But in San Francisco, visits increased 1.6% – likely bolstered by recent RTO mandates from major local employers like Salesforce. The city’s temperate climate may also have played a role in encouraging residents to stay local for the holidays. Miami, too – a popular holiday destination in its own right – saw visits increase 1.7% YoY.
Denver, meanwhile, experienced its fourth snowiest November on record, which may have contributed to a larger portion of its workforce embracing remote work during the month – and an 11.3% YoY visit decline. And in New York, extended “workcations” by remote-capable finance employees, as well as potential disruptions in public transit and increased congestion during the holiday season, may have fueled a larger-than-average drop. Given the Big Apple’s strong overall recovery trajectory, we will likely see a rebound to more robust YoY growth by January, when the holiday season winds down.
Looking Ahead
While Thanksgiving travel created a temporary headwind for office recovery, cities like Miami and San Francisco demonstrate that the story is far from uniform. And looking ahead to the coming months, the office recovery still appears poised to continue apace.
For more data-driven office recovery analyses, follow Placer.ai.

Hot on the heels of last year’s Barbenheimer phenomenon, 2024 brought us “Glicked”— the powerhouse pairing of Gladiator II and Wicked that lit up movie theaters across the country. How did these box office juggernauts – followed just a few days later by Disney’s much-anticipated release of Moana 2 – impact movie theater foot traffic during the Thanksgiving holiday weekend?
We dove into the data to find out.
A Box Office Triple Whammy
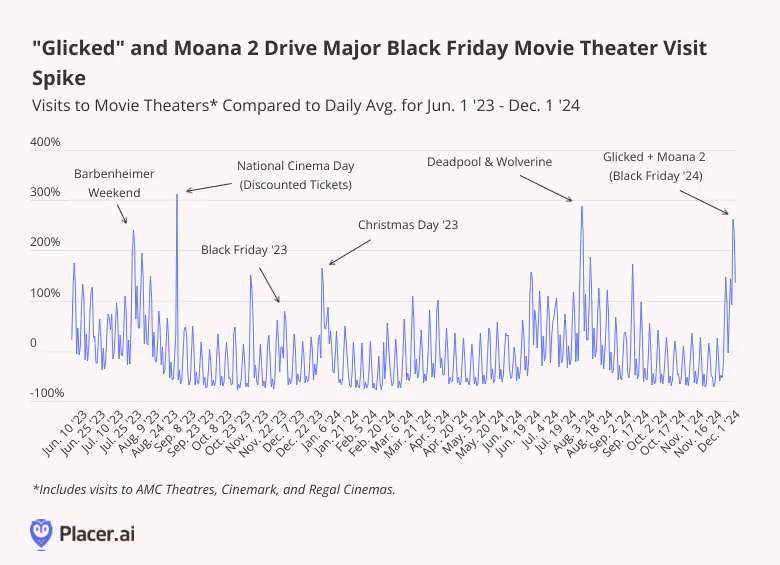
On its premiere day (Friday, November 22nd, 2024) “Glicked” drew a 69.2% increase in movie theater visits compared to the daily average between June 1, 2023 and December 1, 2024. By Saturday, November 23rd, foot traffic surged by a dramatic 147.3%, solidifying the weekend as one of the most memorable of the year. And on Wednesday, November 27th, the release of Moana 2 drove an impressive 142.6% foot traffic increase.
But the real box office magic came on Black Friday (November 29th), when the combined power of Glicked, Moana 2, and the holiday shopping frenzy fueled an epic 263.2% surge in theater visits – making November 29th the third busiest for theaters since June 1st 2023. Foot traffic to movie theaters on this year’s Black Friday even outpaced the unforgettable levels seen on Barbenheimer Saturday (July 22nd, 2023), when visits soared to 241.0% above the daily average.
Not Just for Retail Therapy
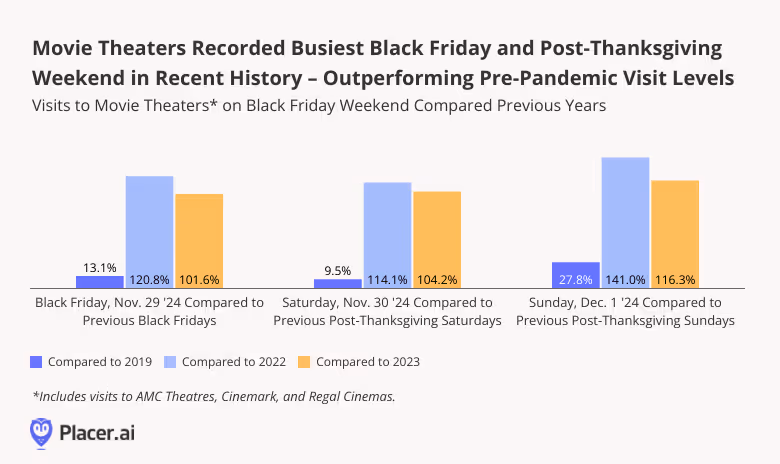
Black Friday is always a busy time for movie theaters. In 2019, movie theater visits on Black Friday (November 29th, 2019) were up 80.2% compared to an average 2019 Friday – while in 2022 and 2023 (November 25th, 2022 and November 24th, 2023), they were up 40.8% and 39.4% compared to an average Friday for each of those years.
And in 2024, Black Friday cinematic foot traffic surged past previous years’ benchmarks – surpassing even pre-pandemic levels. On November 29th, 2024, visits to movie theaters were 13.1% higher than on Black Friday in 2019 – and the effect lasted through the weekend, pushing visits up 9.5% and 27.8% on the Saturday and Sunday after Thanksgiving compared to the equivalent period of 2019.
Time Slots That Stole the Show
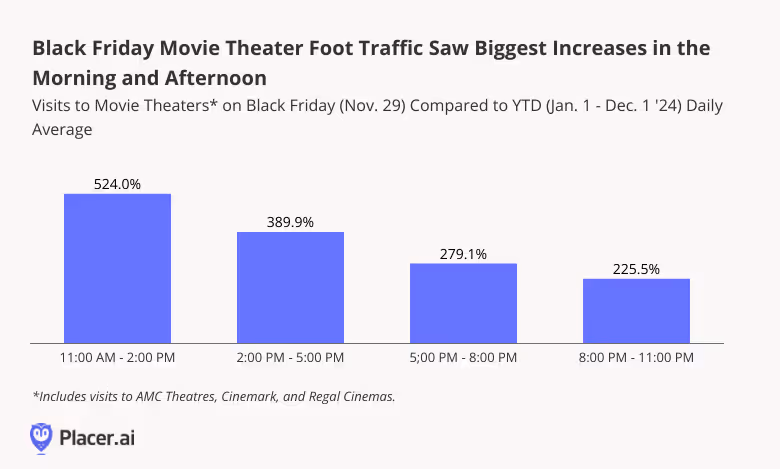
But the Black Friday foot traffic surge wasn’t distributed equally throughout the day. Unsurprisingly given the holiday weekend, morning and early afternoon screenings saw the most impressive visit increases – with foot traffic up an incredible 524.0% between 11:00 AM and 2:00 PM compared to an average year-to-date (YTD) Friday. Afternoons (2:00 PM–5:00 PM) weren’t far behind, with visits climbing 389.9%. But impressively, even though Friday evenings are typically busy times for movie theaters year round, visits on the evening of Black Friday surged by more than 200% between 5:00 PM and 11:00 PM.
Metro Madness: Which Cities Led the Pack?
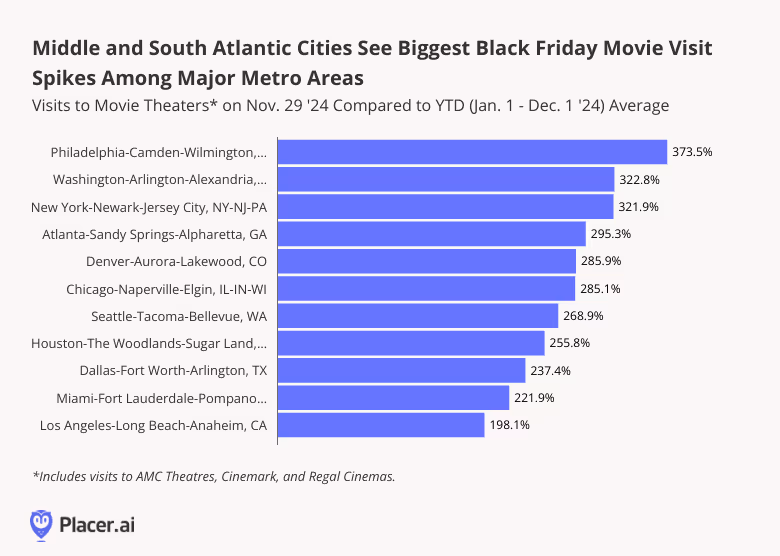
Black Friday’s box office boost also wasn’t evenly spread across the map. Leading the charge was the Philadelphia-Camden-Wilmington area, where theater visits soared by an astonishing 373.5% compared to its 2024 year-to-date average. Close on its heels were Washington, D.C. (322.8%) and New York (321.9%), proving that East Coast audiences were all in for some big-screen magic.
Interestingly, Black Friday was less resonant on the West Coast, particularly in California, where the cultural pull of the big shopping day seems to be less strong. Los Angeles, for example, saw a more modest boost in visits, reflecting the region’s typically lighter Black Friday enthusiasm.
The Power of a Big-Screen Spectacle
Black Friday, it turns out, isn’t just about shopping – it also has the power to supercharge movie theater foot traffic. And while Gladiator II, Wicked, and Moana 2 all drew crowds on their opening days, the strategic timing of their pre-holiday releases drove a Black Friday visit surge for the ages. Whether driven by the thrill of a new hit or the magic of the holiday season, people are returning to theaters – and in record numbers.
For more data-driven consumer behavior insights, visit placer.ai.

Black Friday is the biggest retail milestone of the year – drawing millions of shoppers to stores nationwide. And even as e-commerce claims a growing piece of the holiday shopping pie, consumers flock to brick-and-mortar retailers to browse the aisles, check out new products, and enjoy the festive holiday atmosphere.
But how did brick-and-mortar retailers fare during this year’s Black Friday? Did the high-stakes shopping period deliver?
Brick-and-Mortar Retail Visits Up 0.9% YoY
Black Friday has evolved into a multi-day shopping bonanza. Early holiday sales draw crowds well before Thanksgiving, and major markdowns continue into the weekend and through Cyber Monday. Still, foot traffic data shows that the traditional milestone hasn’t lost its touch. On November 29th, 2024 visits to retailers nationwide surged by 40.4% compared to an average Friday this year – up slightly from 39.8% in 2023.
Year over year (YoY), retail foot traffic increased 0.9% on Black Friday this year – a modest uptick, but one which highlights the resilience of physical retail in an increasingly digital world. Most of the days during the week leading up to Black Friday also saw modest YoY visit increases, as shoppers got a head start on their bargain hunting. And the Saturday and Sunday following the milestone saw more significant YoY visit increases of 2.0% and 6.2%, respectively – perhaps driven in part by customers picking up orders placed online during Black Friday.

Regional Factors at Play
Digging deeper into the data for different areas of the country shows that the resonance of the milestone varies significantly by region. In Delaware and New Hampshire, visits to retailers on November 29th were up a whopping 75.9% and 72.8%, respectively, compared to an average Friday this year. And in much of the Midwest – including North and South Dakota, Nebraska, Indiana, Minnesota, Wisconsin, Iowa, Kentucky, Tennessee, and Kansas – retail foot traffic surged by more than 50.0%. By contrast, Western states such as California (26.0%), Wyoming (24.1%), New Mexico (24.5%), Montana (31.3%), Colorado (32.6%), Nevada (33.1%), and Utah (33.6%) experienced much more modest visit boosts.

The differences in statewide Black Friday performance may reflect more general regional Black Friday patterns. Though the Mountain states saw smaller Black Friday visit spikes than other areas of the country, retail visits in the region on November 29th, 2024 were up 4.1% YoY – perhaps a sign that the milestone is growing in local importance. The Eastern and Western South Central regions saw YoY visit increases of 3.7% and 2.8%, respectively – while the South Atlantic region saw a 1.5% increase. Meanwhile, some of the areas where Black Friday is most resonant – including the Midwest – saw visits remain flat or fall slightly below 2023 levels.

No Room for FOMO
Holiday shopping is about more than just making transactions – consumers eagerly leave the comfort of their homes to embrace the thrill of the treasure hunt, explore new products firsthand, and enjoy the experience of shopping with friends. And foot traffic data shows that Black Friday retains plenty of in-person appeal.
For more data-driven insights, visit placer.ai.

