


.svg)


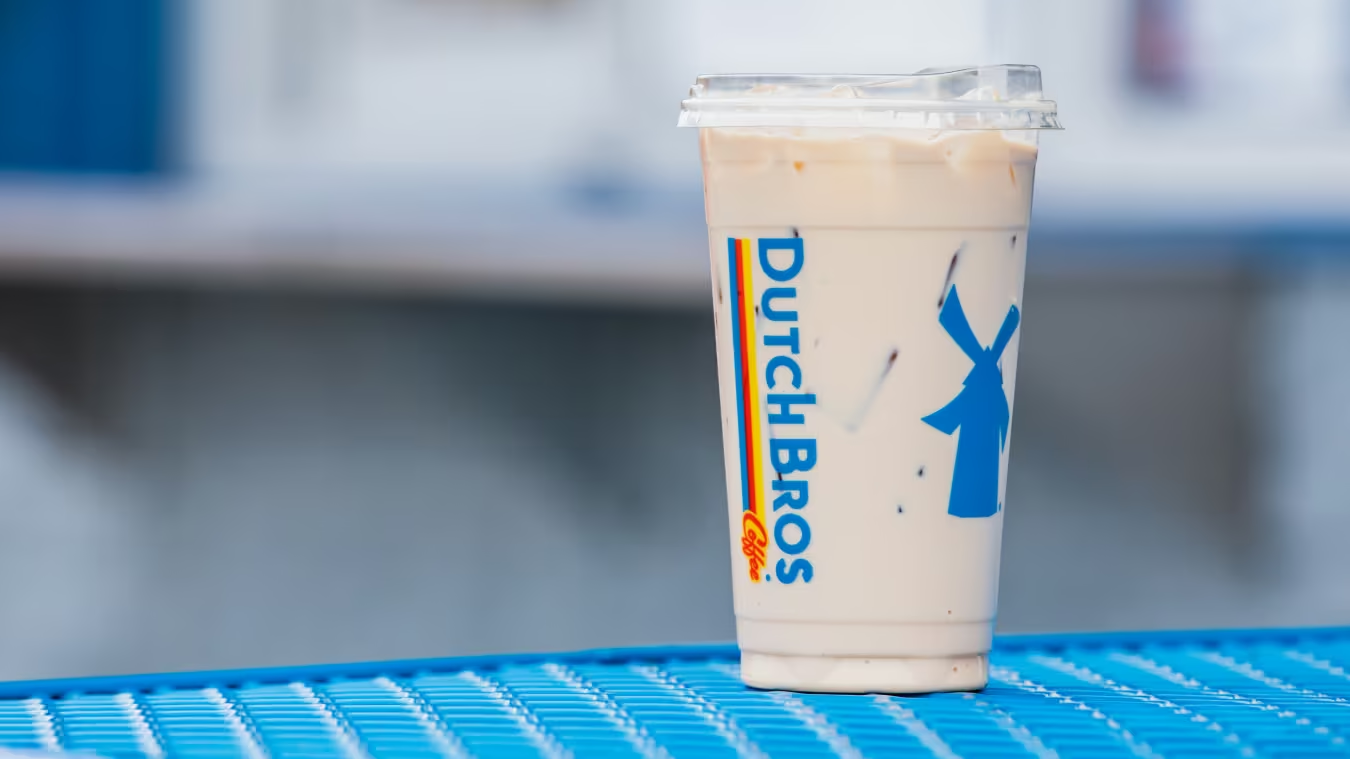
Dutch Bros has long been a powerhouse in the beverage space, building its business with rapid expansion and securing a loyal following. But to maintain its growth momentum, Dutch Bros will likely need to look beyond its beverage-first identity. By strategically expanding its breakfast offerings, the brand can attract a new segment of morning diners while driving incremental spend from its existing loyal customer base.
Balancing Rapid Growth with Store Maturity
Dutch Bros is still on an aggressive growth trajectory, with plans to continue opening new locations at a brisk pace. The company passed the 1,000-unit mark this year and aims to reach over 2,000 locations nationwide by 2029. However, recent data suggests that while the brand's overall footprint is expanding, its established locations are facing the typical challenges of a maturing brand.
Throughout much of 2025, total visits to Dutch Bros increased rapidly year-over-year (YoY), driven largely by new store openings. And while same-store visits – which measure the performance of locations open for at least a year – were also generally positive, the growth was somewhat uneven. So although the brand’s expansion is still meeting robust demand, the gap between total growth and same-store performance may indicate that Dutch Bros is reaching a level of saturation in its initial markets.
To sustain growth, the brand is targeting the morning daypart by introducing breakfast offerings, reaching approximately 160 stores by the end of September 2025 and plans to deploy the menu across its store fleet in 2026. This strategy appears to be paying off: November saw same-store visits surge to their highest levels of the year. While this spike was likely supported by holiday menu launches and Black Friday, it also suggests the breakfast initiative is gaining traction and successfully revitalizing performance at established locations.
Closing the Breakfast Gap
Why is Dutch Bros betting on breakfast? Historically, Dutch Bros has seen a lower percentage of its daily traffic occur during the morning daypart than its competitors. And when comparing the chain’s hourly visit distribution to the wider coffee category, it becomes clear why the shift toward a more robust breakfast offering is a logical move for Dutch Bros. While the coffee category as a whole sees 43.1% of its total daily visits between 5:00 and 11:00 AM, Dutch Bros captures only 32.6% during that same window, according to the chart below.
To bridge this gap, Dutch Bros is evolving its menu to include more substantial food options. Food currently accounts for only about 2% of Dutch Bros’ total sales, a figure it hopes to increase significantly with the help of hot breakfast items. As Dutch Bros continues to roll out the expanded food lineup to more locations in 2026, the brand is positioning itself to compete directly for the morning commuter who currently heads to a competitor for a meal-and-drink combo.
And to further bolster its morning performance, Dutch Bros could lean into "functional fuel" trends that complement its popular protein coffee and are likely to appeal in particular to younger consumers who prioritize health-conscious menu options.
More Fuel for the Future
Dutch Bros is at a pivotal point in its evolution. While new store openings continue to drive visits, the brand is now focusing on deepening its relationship with customers through the breakfast daypart. If the recent uptick in same-store visits is any indication, the shift from a "beverage-first" destination to a well-rounded morning stop could be exactly what the company needs to sustain its long-term momentum.
For more dining insights, visit Placer.ai/anchor.
Placer.ai leverages a panel of tens of millions of devices and utilizes machine learning to make estimations for visits to locations across the US. The data is trusted by thousands of industry leaders who leverage Placer.ai for insights into foot traffic, demographic breakdowns, retail sale predictions, migration trends, site selection, and more.

Retail corridors have long been central to the holiday experience, offering festive spaces for shopping and intricate window displays to admire. But retail corridors can vary significantly – some cluster large global flagship stores, while others lean into smaller regional formats and boutique-style shops, creating a more lifestyle-oriented setting for spending time with friends and family.
We dove into the data for these two types of retail corridors to explore the foot traffic trends defining each space this holiday season.
End-of-Year Traffic Boost Particularly Strong For Flagship-Led Corridors
Flagship-led corridors such as SoHo in New York City and Union Square in San Francisco typically see their visitation peak in December, when consumers come to browse elegant window displays, holiday lights, and seasonal attractions – often turning a shopping trip into a full outing with friends or family. Union Square’s towering Macy’s Christmas tree, outdoor ice rink, and “Winter Walk” draw crowds looking for a quintessential holiday atmosphere. And SoHo, home to numerous high-end flagship stores, remains one of Manhattan’s most sought-after luxury shopping districts during the holidays.
Both corridors have seen rising visits throughout 2025, suggesting that their December 2025 lifts could exceed last year’s levels.
Lifestyle-Driven Retail Corridors See Strong Lift in Spring & Summer
However, retail corridors that center on boutiques, independent retailers, and lifestyle-oriented offerings rather than global luxury flagships – like Back Bay in Boston and South Congress Avenue in Austin – follow a different seasonal rhythm. Rather than peaking at year-end, visits to these districts spike earlier in the calendar.
Back Bay perhaps benefits from “Open Newbury,” the summer program that closes Newbury Street to vehicular traffic and turns the corridor into a pedestrian promenade, while South Congress sees heightened activity in the spring, before the Texas heat arrives. Both have also seen solid visit growth in 2025, indicating the potential for a healthy December – even if holiday foot traffic plays a smaller role in their overall annual performance compared to flagship-led districts.
Positioning Retail Corridors for a Strong 2026
As both flagship-led and lifestyle-driven corridors head into December with solid year-to-date momentum, high street retailers have a clear opportunity to capitalize on distinct seasonal strengths. Flagship districts should be prepared for an especially pronounced holiday surge, while lifestyle-oriented corridors can focus on converting growing spring and summer foot traffic bumps into sustained engagement year-round.
For more foot traffic insights, visit Placer.ai/anchor.
Placer.ai leverages a panel of tens of millions of devices and utilizes machine learning to make estimations for visits to locations across the US. The data is trusted by thousands of industry leaders who leverage Placer.ai for insights into foot traffic, demographic breakdowns, retail sale predictions, migration trends, site selection, and more.

As the retail calendar approaches its most pivotal stretch, we took a closer look at foot traffic trends across superstores and warehouse clubs to see how these key players are performing.
Superstores and Warehouse Clubs Ramp Up Towards the Holidays
Warehouse clubs – Costco, Sam’s Club, and BJ’s Wholesale – continued to post visit gains in recent months, extending the momentum that has defined the segment for much of the past year. Their consistent performance reinforces the appeal of the wholesale model among value-driven shoppers navigating inflationary pressures and tighter budgets.
However, within the broader mass merchandise sector, October marked a clear turning point. Walmart saw its strongest year-over-year (YoY) visit gains of the last six months, while Target’s traffic shifted from negative to positive growth for the first time during the same period. The October surge coincided with the superstores' early early holiday sales events, signaling that the early holiday season has evolved into a pivotal retail moment.
Costco’s Opening Hours Shift Continues to Shape Consumer Behavior
Costco led foot traffic growth among mass merchants in September and October 2025. And some of that momentum may stem from the chain’s new early opening hours for Executive Members, which appears to have eased peak-hour congestion and enhanced the overall shopping experience.
As a reminder, Costco Executive Members pay almost twice as much as standard Gold Star members and account for over 74% of the chain’s sales, so it makes sense that Costco would look to add value and additional perks to its premium memberships.
But since extending its hours to open an hour early for Executive Members, Costco has likely enhanced the overall shopping experience for all visitors.
The graph below shows that between July and October 2025, after the introduction of early openings, the extended morning hours reduced Costco’s traffic at peak times compared to 2024, spreading visits more evenly throughout the day – which means less crowding for everyone.
Earlier openings also affect how Costco shoppers shop. Since the new hours took effect, the share of Costco visits lasting 30 to 45 minutes has increased, while the share of 45- to 60-minute visits has declined. This shift suggests that with lighter crowds and easier navigation, Costco shoppers are more purposeful and efficient.
Meanwhile, the share of Costco visits lasting less than 30 minutes also fell during the July to October period, suggesting that in a more streamlined environment, some shoppers feel comfortable taking extra time to browse – and perhaps add a few more items to their baskets – rather than rushing through a crowded store.
Well-Positioned Before the Holiday Rush
As the main holiday season approaches and consumer sentiment reaches new lows, value-forward warehouse clubs appear to remain in a strong position. Meanwhile, superstores’ success with early sales events demonstrates that shoppers remain highly responsive to promotions, an encouraging sign heading into the peak shopping period.
By offering early access to Executive Members, Costco is both recognizing its most valuable shoppers and alleviating crowding for everyone during typical rush periods – a move that could give the retailer an edge during the busy holiday season.
How will these retailers close out the holiday season? Visit Placer.ai/anchor to find out.
Placer.ai leverages a panel of tens of millions of devices and utilizes machine learning to make estimations for visits to locations across the US. The data is trusted by thousands of industry leaders who leverage Placer.ai for insights into foot traffic, demographic breakdowns, retail sale predictions, migration trends, site selection, and more.

The home improvement sector continues to face challenges in 2025, and category leaders Lowe’s and The Home Depot continue to navigate shifting demand. Yet signs of resilience are beginning to emerge as both brands report strength across key mid-range categories and identify opportunities to drive the next phase of growth.
We dove into the data for The Home Depot and Lowe’s to find out what location analytics reveals about their performance and evolving strategy.
Reason For Optimism in the Industry
In their recent Q2 2025 reportings, both Lowe’s and The Home Depot underscored an important dynamic – while comparable sales and average ticket size increased, comparable transactions declined. Both retailers attributed this pattern to a shift in the mix of projects. Although the quarter saw notable strength in seasonal items, repair and maintenance supplies, and some bigger-ticket items, consumers continued to defer large discretionary renovation projects that typically require financing. This aligns with both retailer’s modest YoY traffic declines during most months since November 2024, since larger projects tend to require more store visits than smaller upgrades or repair projects.
Yet, both companies remain cautiously optimistic. Since July 2025, YoY visits to The Home Depot and Lowe’s have remained near, and in some cases exceeded, 2024 levels – which should bode well for the companies’ upcoming reportings. The nation’s housing stock is older than ever and underlying demand for new construction remains strong. Meanwhile, many homeowners have deferred larger discretionary renovations in recent years, creating a buildup of latent demand. Once economic conditions improve and financing becomes more accessible, that pipeline of major projects is poised to reopen, driving a new wave of growth for the home improvement sector.
Gen Z Holds The Key
Another source of future home improvement demand may come from Gen Z, a cohort that is quickly growing within the renter and homeowner populations. As this generation enters new life stages – moving into first apartments, buying starter homes, and taking on their own improvement projects – its influence on the category will expand.
Both Lowe’s and The Home Depot are already positioning for this shift. Each recently launched creator programs designed to highlight how their brands can empower the next generation of DIYers and design enthusiasts, while tapping into the reach and authenticity of influencers’ online communities.
As shown in the chart below, both the Home Depot and Lowe’s currently see smaller shares of visits from the Spatial.ai: PersonaLive segments “Adulting” and “College” within their captured markets, compared to national benchmarks. This suggests a significant opportunity for both retailers to capture untapped demand from younger consumers living independently. If the brands’ creator initiatives succeed in driving greater engagement with Gen Z, their shares of these segments could grow in the years ahead.
Lowe’s and The Home Depot Look Ahead
The home improvement sector remains in transition in 2025, as Lowe’s and The Home Depot adapt to shifting consumer priorities. Still, both retailers are finding bright spots – from solid performance in mid-range categories to fresh opportunities that could drive the next phase of growth.
For more data-driven retail insights, visit Placer.ai/anchor.
Placer.ai leverages a panel of tens of millions of devices and utilizes machine learning to make estimations for visits to locations across the US. The data is trusted by thousands of industry leaders who leverage Placer.ai for insights into foot traffic, demographic breakdowns, retail sale predictions, migration trends, site selection, and more.
.avif)
Digitally native brands have long been recognized for redefining retail through direct-to-consumer convenience and transparency. But as many of these once digital-only companies expand offline, physical stores prove to be key drivers of growth and engagement. Warby Parker stands out as an example of a brand translating digital roots into success in the brick-and-mortar space.
Expanding Footprints and Established Stores Are Engines for Growth
Warby Parker is entering the final quarter of 2025 on the tails of meaningful gains in foot traffic during the last twelve months (9.0% year-over-year (YoY)). With over 300 locations and being well on its way to 45 new stores this year, the chain’s continued expansion likely had an impact on YoY visits. But Warby Parker’s established footprint is also driving growth. Company management cited on-target revenue from both new stores and ones open for 12-months or more.
Building on Digital Roots, Thriving in Physical Spaces
Unlike traditional retailers, digitally native brands built their businesses on a foundation of ecommerce fluency, so a well-oiled online shopping experience and the roll-out of fresh AI-tools is to be expected. However, where Warby Parker continues to excel is in its physical store experience, enhanced by digital infrastructure that drives efficiency and reflects its roots as a digitally native brand.
The graph below shows that through three quarters of 2025, Warby Parker maintained average visit length of 30.8 minutes, exceeding the beauty (26.8 minutes) and traditional apparel (28.7 minutes) categories. This means that, on average, Warby Parker shoppers spend more time choosing a frame than they do sampling makeup or trying on an outfit. Longer visits indicate that Warby Parker stores, with their in-house eye exams and inviting, library-like atmosphere, have become destinations for both vision care and thoughtful frame selection. If Warby Parker continues to capture more of the vision care journey – a key long-term goal – further increases in average visit length could be expected.
Yet Warby Parker also drove a larger share of visits under 10 minutes than the analyzed categories, underscoring its well-executed omnichannel capabilities that serve consumers looking for speed and convenience. The chain integrates online staples – such as virtual try-ons – in-store, and its “Point of Everything (POE)” sales tool quickly identifies which frames customers have “favorited” online to help streamline offline purchases. And while some of Warby Parker’s short visits may come from frame adjustments – typically a quick fix – POE helps to make that process more efficient as well.
This all points to why Warby Parker’s retail revenue growth outpaces its ecommerce growth – accounting for 73% of the business – and may also explain management’s decision to sunset its Home Try-On program. Noting that the majority of the program’s current users live within 30 minutes of a Warby Parker store, the brand likely hopes that users can be easily converted into offline customers.
Where Digital Meets Physical
Digitally native brands are reshaping the physical store into an extension of their digital DNA and creating spaces that deliver both engagement and convenience. Knowledgeable associates and in-store amenities elevate offline shopping, while digital infrastructure supports everyday efficiency.
Want more data-driven retail insights? Visit Placer.ai/anchor.
Placer.ai leverages a panel of tens of millions of devices and utilizes machine learning to make estimations for visits to locations across the US. The data is trusted by thousands of industry leaders who leverage Placer.ai for insights into foot traffic, demographic breakdowns, retail sale predictions, migration trends, site selection, and more.
%26texasroadhouse(earnings).avif)
As consumers continue to navigate economic pressures and many full-service dining chains face softer demand, two major players – Chili’s, under Brinker International, and Texas Roadhouse, part of Texas Roadhouse Inc. – are standing out for their ability to drive sustained traffic growth. Using location analytics, we analyze the two companies' recent visit performance to explore factors behind their success.
Foot Traffic Growth Continues
Chili’s has emerged as a standout in full-service dining, delivering strong year-over-year (YoY) growth in both overall and same-store visits in Q2 – results consistent with Brinker’s own reporting. Texas Roadhouse also reported higher traffic and comp sales in Q2 2025, and the graph below shows continued YoY gains in both overall and same-store visits in Q3.
And while both Chili’s and Texas Roadhouse are driving strong traffic, each is pursuing growth through distinct strategies. Chili’s is focused on simplifying its menu and modernizing kitchen and dining-room technology – moves designed to improve the quality of the guest experience and boost efficiency. Texas Roadhouse, by contrast, continues to prioritize unit expansion while also rolling out a digital kitchen format to enhance operational efficiency and better support off-premise sales.
Lower-Income Diners Remain Chili’s and Texas Roadhouse’s Bread and Butter
In order to offset rising costs, both Chili’s and Texas Roadhouse management have announced modest menu price increases in the near future, but the key question is how their respective customer bases will respond.
Both Chili’s and Texas Roadhouse employ a barbell pricing strategy – keeping certain menu items at accessible price points while also offering more premium options. This approach enables the brands to emphasize value during periods of economic pressure while still catering to diners splurging on celebratory experiences. Each brand, however, takes a different approach; while Chili’s embraces viral deals, Texas Roadhouse emphasizes everyday value and doesn’t run promotions.
The graph below shows that the median household income in both Chili’s and Texas Roadhouse captured trade areas is consistently below the nationwide benchmark of $79.6K per year – underscoring the importance for these brands to maintain a strong value proposition that resonates with price-sensitive diners.
Between Q3 2022 and Q3 2023, the median HHI of Chili’s and Texas Roadhouse’s visitors increased by about $1K – suggesting more resilience and the means to trade-up to higher-priced menu items among the brands’ audiences.
But between Q3 2024 and Q3 2025, the rise in diners’ median HHI appears to have plateaued: Chili’s median HHI dipped slightly while Texas Roadhouse’s rose by just a couple hundred dollars. This trend indicates that both brands are currently resonating most with middle- and lower-income consumers – understandable, as Chili’s, for one, continues to emphasize its 3 For Me value play and reinforce value perception. It remains to be seen whether these brands’ strong value positioning will continue to hold appeal among lower-income diners if menu prices rise and the perceived value equation shifts – or whether they will increasingly rely on higher-income guests.
Are Higher-Income Diners the Answer to Sustaining Traffic?
Still, a closer look at captured market household incomes by bracket shows that both chains attract significant shares of high-income diners. While the median household incomes in Chili’s and Texas Roadhouse’s captured markets remain below the nationwide benchmark, in Q3 2025 both brands were on par with the nationwide average – or even slightly over-indexed – for households earning between $100K and $150K per year.
This suggests that higher-income households already represent a meaningful share of visits to both chains – a group with the spending power to help sustain traffic and trade up to premium menu items. Targeting households with incomes up to $150K per year could further strengthen Chili’s and Texas Roadhouse’s resilience amid a potential softening in consumer spending.
Two Paths to Continued Success
Chili’s and Texas Roadhouse are both navigating a shifting dining landscape by balancing value and experience through distinct strategies. Chili’s continues to refine operations and emphasize promotions, while Texas Roadhouse leans on expansion and consistent everyday value. As economic pressures evolve, both brands’ ability to maintain strong value perceptions while engaging higher-income diners will be key to sustaining momentum and traffic resilience.
For more data-driven retail insights, visit Placer.ai/anchor.
Placer.ai leverages a panel of tens of millions of devices and utilizes machine learning to make estimations for visits to locations across the US. The data is trusted by thousands of industry leaders who leverage Placer.ai for insights into foot traffic, demographic breakdowns, retail sale predictions, migration trends, site selection, and more.
Digging Into Dining
The dining industry showcased its agility over the past couple of years as it rapidly adapted to shifts in consumer preference brought on by COVID and rising prices. And with a new year around the corner, the pace of change shows no signs of slowing down.
This white paper harnesses location analytics, including visitation patterns, demographic data, and psychographic insights, to explore the trends that will shape the dining space in 2024. Which dining segments are likely to pull ahead of the pack? How are chains responding to changes in visitor behavior? And where are brands driving dining foot traffic by taking advantage of a new advertising possibility? Read on to find out how dining leaders can tap into emerging trends to stay ahead of the competition in 2024.
Stepping Up To The Plate
Comparing quarterly visits in 2023 and 2022 highlights the impact of the ongoing economic headwinds on the dining industry. The year started off strong, with year-over-year (YoY) dining visits up overall in Q1 2023 – perhaps aided by the comparison to an Omicron-impacted muted Q1 2022. And while overall dining growth stalled in Q2 2023, several segments – including QSR, Fast Casual, and Coffee – continued posting YoY visit increases, likely bolstered by consumers trading down from pricier full-service concepts.
Foot traffic slowed significantly in Q3 2023 as inflation and tighter consumer budgets constrained discretionary spending. Overall dining visits fell 2.4% YoY, and full-service restaurants – with their relatively high price point compared to other dining segments – seemed to be particularly impacted by the wider economic outlook. But the data also revealed some bright spots: Fast Casual still succeeded in maintaining positive YoY visit numbers and Coffee saw its Q3 visit grow an impressive 5.4% YoY. As the return to office continues, a pre-work coffee run or lunchtime foray to a fast-casual chain may continue propelling the two segments forward.
Shifting Demographics and Shifting Dining Behavior
Restaurant visitation patterns have evolved over the past few years. Although an 8 PM seating was once the most coveted slot at fine-dining restaurants, recent visitation data suggests that sitting down to dinner earlier is rising in popularity.
But among the QSR segment, the opposite trend is emerging, with late-night visits rising. Analyzing hourly foot traffic to several major QSR chains reveals that the share of visits between 9 PM and 12 AM increased significantly between Q3 2019 and Q3 2023. Even Taco Bell – already known for its popularity among the late-night crowd – saw a substantial increase in late-night visits YoY – from 15.4% to 20.3%.
Younger Customers Staying Out Later
Who is driving the late night visit surge? One reason restaurants have been expanding their opening hours is to capture more Gen-Z diners, who tend to seek out nighttime dining options. But location intelligence reveals that younger millennials are also taking advantage of the later QSR closing times.
An analysis of the captured market for trade areas of top locations within one of Taco Bell’s major markets – the Chicago-Naperville-Elgin, IL-IN-WI Metropolitan area – reveals a year-over-four-year (Yo4Y) increase in “Singles & Starters.” The “Singles & Starters” segment is defined by Experian: Mosaic as young singles and starter families living in cities who are typically between 25 and 30 years old. As consumers continue to prioritize experiential entertainment and going out with friends, late-night dining may continue to see increased interest from young city-dwellers.
Smoothies Drive Weekend Visits
Millennials and Gen-Z consumers aren’t only heading to their favorite fast food joint for a late-night bite – these audience segments are also helping drive visits on the weekends. Smoothie King is one chain feeling the benefits of young, health-conscious consumers.
The chain, which opened in New Orleans, LA, in 1973 as a health food store, has since grown to over 1,100 locations nationwide and is currently expanding, focusing on the Dallas-Fort Worth CBSA. The area’s Smoothie King venues have seen strong visitation patterns, particularly on the weekends – weekend visits were up 3.4% YoY in Q3 2023. The smoothie brand’s trade areas in the greater Dallas region is also seeing a YoY increase in weekend visits from “Young Professionals” – defined by the Spatial.ai PersonaLive dataset as “well-educated young professionals starting their careers in white-collar or technical jobs.”
Sports and Dining - Match Made in Heaven
While some dining chains are appealing to the late-night or weekend crowd, others are driving visits by appealing to sports lovers. How have recent rule changes around student athletes changed the restaurant game, and how can college football teams drive business in their hometowns?
Scoring Big: Leveraging Fan Insights to Fuel Successful Partnerships
College sports have long been a major moneymaker, with top-tier teams raking in billions of dollars annually. And as of 2021, college athletes can enjoy a piece of the significant fan following of college sports thanks to the change in the NCAA’s Name, Image, and Likeness (NIL) rules, which now allows student athletes to sign endorsement deals.
Since then, multiple restaurants have jumped on the opportunity to partner with student athletes, some of whom have millions of followers on Instagram and TikTok. Chains like Chipotle, Sweetgreen, Slim Chickens, and Hooters have all signed college athletes to various brand deals.
How can brands ensure they partner with athletes their customers will want to engage with? Analyzing a chain’s audience by looking at the interests of residents in a given chain’s trade area can reveal which type of athlete will be the most attractive to each brand’s customer base. For example, data from Spatial.ai: Followgraph provides insight into the social media activity of consumers in a given trade area and can highlight desirable partnerships.
Examining the trade areas of Chipotle, Sweetgreen, Slim Chickens, and Hooters, for instance, reveals that Sweetgreen’s visitors tended to have the largest share of Women’s Soccer followers. Conversely, Sweetgreen’s trade area had lower-than-average shares of College Football Fans or College Basketball Fans, while residents of the trade areas of the other three chains showed greater-than-average interest in these sports. Leveraging location intelligence can help companies choose brand deals that their customers resonate with and find the ideal athletes to represent the chain.
College Gameday - Wins for Dining
Finding the right college athlete partnership is one way for dining brands to appeal to college sports enthusiasts. But dining chains and venues located near major college stadiums also benefit from the popularity of their local team by enjoying a major game day visit boost.
One of the country’s most popular college football teams, the Ohio State Buckeyes, can draw millions of TV viewers, and its stadium has a capacity of 102,780 – one of the largest stadiums in the country. And while tailgating is a popular activity for Buckeyes fans, nearby restaurants are some of the biggest beneficiaries of the college football craze. Panera experienced a 235.3% increase on game days as compared to a typical day, Domino’s Pizza visits grew by 283.3%, and Tommy’s Pizza, a local pie shop, saw its visits jump by a whopping 600.9%.
Game Day Visitor Spikes
This influx in diners also causes a major shift in game day visitor demographics, as revealed by changes in visitors at dining venues located near stadiums of two of the nation’s best college football teams – the Ohio State Buckeyes and Ole Miss Rebels. Based on Spatial.ai: Personalive data for the captured market of these dining venues, game day visitors tended to come from “Ultra Wealthy Families” when compared to visitors during a typical non-game day in September or October.
The analysis indicates that popular sporting events create a unique opportunity for restaurants near college stadiums to attract high-income customers game day after game day, year after year.
Subwars: Room for Everyone
While some spend game day tailgating or visiting a college restaurant, others hold a viewing party – with a six-foot submarine. And the sub’s popularity extends beyond Superbowl Sundays. Sandwich chains including Jersey Mike’s, Firehouse Subs, Jimmy John’s, and Subway (recently purchased by the same company that owns Jimmy John’s) have seen sustained YoY increases in visits and visits per venue in the first three quarters of 2023.
Some of the growth to these chains may be related to their affordability, a draw at all times but especially during a period marked by consumer uncertainty and rising food costs. And subway leaders seem to be seizing the moment and striking while the iron is hot – Jersey Mike’s opened 350 stores in 2023 and still saw its YoY visits per venue grow by 6.6%. And Subway reported ten consecutive quarters of positive sales, a promising sign for its new owner.
Sandwich Chains Attract a Wide Consumer Base
The love for a healthy, affordable sandwich extends across all income levels, with all four chains seeing a range in their visitors' median household income (HHI). Out of the four chains analyzed, Jersey Mike’s – which has long prioritized a suburban, middle-income customer – had the highest trade area median household income of the four chains at $77.3K/year. Subway, known for its affordability, had the lowest, with $62.9K/year. The variance in median HHI combined with the strong foot traffic growth shows that when it comes to sandwiches, there’s something for everyone.
So What’s The Dining Space Cooking Up?
Persistent inflation and declining consumer sentiment may pose serious challenges for the dining space, but emerging trends are helping boost some restaurants. Customers seeking out a late-night bite drive visits to QSR chains, and health-conscious diners are boosting foot traffic to smoothie bars and sandwich shops. Meanwhile, sports sponsorships and game-day restaurant visits can provide a boost to dining businesses that take advantage of these opportunities.

