


.svg)


The multi-billion dollar beauty industry has proved to be one of the most resilient retail categories over the past few years – and Ulta Beauty has been one of the biggest beneficiaries of this trend, reporting record growth and experiencing strong foot traffic to its stores.
We dove into the location intelligence data for Ulta to analyze recent foot traffic performance, explore seasonal trends, and better understand the chain’s visitor base.
A Blush With Success Year-Over-Year
The past few years have seen Ulta’s monthly foot traffic growing on a near-constant basis – and 2023 was no exception. Year-over-year (YoY) visits to the chain were up by double digits most months and Ulta consistently outperformed the wider Beauty & Spa segment. The company’s success appears poised to continue in 2024, with January 2024 visits up 4.9% relative to the already impressive January 2023, even as foot traffic to the wider Beauty & Spa category dipped.
The consistent foot traffic growth Ulta experienced in 2023 and early 2024 is particularly impressive given that 2022 was also a banner year for the brand – meaning that foot traffic has exceeded the previous years’ growth for two years straight. And the company seems to be capitalizing on its success by further enhancing its shopping experience, expanding its presence with new stores, and emphasizing wellness offerings at existing locations to keep its customers coming back.
.png)
Holiday Highlights
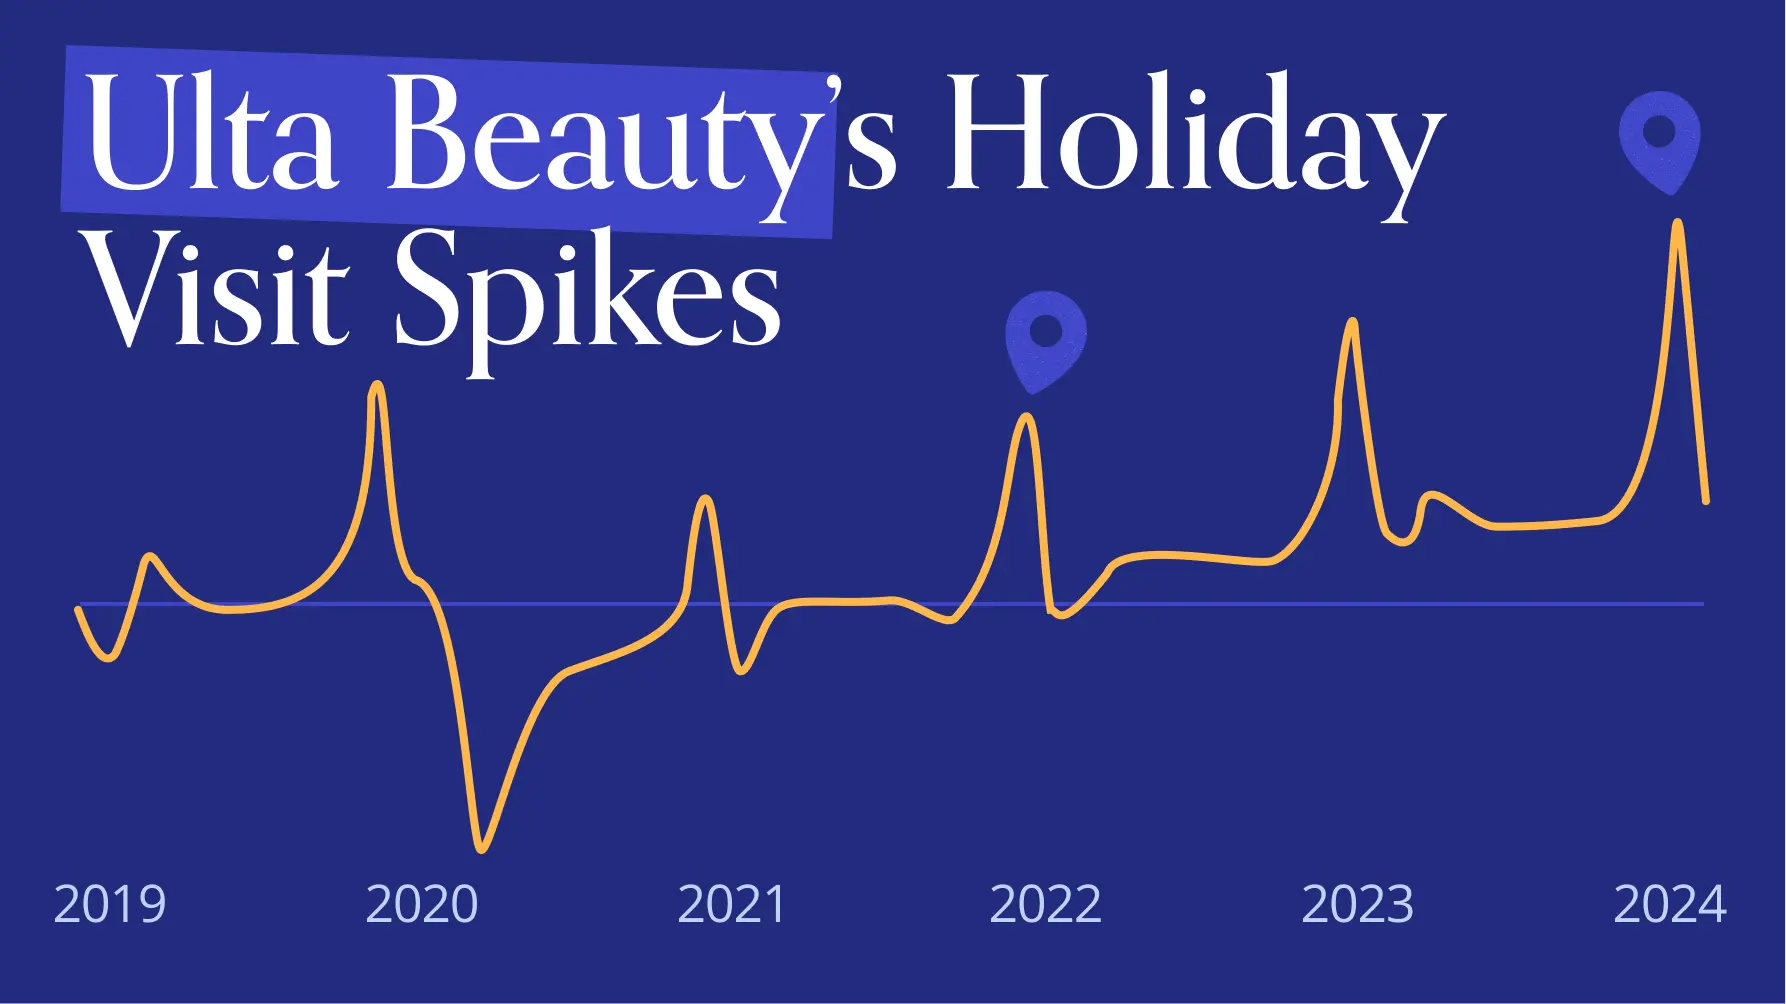
Charting the change in monthly foot traffic to Ulta helps visualize the chain’s seasonal visit patterns and highlight the company’s consistent upward climb since the 2021 retail reopening. The COVID-19 pandemic and ensuing lockdowns led to a steep drop in foot traffic, but visits picked up – and stayed up – as soon as social-distancing restrictions eased. And though inflation replaced the pandemic as an economic concern, Ulta visits continued on their upward climb, highlighting the broad appeal the chain offers to shoppers of all economic levels.
Ulta also enjoys significantly elevated visits during the holiday season, with foot traffic surging every December. And visits to the chain, even without a holiday spike, continue to exhibit growth – January 2024’s visits were 43.3% higher than they were in January 2019.
.avif)
Valentine’s Variances
While December may be the month that Ulta sees the most visits, there are plenty of other minor holidays and retail opportunities that contribute to foot traffic spikes to the retailer. And although Valentine’s Day isn’t a holiday in the official sense of the word, Ulta still enjoyed a mid-week boost in visits on Wednesday, February 14th 2024.
Visits to Ulta grew 17.2% on Valentine’s Day compared to traffic of the previous six Wednesdays. February 14th 2024 also saw 10.5% more visitors to Ulta than the day did in 2023, signaling a continued, growing interest in the beauty retailer.
.png)
The Gen A Connection
Ulta has taken pains to carry products for consumers of all ages, genders, and backgrounds –and recently, one age group in particular has been making headlines for its interest in beauty and skincare. Teens and tweens have been flocking to their local malls to try out products from brands like Drunk Elephant, driven, in part, by the rise of #BeautyTok, where influencers on TikTok post their makeup and skincare routines.
And indeed, trade area data indicates that families of all types are overrepresented among Ulta’s visitor base: Analyzing the psychographic makeup of Ulta’s trade areas using the Spatial.ai: PersonaLive dataset revealed that the chain’s captured market* includes more family segments when compared to the chain’s potential market*. Specifically, the chain’s captured markets had higher rates of “Near-Urban Diverse Families”, “Upper Suburban Diverse Families”, and “Wealthy Suburban Families” relative to the chain’s potential market. On the flip side, “Young Urban Singles” saw a smaller share of visitors in Ulta’s captured market than in its potential market.
Ulta’s popularity with family segments may be due to the increased demand for skincare and makeup among the families’ younger generations. And by continuing to cater to these younger consumers – alongside the numerous other segment that shop at Ulta – the company can hope to foster long-term brand loyalty and continue driving sales and foot traffic to its stores.
.png)
*A chain’s potential market refers to the population residing in a given trade area, where the Census Block Groups (CBGs) making up the trade area are weighted to reflect the number of households in each CBG.. A chain’s captured market weighs each CBG according to the actual number of visits originating to the chain from that CBG.
Strong Foundations
Ulta continues to impress, growing its sales and foot traffic even during a uniquely challenging period for the average consumer. By creating a shopping experience that is accessible to people across all ages and income levels, the company ensures that its visits can continue to grow.
For more data-driven retail insights, follow placer.ai.
This blog includes data from Placer.ai Data Version 2.0, which implements improvements to our extrapolation capabilities, adds short visit monitoring, and enhances visit detection.

The U.S. box office had a particularly strong 2023. Barbenheimer was the word out of everyone’s mouths over the summer, but other films like Spider-Man: Across the Spider-Verse, Guardians of the Galaxy Vol. 3, and The Super Mario Bros. helped boost both sales and visits.
How was the overall theater performance compared to 2022 and 2019? Who’s visiting these chains? And what can cinemas do to boost visits during lulls? We take a closer look at location intelligence for the three major theaters – AMC, Regal Cinemas, and Cinemark – to find out.
Lights, Camera, Action
Last year started on a high note, likely related to the strong box office performance of “Avatar: The Way of Water” (which may have also caused January 2024’s visit lag in comparison).
The “The Super Mario Bros. Movie” release in April helped spike visits further, with foot traffic to AMC, Regal Cinemas, and Cinemark increasing by 43.2%, 36.2%, and 40.8%, respectively. And July brought with it two of the most successful movie releases of all time – “Barbie” and “Oppenheimer” – which topped box office charts for weeks.
Both films were released in late July, with the massive August visit spikes showing the full power of the two movies. “The Taylor Swift: Eras Tour” movie release in October also boosted visits, though AMC and Cinemark appear to have been the primary beneficiaries of the Swifty-driven foot traffic increase.
.png)
The Show Must Go On
Year-over-four-year (Yo4Y) foot traffic trends offer a broader picture of how out-of-home entertainment is faring. The pandemic forced many movie theaters to shut their doors as social distancing guidelines made going to the movies impossible. In tandem, streaming services like Netflix and Amazon Prime became major movie studios in their own right.
The increase in at-home entertainment may have something to do with the overall Yo4Y decline in movie theater visits. Despite last year’s success, foot traffic data shows that fewer people are visiting theaters in 2023 than in 2019. Some of the dip is likely due to the chains’ rightsizing, with both AMC and Regal downsizing their fleet in recent years. But the success of this past summer’s blockbusters still brought visits to the two chains close to pre-pandemic numbers – and drove a positive Yo4Y visit surge to Cinemark – indicating that the right feature film can still draw crowds to cinemas nationwide.
.png)
Family Film Fans
A closer look at the psychographic characteristics of visitors to the three movie theater chains reveals that families are overrepresented in the chains’ trade areas, while young professionals are underrepresented: Consumer segments identified by the Spatial.ai: PersonaLive dataset as “Ultra Wealthy Families” and “Wealthy Suburban Families” were more prevalent in the theaters’ captured* markets than in their potential markets, while “Young Professionals” were less prevalent. With some analysts lamenting the death of superhero movies, movie studios looking for the next big idea may want to invest in more family-friendly films to cater to these theater-going family segments.
.avif)
*A chain’s captured market weighs each CBG according to the actual number of visits originating to the chain from that CBG. A chain’s potential market refers to the population residing in a given trade area, weighted to reflect the number of households in each Census Block Group (CBG) comprising the trade area. A chain’s captured market weighs each CBG according to the actual number of visits originating to the chain from that CBG.
The Power of Discounts
Unsurprisingly, movie theaters were busiest on the weekends – Saturday and Sunday received the lion's share of visits across all analyzed cinema chains, followed by Fridays. But the busiest non-Friday or weekend day was Tuesday – likely thanks to the theater chains’ "Discount Tuesday" special.
Cinemark experienced the largest Tuesday surge – with 12.6% of its weekly visits occurring on its discount day – perhaps due to the company’s decision to extend its discount to non-club members. AMC and Regal also received more visits on Tuesdays than they did during every other weekday (except for Friday).
As theaters continue to find creative ways to remain competitive in the evolving world of entertainment, “Discount Tuesdays” underscore the significance of a good deal when looking to drive visits to theaters.
.avif)
That’s A Wrap
Movie theater visits exceeded all expectations in 2023 as film enthusiasts flocked to watch any number of major box-office releases. Will this momentum continue into 2024?
Follow placer.ai for more data-driven entertainment insights.
This blog includes data from Placer.ai Data Version 2.0, which implements improvements to our extrapolation capabilities, adds short visit monitoring, and enhances visit detection.

We checked in with AutoZone and O’Reilly – two pandemic winners from the auto parts industry – to understand what location intelligence reveals about the retailers in 2024.
AutoZone & O’Reilly Auto Parts Maintaining Their Gains
AutoZone and O’Reilly Auto Parts are both major players in the multi-billion dollar automotive aftermarket industry with thousands of locations across the country. As car prices skyrocketed over the pandemic, visits to these retailers increased – and analyzing foot traffic patterns to these retailers reveals that although growth in the sector may be slowing down, leading auto parts chains are holding on to their pandemic gains.
On a year-over-year (YoY) basis, visits to AutoZone and O’Reilly Auto Parts continued growing in the first half of 2023 before stalling in Q3 2023 and dipping in Q4. But looking at year-over-four-year (Yo4Y) visits suggests that the drop may be due to the challenging comparison to an unusually strong period rather than to any drop in demand for auto parts. Last year’s visits to both AutoZone and O’Reilly Auto Parts were significantly higher than the chains’ 2019 baseline, with Q4 2023 visits exceeding Q4 2019 levels by 11.9% and 22.6% for AutoZone and O’Reilly Auto Parts, respectively.
.png)
A Promising Start to 2024
The pattern continued in January 2024, with visits to AutoZone and O’Reilly significantly higher than they were pre-pandemic, but slightly lower on a YoY basis. But the Q4 2023 YoY visit gaps narrowed for both chains, and used cars are still outselling new vehicle and fueling demand for car parts – so visits to the space are likely to remain strong in 2024.
.avif)
What’s Under The Hood?
Analyzing the demographic data of visitors to O’Reilly Auto Parts and AutoZone reveals that both companies succeeded in staying far ahead of their pre-pandemic visit baseline despite attracting a large number of visitors from lower-income households. In 2023, the median household income (HHI) within the two chains’ potential market* trade area was lower than the nationwide median of $69.5K/year, while the median HHI in the captured market trade area was even lower.
The income level of AutoZone and O’Reilly Auto Parts’ visitor base may help explain the chains’ Yo4Y strength and the YoY lags. With prices for used cars still significantly higher than they were in 2019, budget-conscious consumers are likely looking to patch up their existing rides instead of trading them in for newer vehicles – which could explain the sustained Yo4Y growth. At the same time, the ongoing inflation is likely straining this segment’s available funds, which may account for the YoY dips towards the end of 2023.
*A chain’s potential market refers to the population residing in a given trade area, weighted to reflect the number of households in each Census Block Group (CBG) comprising the trade area. A chain’s captured market weighs each CBG according to the actual number of visits originating to the chain from that CBG.
.png)
Country Roads vs. City Highways
When focusing on the trade area median HHI, the visitor base of AutoZone and O’Reilly Auto Parts looks nearly identical. But looking at the psychographic makeup of the two brands’ trade areas highlights differences between the companies. Using the Experian: Mosaic dataset to analyze the audience segments in the chains’ trade areas revealed that AutoZone tended to attract more city-based visitors, while O’Reilly seems to draw more small-town and rural households. Data from the Spatial.ai: PersonaLive’s dataset supports this pattern – and the success of both chains indicates that there is plenty of demand for car parts across a variety of audience types.
.avif)
Cruise Control: Car Part Customer Chronicles
As both companies continue to expand, location intelligence indicates that there is plenty of demand for car parts to go around.
For more data-driven retail analysis, visit placer.ai/blog.
This blog includes data from Placer.ai Data Version 2.0, which implements improvements to our extrapolation capabilities, adds short visit monitoring, and enhances visit detection.
Dutch Bros. has impressed with its foot traffic growth over the past few years. We took a closer look at the foot traffic data to understand where this chain’s growth is headed.
Brewing Up Visits
Dutch Bros., the country’s third-largest coffee chain, began as a simple coffee pushcart in Grants Pass, Oregon. Thirty-two years later, the company is one of the fastest-growing coffee chains in the country, having grown to over 900 locations in the country’s North and Southwest regions.
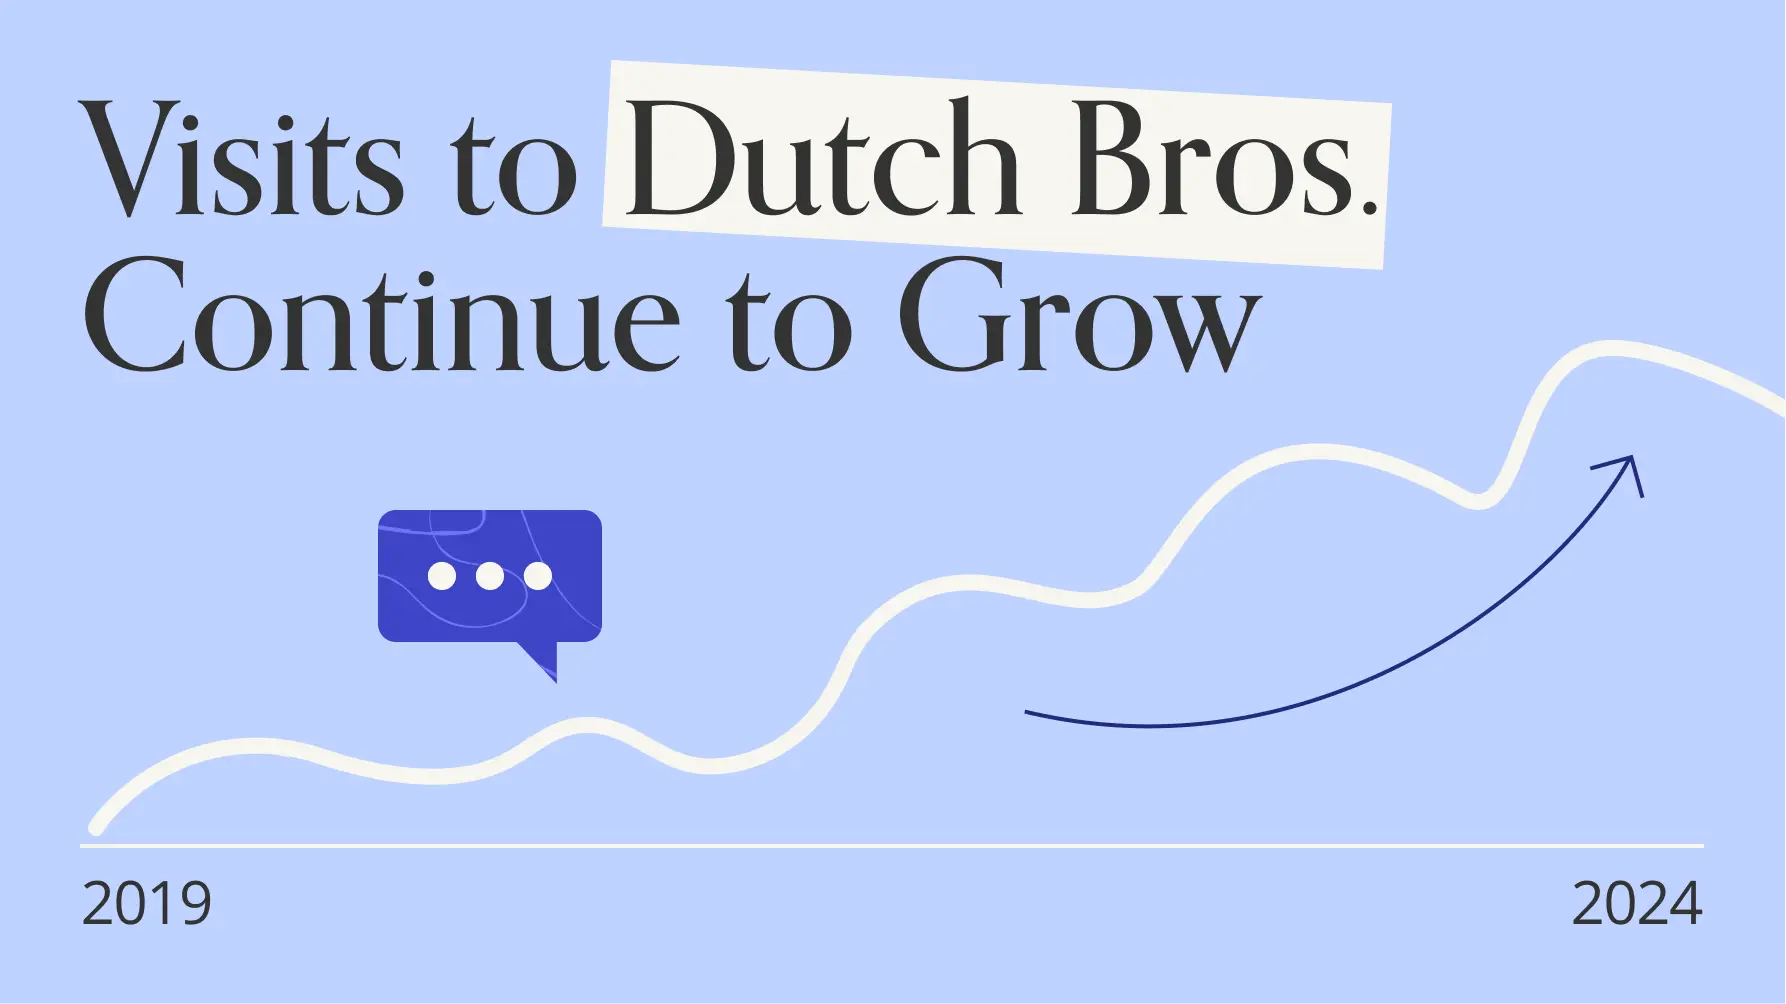
Analyzing the change in monthly visits to the chain since 2019 reveals near-constant growth over the past few years – a noteworthy feat considering the challenges facing the space over COVID and during the recent inflation. And while some of Dutch Bros. visit increase is likely due to its expanding store fleet, the consistency and magnitude of the growth suggests that the chain is keeping its new customers coming back.
Dutch Bros.’ success continued in 2023 and into the new year, with the company posting consistent year-over-year (YoY) visit gains for the past thirteen months. January 2024 visits to Dutch Bros. were 10.0% higher than in January 2023, while overall visits to the coffee space decreased by 2.7% YoY during the same period.
.avif)
Who Visits Dutch Bros.?
Dutch Bros.’ drive-thru design helped the chain thrive during the pandemic – and the layout is also helping the chain reach suburban audience segments.
A chain’s potential market refers to the population residing in a given trade area, weighted to reflect the number of households in each Census Block Group (CBG) comprising the trade area. A chain’s captured market weighs each CBG according to the actual number of visits originating to the chain from that CBG.
Analyzing the psychographic makeup of Dutch Bros' trade areas in four major markets – Texas, Arizona, Oregon, and California – revealed that the chain’s captured market attracts an outsize share of suburban audience segments. Specifically, Spatial.ai: PersonaLive’s “Blue Collar Suburbs” and “Upper Suburban Diverse Families” were both overrepresented in Dutch Bros.’ captured market relative to their presence in the chain’s potential market. This suggests that the chain is particularly popular among suburban coffee lovers, regardless of income levels or economic backgrounds. As Dutch Bros. continues its expansion, focusing on suburban, car-centric areas may serve it well.
.png)
Pour It Up
Dutch Bros. has been a remarkable success story over the past few years despite the widespread economic headwinds challenges the dining space at large has experienced. Will the chain continue to see its momentum continue into 2024 and beyond?
Stay up-to-date with the latest data-driven dining insights by visiting placer.ai.

How did off-price leaders T.J. Maxx, Marshalls (both owned by TJX Companies), Burlington, and Ross perform in last year? And how is 2024 shaping up for the category? We dove into the foot traffic data to find out.
Continuing To Grow
Off-price apparel retailers typically employ a straightforward method: sell excess or off-season merchandise that would otherwise remain unsold at a discount, benefiting both shoppers and manufacturers.
This retail model has consistently performed well, as evidenced by the consistent growth in visits to T.J. Maxx, Marshalls, Ross, and Burlington over the past few years. And despite the overall sluggishness experienced by much of the apparel retail category in 2023, visits to these stores continued to increase year-over-year (YoY) in every quarter analyzed.
.png)
January 2024 YoY visit growth slowed slightly – perhaps due to Q1 2023’s exceptionally strong performance. But despite the difficult comparison, foot traffic for most chains remained close to 2023 levels while YoY January visits to Ross increased 5.5%, highlighting the resilience of the off-price sector.
.avif)
HHI Varies By Brand
The demographic and psychographic makeup of a chain’s trade area – which shows the types of visitors who frequent the chain – can be determined by looking at the chain’s potential or captured market. A chain’s potential market is calculated by weighing the Census Block Groups (CBGs) feeding visits to the chain according to the size of the CBG, while the captured market weighs each CBG according to the relative number of visits to the chain originating from that CBG.
Using these tools to analyze the median household income (HHI) in the trade areas of the four chains reveals a divergence between the two TJX-owned chains T.J. Maxx and Marshalls, on one side, and Ross Dress for Less and Burlington, on the other. The median HHI in T.J. Maxx and Marshalls’ potential market is higher than the potential median HHI for Ross and Burlington – and the two TJX brands’ captured market median HHI is even higher. Meanwhile, the median HHI in Ross and Burlington’s captured market is lower than the median HHI in their own potential markets.
The variance in median HHI between the chains may have to do with differences in branding and product selection. Marshalls and T.J. Maxx tend to have the higher price points, with T.J. Maxx in particular expanding its designer offerings over the past few years through its Runway stores. Ross and Burlington, known for their no-frills approach to clothing shopping, have relatively lower price points – and may see more customers seeking bargains over high fashion.
.png)
Families Drawn To Off-Price Retailers
While an analysis of trade area median HHI highlights differences between the chains’ visitor bases, a deeper exploration of Marshalls, Ross, and Burlington’s trade areas suggests that the retailers also share common ground – specifically, their popularity with middle-income families. For almost all brands, the captured market share of households categorized by the Spatial.ai: PersonaLive dataset as “Family Union” and “Cultural Connections” was larger than the potential market share. T.J. Maxx, which had a slightly lower share of “Cultural Connection” households in its captured market relative to its potential market, was the sole exception.
All four chains continue to add stores to their fleets – Ross opened 97 stores in fiscal 2023, and Burlington is looking to expand in over 60 former Bed Bath and Beyond locations. Focusing on trade areas with diverse families, then, may serve Marshalls, Ross, and Burlington. And T.J. Maxx, which has been enjoying a resurgence of interest from younger shoppers, might consider expanding into areas that attract young professionals.
%20(1).avif)
Dressing To Impress
Off-price apparel retailers continue to succeed despite – or perhaps because of – a challenging economic climate. Will their success continue into 2024?
Visit placer.ai to keep up-to-date on the latest data-driven retail trends.

When we last checked in with the home improvement category, high interest rates and a cooling housing market had impacted visits to retailers The Home Depot, Lowe’s, and Tractor Supply. As 2024 gets underway, what might lie ahead for these chains? We take a look at the data to find out.
Hammering Out The Visits
Home Depot and Lowe’s, two of the largest home improvement retailers in the country, command a significant share of the industry. The two chains experienced ups and downs over the past few years, from a pandemic-era spike in visits to a more recent slowdown as rising prices and slowing home sales led many would-be shoppers to rethink a renovation.
The turbulence in the Home Improvement space continued in 2023. In the first half of the year, foot traffic to The Home Depot and Lowe’s showed modest increases on a year-over-year (YoY) basis – but that momentum slowed into the years’ second half as home sales dropped to a six-month low.
Visit performance to these retailers may well improve in 2024. Should home sales pick up as mortgage rates continue on their expected downward trajectory, home improvement chains would likely see an increase in visits as new homeowners grab equipment for renovations.
.avif)
Nailed It: Median HHI Variances
Analyzing median household income (HHI) of visitors to The Home Depot and Lowe’s, segmented by potential and captured markets, may provide insights into The Home Depot's stronger year-over-year foot traffic performance. (A chain's potential market looks at the Census Block Groups (CBGs) where visitors to a chain originate, weighted according to the CBG’s population. In contrast, captured market visit data reflects figures weighted by the actual number of visits from each CBG.)
The trade area median HHI tends to be higher for Home Depot than for Lowe’s in the chains’ potential markets – and the differences grow even more pronounced when analyzing the captured market. The Home Depot’s potential market median HHI stood at $71.5K/year – just slightly higher than Lowe’s $69.6K/year. But The Home Depot’s captured market median HHI was $74.3K/year in 2023 – around 4% higher than the chain’s potential market median HHI. Meanwhile, Lowe’s captured market median HHI of $69.0K/year was around 1% lower than its potential market median HHI.
The income disparity between the visitor bases of the two chains may provide context for The Home Depot’s foot traffic strength compared to Lowe’s – The Home Depot’s wealthier customers may be more insulated from the effects of inflation. And as inflation eases and demand for home renovations creeps up, Lowe’s may yet see visits tick up as its customers return to the chain.
.png)
Ranching Out: Visits To Tractor Supply
Tractor Supply Co. – another major home improvement chain – also offers a variety of products geared toward farm and ranch living, including animal feed and farm equipment. The company was a surprising pandemic winner, seeing its sales and foot traffic grow significantly as people moved to the countryside.
The chain's popularity has remained strong even as the pandemic-induced migration trends subside and the influx of city-dwellers to rural areas slows down. Visits to Tractor Supply remained consistently high throughout 2023, with only two months experiencing YoY foot traffic lags. Tractor Supply visits also outpaced visits to the home improvement category as a whole, indicating sustained demand for farm products.
.avif)
Rural Renovations Rule
A deeper exploration of the three home improvement chains’ psychographic compositions indicates that Tractor Supply’s popularity with rural segments (as defined by the Spatial.ai: PersonaLive dataset) may be fueling some of its sustained visit success.
All three chains saw a higher share of rural visitors in their captured market compared to their potential market – indicating that rural consumers are particularly interested in home improvement tools and products. And of the three chains, Tractor Supply served the largest share of rural visitors by far. The share of rural audience segments in Tractor Supply’s potential markets significantly exceeded the share of these segments in the trade areas of Lowe’s and The Home Depot’s, and the relative share of rural segments in Tractor Supply’s captured market was even more impressive.
Lowe’s, which has bolstered its rural presence over the past year, had the second-highest percentage of rural segments in both its potential and captured markets – although its share of rural visitors was still considerably lower than Tractor Supply’s.
Meanwhile, The Home Depot saw the smallest share of rural visitors across all rural segments analyzed. The company’s captured market had just slightly more Rural High Income and Rural Low Income visitors relative to its potential market, and there was no difference between its captured and potential market shares of Rural Average Income consumers.
The impressive over-representation of rural customers to Lowe’s and Tractor Supply suggest that the rural potential for home improvement chains is significant – and chains that tap into the segment may see further foot traffic to their stores.
.avif)
Renovations, Renewed
The home improvement space has seen plenty of variance over the past few years, from the pandemic-fueled DIY highs of 2020 and 2021 to the overall slowdown brought on by inflation in 2023. Will visits begin to pick up again into 2024?
Visit placer.ai/blog for the latest data-driven retail insights.

