


.svg)


Overall food-away-from-home spending grew in 2024, driven by decelerating inflation and a robust economy that eased budgetary concerns. How did coffee chains, one of the largest discretionary food categories, perform?
We took a closer look at foot traffic to Starbucks and Dunkin’ to find out.
Yearly Visits Perking Up?
Despite the ongoing consumer uncertainty, 2024 visits to Starbucks and Dunkin’ remained close to 2023 levels. The traffic trends range from 2.9% down year-over-year (YoY) to 1.9% up YoY for Starbucks, and from 1.3% down to 1.9% up YoY for Dunkin’ – a testament to coffee’s enduring draw.
Daily Grind
While the YoY visit patterns to Starbucks and Dunkin’ were relatively similar in 2024, the two chains experienced distinct visitation patterns throughout the day. During the early morning daypart (6:00 - 9:59 AM), Dunkin’ attracted 39.9% of its visitors, while Starbucks received only 29.9% of its customers before 10 AM. However, as the day transitioned into evening, Starbucks took the lead, capturing 23.7% of visitors during the 3:00 - 6:59 PM daypart, significantly higher than Dunkin’s 16.4%.
These visitation patterns highlight distinct opportunities for both chains to expand their appeal across different dayparts. Dunkin’ could offer afternoon specials to attract more visitors in the afternoon and evening daypart, and Starbucks could broaden its breakfast offerings to capture a larger share of the early morning crowd.
Starbucks’ LTO Success
A closer look at Starbucks’ daily visitation patterns highlights the chain’s mastery in leveraging calendar events and special promotions to boost foot traffic. Events like Red Cup Day and buy-one-get-one-free (BOGO) deals, including on Mother’s Day, drove impressive visits bumps ranging from 28.1% to 40.4% higher than the 2024 daily visit average.
These promotions appear to have been so successful that Starbucks, under the leadership of new C.E.O. Brian Niccol, announced it would scale them back – in part to restore the chain’s “coffeehouse roots” and avoid over-crowded stores on promotion days. But even without special discounts in the last five weeks of the year, Starbucks still received major traffic spikes on key shopping days like Super Saturday and Black Friday, with visits surging 27.5% and 26.6% above the YTD daily average, respectively. This highlights the brand’s ability to drive strong performance even with fewer promotions during peak seasons.
Short Stays On The Rise
As part of the effort to elevate the in-store experience, Starbucks has also announced plans to implement a code of conduct, with the goal of facilitating the creation of an “inviting and welcoming community coffeehouse.” One significant shift, coming into effect on January 27th, bars people from lingering in its facilities without making a purchase.
A closer look at dwell time for the chain reveals that the vast majority of visits to the chain are currently less than 10 minutes long, with mobile orders making up almost a third of total Starbucks orders. The predominance of short visits and the popularity of mobile orders indicates that many Starbucks customers likely prioritize convenience, and prefer to grab a drink to go without taking advantage of the coffeehouse amenities. But with new incentives – including a free refill policy for all customers, not just loyalty club members – dwell times may well go up over the coming months.
Thanks a Latte, 2024!
Starbucks and Dunkin’ continued serving coffee drinkers in 2024, despite the ongoing constraints on many consumers' discretionary spending budgets.
Will Starbucks and Dunkin’ continue to drive visits into 2025? Visit Placer.ai for the latest data-driven dining insights.

About the Convention Center Index: The Placer.ai Convention Center Index analyzes foot traffic to nearly 150 major convention and conference centers across the country. It excludes resorts and stadiums.
Convention centers serve as hubs for networking, trade shows, and corporate events. But the pandemic brought in-person gatherings to a halt, with businesses pivoting to online conferences – or eschewing them altogether.
And though social-distancing and other pandemic-era restrictions have lifted, the changes in the office and business world continue to linger. With that in mind, we took a closer look at the visitation data to these centers to see how convention center traffic trends and visitor demographics have shifted since pre-pandemic.
Year-over-Year, Two-Year, and Five-Year Trends
COVID-19 profoundly disrupted in-person networking. Now, nearly five years later, its impact on business travel and corporate events still lingers as virtual and hybrid events remain popular. However, similar to the return-to-office trends Placer.ai has tracked over the past few years, convention centers are also showing signs of slow but steady recovery.
While 2024 visits to convention centers nationwide were still 11.2% lower, on average, than in pre-pandemic 2019, traffic was also 3.3% higher than in 2023 and a significant 21.3% higher than in 2022. So – while the frequency and magnitude of in-person business events are not quite back to pre-pandemic levels yet, the visit trends indicate that the convention center recovery story is still being written.
Weekend Visit Boosts
The pandemic’s impact extends beyond overall attendance numbers – diving deeper into the data also reveals shifts in when people visit convention centers. The share of weekend visits jumped from 44.5% in 2019 to 46.9% in 2022 and has remained relatively steady ever since. This suggests that convention centers may have pivoted to hosting concerts, sporting matches, and other leisure events to make up for the dip in business conferences and conventions.
Convention Centers Increasingly Seeing Wealthier Visitors
Analyzing the trade areas from where convention centers draw their visits also reveals that the demographics of convention center visitors has shifted since the pandemic. The median household income (HHI) of visitors to convention centers has steadily increased each year analyzed, rising from $86.6K in 2019 to $88.4K in 2024. Similarly, visitors in 2024 were more likely to come from captured market trade areas with higher shares of the “Power Elite” segment than in 2019.
These two metrics indicate a shift in the profile of convention visitors. As virtual attendance becomes more normalized, many companies may be becoming more intentional about subsidising business travel and trade show attendance, reserving in-person events for higher-level executives, decision-makers, or industry leaders. This shift has significant implications for the industry, as convention centers may need to adapt their offerings and facilities to cater to the needs and preferences of this more specialized demographic.
Get Your Name Badges Ready
The convention center space appears to be on a slow and steady recovery – and while visits may not return to their pre-pandemic highs, the share of weekend visit growth and increasing attendance of higher-profile professionals indicate that the segment is pivoting.
Will convention centers and office spaces continue to recover? Visit Placer.ai for the latest office and business foot traffic trends.

The beverage and alcohol (BevAlc) segment has enjoyed a strong showing over the past few years. Bar and other nightlife destinations were closed throughout the pandemic, driving foot traffic to the BevAlc retailers – a trend that has sustained itself since.
We take a closer look at the category to see how special calendar milestones drive visits to BevAlc retailers.
Sip Happens
Visits to BevAlc retailers were up YoY during most months of 2024, showcasing the continued popularity of the category. And while December 2024 visits were slightly lower YoY – like due to the month having one fewer Saturday compared to December 2023 – diving deeper into the data reveals that the holidays remain the segment’s busiest time of the year.
Raise a Glass to December
Celebrations and holiday gatherings often call for a festive drink – and the data confirms that the holiday season drives massive visit spikes.
Of the eleven busiest days for BevAlc retailers in 2024, six fell in December, with New Year’s Eve leading the pack with a staggering 164.8% visit increase compared to the 2024 daily average. Other major drivers included Christmas Eve, Turkey Wednesday, and Christmas Eve-Eve (December 23rd, the day before Christmas), with visits growing between 131.9% and 145.2% relative to the 2024 daily visit average.
And given that some states restrict liquor sales on Sundays, the Fridays and Saturdays ahead of retail milestones were also significant drivers of liquor store visits. Six of the top eleven days for BevAlc retailers in 2024 fell on a Friday or Saturday, including the Saturday before Memorial Day and the Saturday before Father’s Day.
These patterns emphasize that while December remains the highlight of the year for BevAlc retailers, other celebratory periods throughout the year can also drive substantial visitation spikes.
Brewing Something Up
A closer look at the data over the years highlights several important holiday season trends. New Year’s Eve consistently receives the largest daily spike in BevAlc retailers visits, with one notable exception. In 2023, Super Saturday – the last Saturday before Christmas – coincided with Christmas Eve Eve, driving a major retail and grocery boost across the board. Additionally, Christmas Eve, typically the second-largest day for BevAlc retailers visits in the year, fell on a Sunday in 2023, when liquor sales are restricted in some states and territories.
This combination of factors led to an unusually large spike in visits to liquor stores on December 23, 2023, or Super Saturday/Christmas Eve Eve – 198.5% higher than the 2023 daily visit average between January and October 2023. It was also the only year in our analysis where BevAlc retailers received more visits before Christmas than in the lead-up to New Year’s.
Another trend highlighted by the longer-term visit analysis is the consistent downward trajectory of visits. In 2019, visits to BevAlc retailers in the lead-up to New Year’s were 193.4% higher than the 2019 daily visit average – a figure that had declined to 164.8% by 2024. This decrease may reflect various factors, including the rising popularity of alcohol delivery services and growing interest in the sober-curious lifestyle.
Still, the holiday season remains the most critical period for the BevAlc segment – though BevAlc retailers may want to consider stocking up on low- or alcohol-free beverages to keep up with changing consumer trends.
Drink To That
Raising a glass to a special occasion is a time-honored tradition, whether it’s with a festive spiked eggnog, whiskey, or alcohol-free wine. With plenty of opportunities to gather throughout the holiday season, BevAlc retailers can raise a toast to their own foot traffic gains as well.
For more data-driven retail insights, visit Placer.ai.
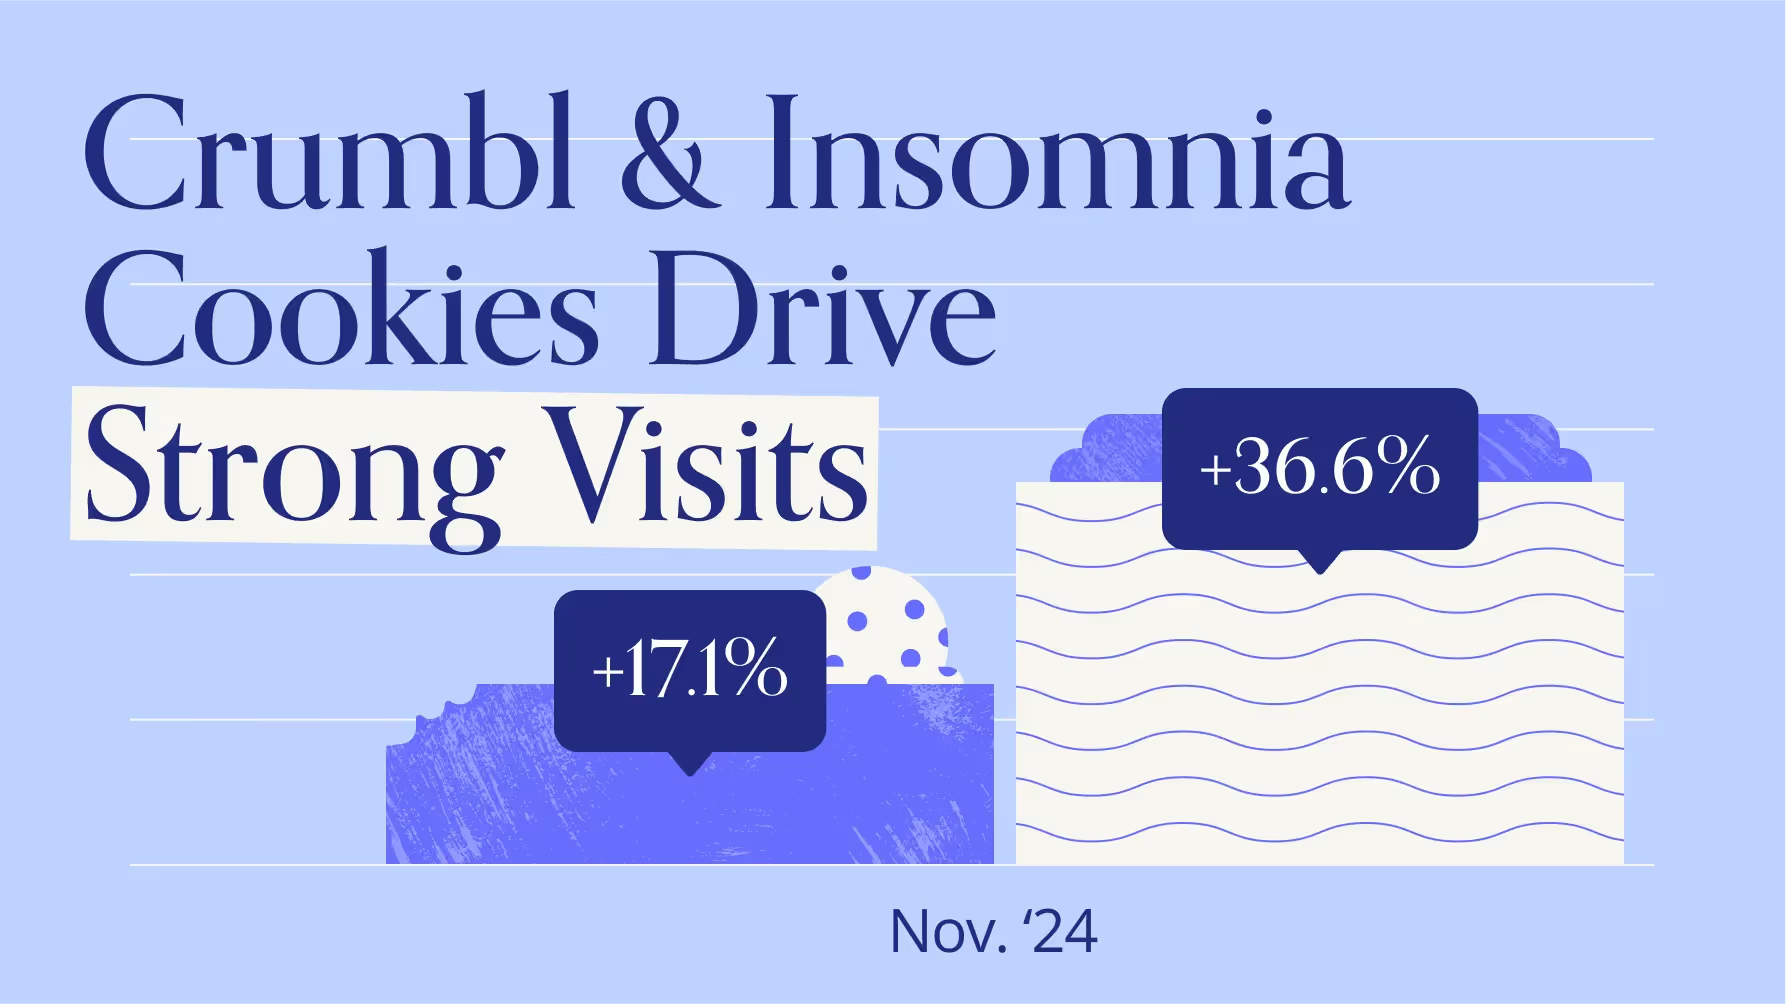
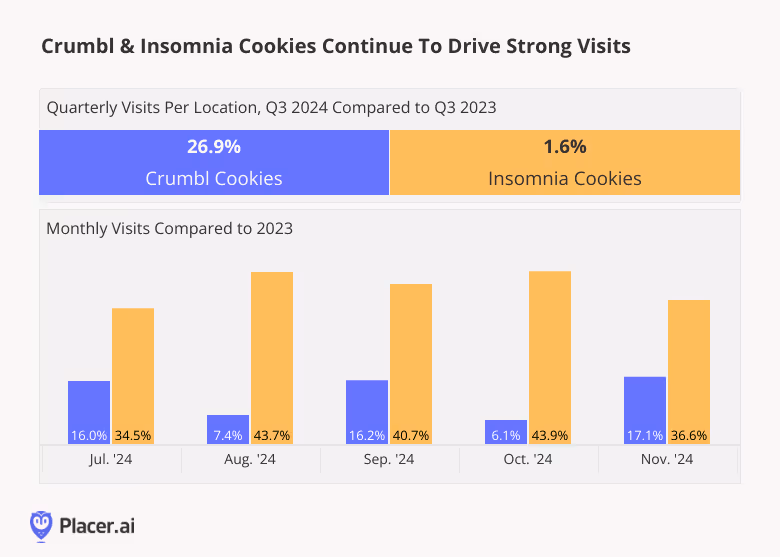
Not Crumbling Under Any Pressure
Insomnia Cookies, one of the first companies to innovate in the cookie retail space, is known for its late opening hours and classic cookie flavors. The company started in 2003 by selling fresh-baked cookies to college students and now operates over 300 locations globally. Meanwhile, Crumbl Cookies – known for its celebrity collaborations and intensely loyal social media fanbase – came onto the scene in 2017 and has since grown to over 1,000 franchised locations.
Both chains are expanding, and diving into the foot traffic data reveals that overall visits as well as average visits per location are still growing for both chains – indicating that the cookie craze is still going strong.
Craving Cookie Dough
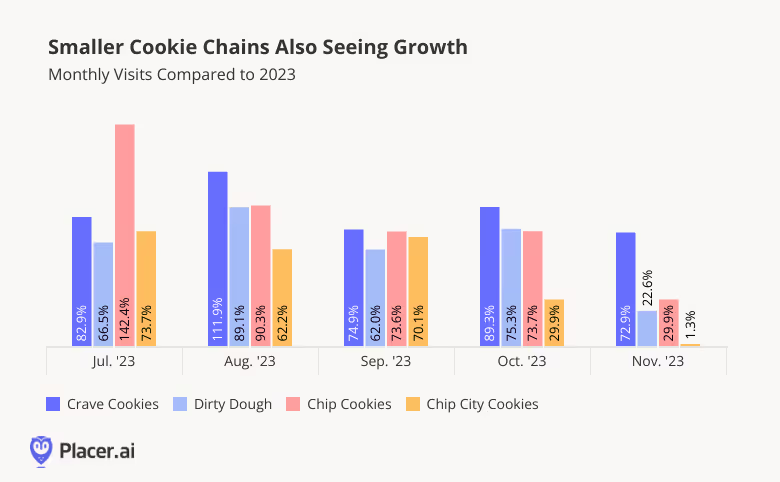
Analyzing visit growth at smaller cookie chains also highlights the strong demand for creative cookie concepts. Crave Cookies (established in 2022), Dirty Dough (2018), Chip Cookies (2016), and Chip City Cookies (2017) are all enjoying strong foot traffic growth relative to 2023, thanks in part to ongoing expansions. Like Crumbl and Insomnia, Crave Cookies, Dirty Dough, Chip Cookies, and Chip City Cookies are all growing their fleet – and the steady stream of store openings has driven consistent YoY visit growth.
The increasing visits to both the larger chains and the smaller cookie brands suggests that the demand for cookies has yet to peak and is likely to continue in 2025. And with these chains still looking to grow, how can location analytics uncover the best opportunities for growth?
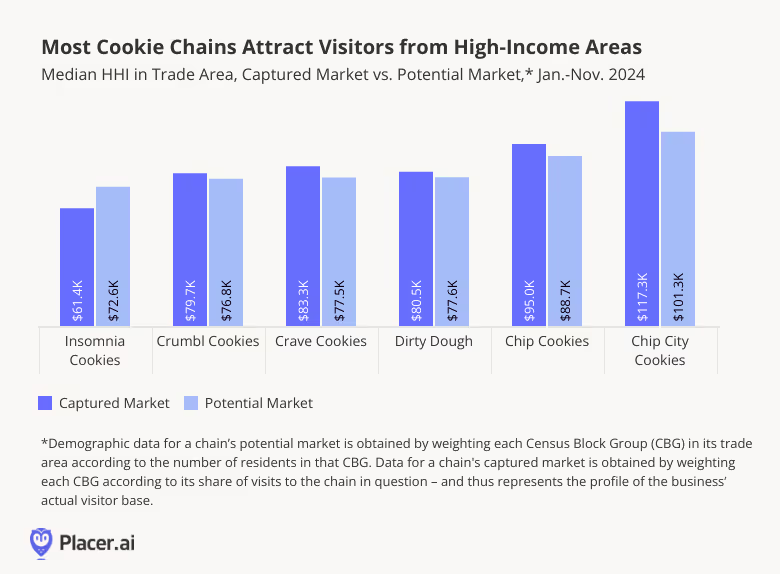
Cookies Resonate With Higher-Income Families
A closer look at the demographic makeup of visitors to the analyzed cookie chains suggests that some of these chains’ consistently strong performance may be due to the relative affluence of their consumer base: The STI: PopStats dataset reveals that all of the chains' captured markets – with the exception of Insomnia Cookies – have higher shares of wealthy consumer segments than their potential one. (A chain’s potential market is obtained by weighting each Census Block Group (CBG) in its trade area according to population size, thus reflecting the overall makeup of the chain’s trade area. A business’ captured market, on the other hand, is obtained by weighting each CBG according to its share of visits to the chain in question – and thus represents the profile of its actual visitor base).
Among the analyzed chains, Chip City Cookies attracted visitors from the highest-income areas, with a captured market median HHI of $117.3K – $16.0K higher than its potential market median HHI of $101.3K. Crumbl, Crave, Dirty Dough, Chip, and Chip City also drew visitors from higher-income areas relative to their potential market median HHI.
In contrast, Insomnia Cookies was the only chain with a lower median HHI in its captured market relative to its potential market, likely reflecting its positioning as a late-night snack option for college students.
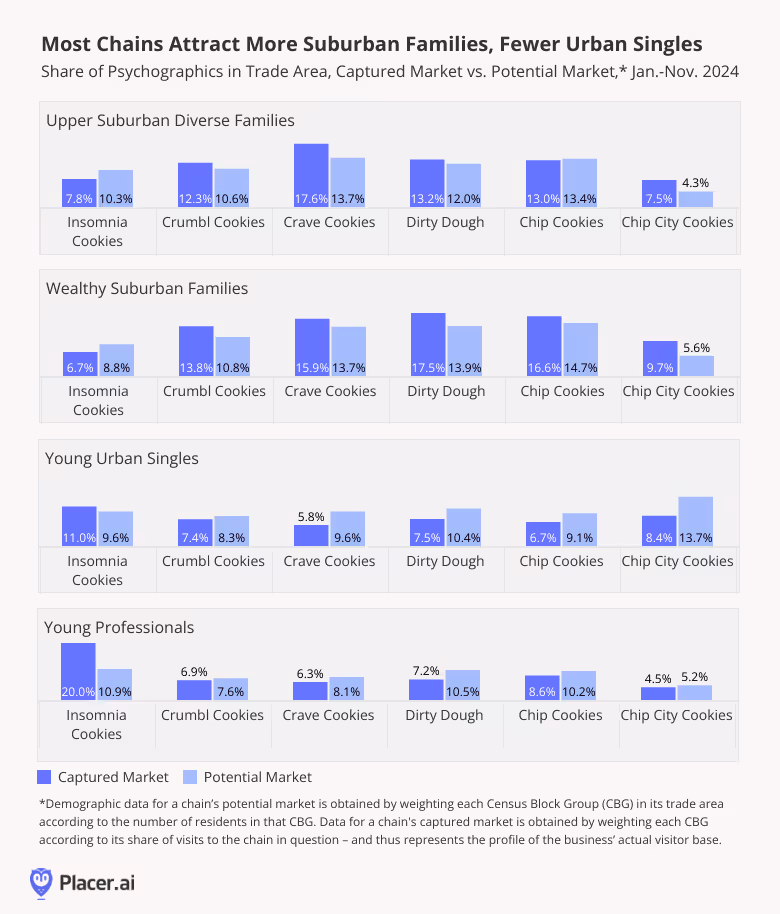
Suburban Families Favor Cookie Chains
The relatively high-income of cookie consumers may be partially due to the chains’ popularity with suburban segments: According to the Spatial.ai: PersonaLive dataset, almost all the analyzed chains saw a higher share of “Upper Suburban Diverse Families” and “Wealthy Suburban Families” in their captured markets compared to their potential market. Meanwhile, the shares of “Young Urban Singles” and “Young Professionals” were lower across nearly all the analyzed chains’ captured market relative to their potential markets.
And once again, Insomnia Cookies stood out – the company’s captured market included an outsized share of “Young Professionals” and “Young Urban Singles,” perhaps due to the company's positioning as a late-night college campus favorite.
Taken together, this data suggests that, unless a chain is focused on acquiring a specific audience segment – like Insomnia did when targeting younger, less affluent consumers such as college students – most cookie chains are most likely to thrive in affluent suburban markets.
To The Last Crumb
The enjoyment provided by a sweet treat is universal – but will these cookie chains retain their edge as the dessert shop market grows increasingly crowded?
Visit Placer.ai to keep up-to-date with the latest data-driven dining insights.

As prime destinations for everything from ready-made meals to affordable treats, today’s c-stores are a far cry from the pit stops of yesteryear. But how has the segment performed in recent months – and what lies ahead for it in 2025? We dove into the data to find out.
Segment Strength Through the Years
The c-store segment has undergone a transformation in recent years as many category leaders significantly elevated their food, beverage, and experiential offerings, leaning into growing demand for affordable, convenient groceries and takeaway. Today, convenience stores can often be exciting destinations in their own rights – and eager customers are paying attention.
Analyzing visitation trends to c-stores highlights just how successful this reinvention has been for the category. Monthly c-store visits have surged past the segment’s pre-pandemic baseline, with November 2024 c-store traffic 15.5% higher than in November 2018.
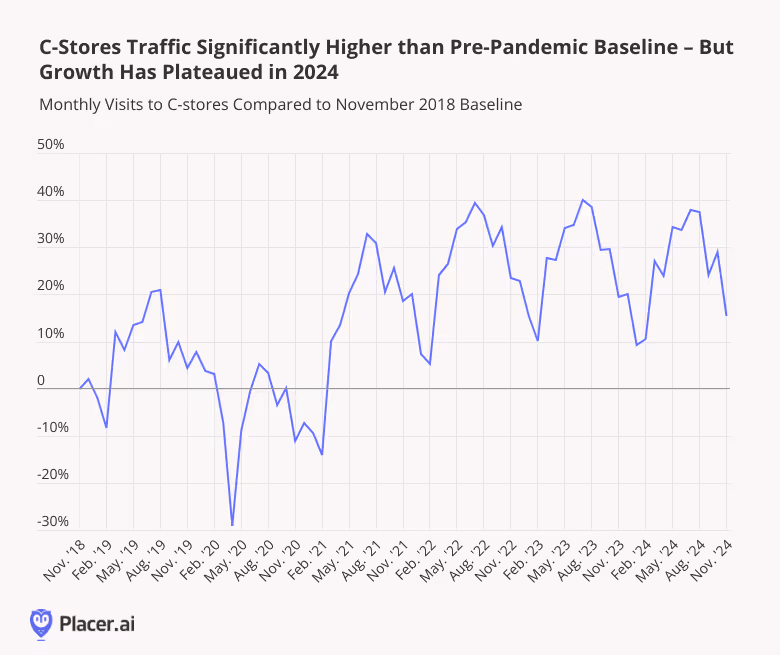
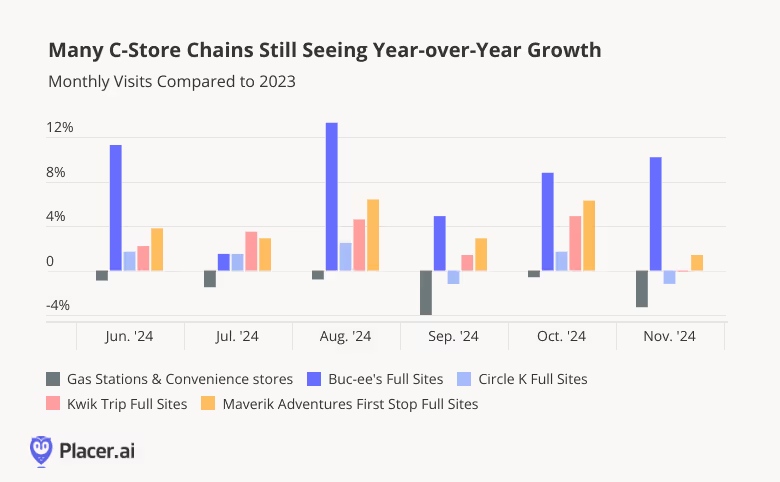
Still, the data also indicates that growth has plateaued – year-over-year (YoY) traffic for the c-store segment has remained relatively flat in 2024, with November 2024 visits down 3.3% YoY. But diving into the individual chains’ visitation patterns reveals that many chains, including Buc-ee’s, Circle K, Kwik Trip, Maverik, and are outperforming the wider segment and continuing to see impressive YoY growth – in large part thanks to aggressive expansions.
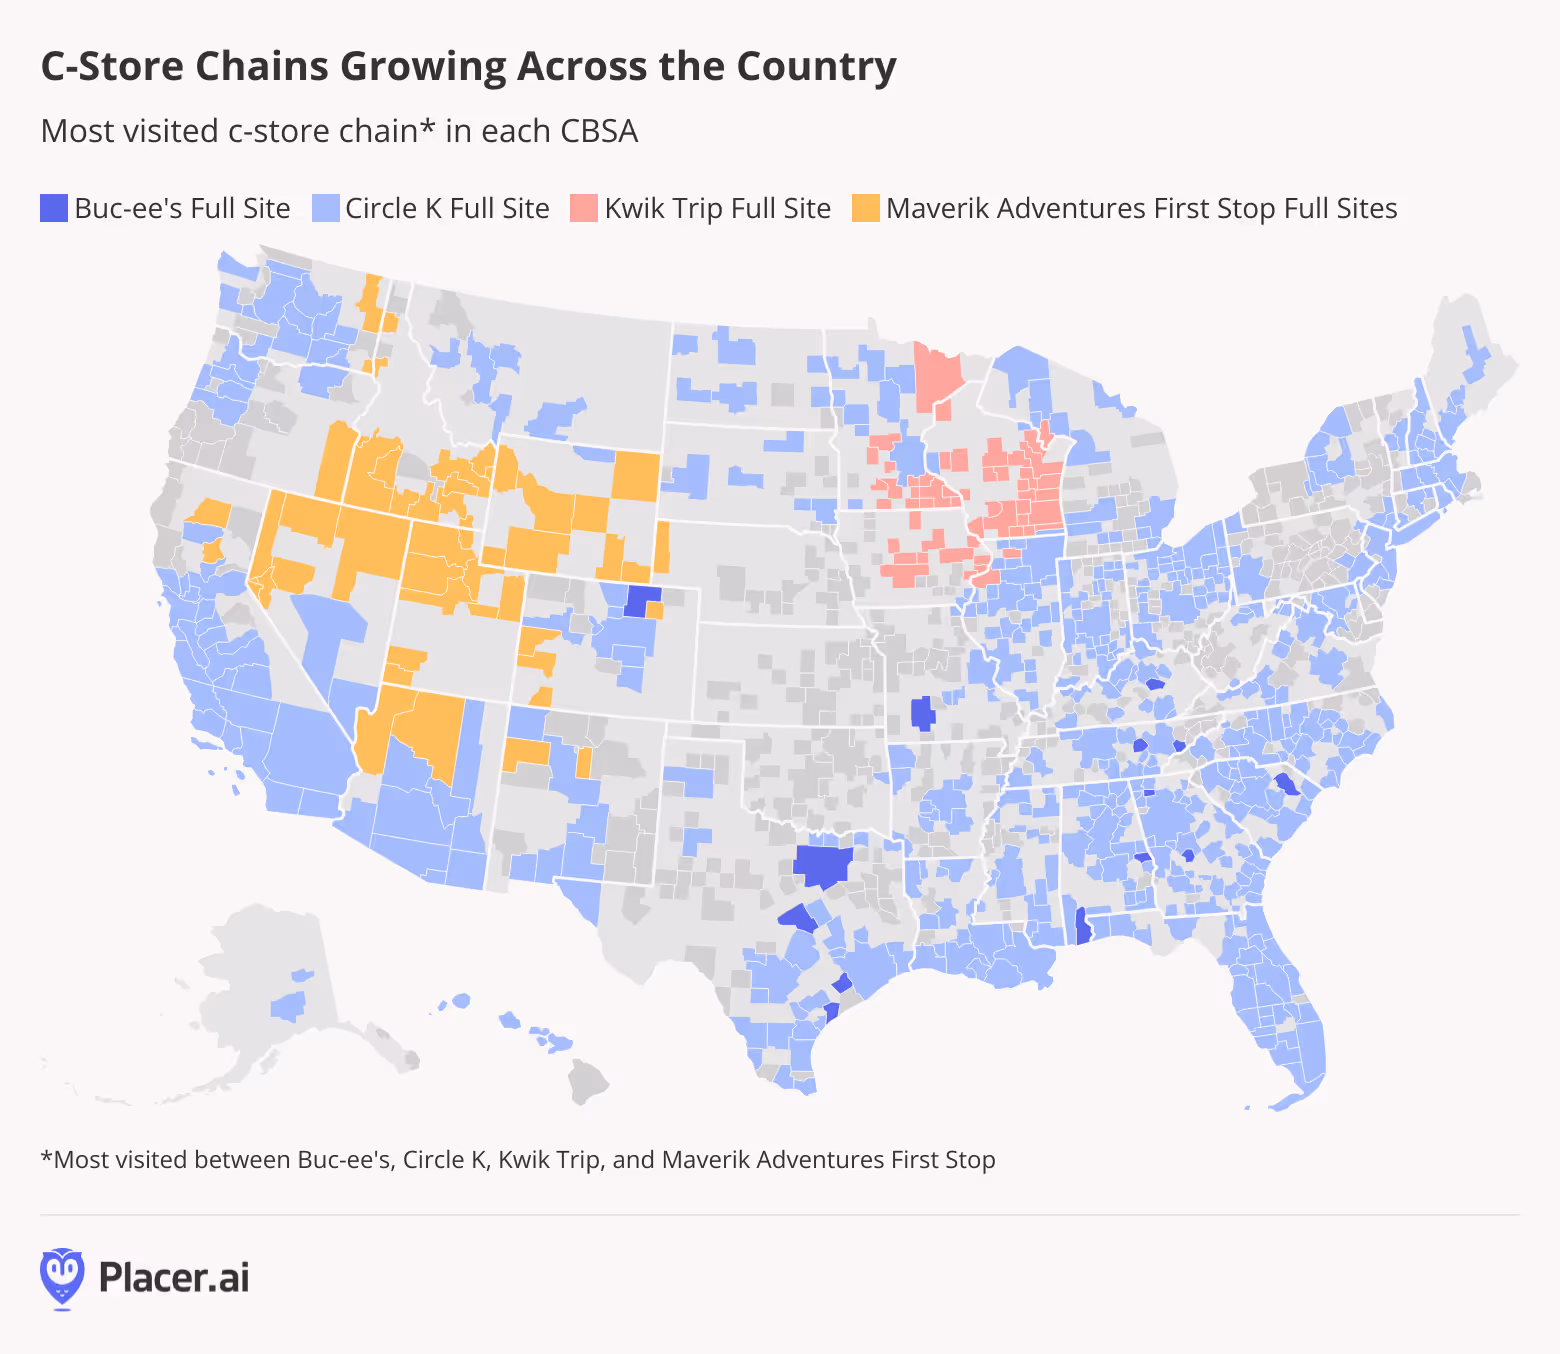
Nationwide Demand for C-Store Experiences
Looking at the most visited c-store chain in each CBSAs out of the chains analyzed in the graph above reveals that most CBSAs are home to a growing c-store chain. Maverik gets the most visits in the Southwest, while Kwik Trip’s is more popular in the Midwest. Buc-ees has a stronghold on the Dallas-Fort Worth metro area, while Circle K receives traffic all over the country. This suggests that demand for c-store offerings are growing nationwide – despite the plateauing of category-wide visits – and that c-store brands that can offer consumers innovative products and experiences are well-positioned to continue thriving in 2025 and beyond.
Looking Ahead
C-stores have demonstrated incredible resilience and adaptability, cementing their roles as key destinations for price-conscious shoppers eager to stretch their dollars – without compromising on quality. With regional markets still brimming with opportunities, which chains will lead the way in redefining convenience for 2025?
For more data-driven consumer insights, visit placer.ai.
.avif)
A decade after declaring bankruptcy, Detroit is coming back to life. The city is experiencing a resurgence that is bringing new energy to its streets – and an increase in the population of the wider CBSA.
We took a look at some of the data points highlighting the return of the Motor City to better understand what is driving the city’s growth.
Detroit's Comeback Gains Momentum
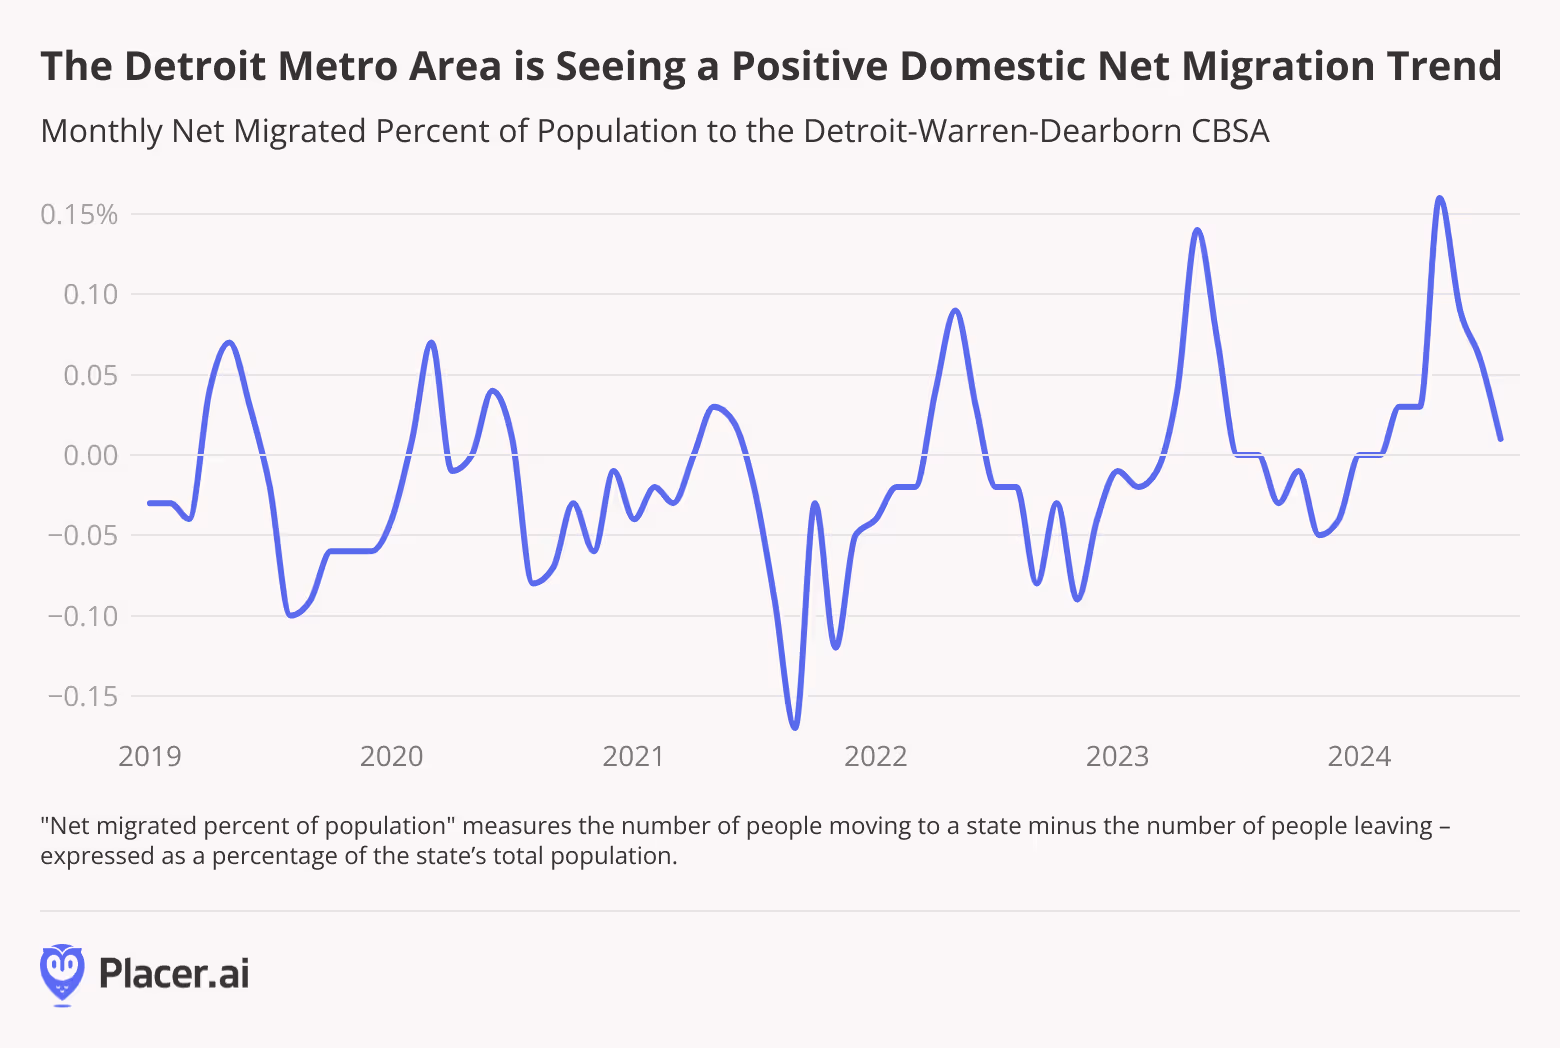
Detroit is making a comeback – undergoing a transformation from a depressed city to a viable and exciting place to live and work. Between July 2022 and July 2023, the city’s population grew for the first time in 66 years, likely thanks to economic revitalization efforts, a thriving tech scene, and a newfound “cool factor” driving inbound migration. And looking at more recent numbers for the wider CBSA indicates that the trend is continuing – net migration to the Detroit-Warren-Dearborne CBSA was either neutral or positive every month between January and August 2024.
This sustained net migration suggests that this growth is not a one-off – Detroit is increasingly becoming a place recognized for the opportunities it offers, economic and otherwise.
New Residents Coming From Nearby
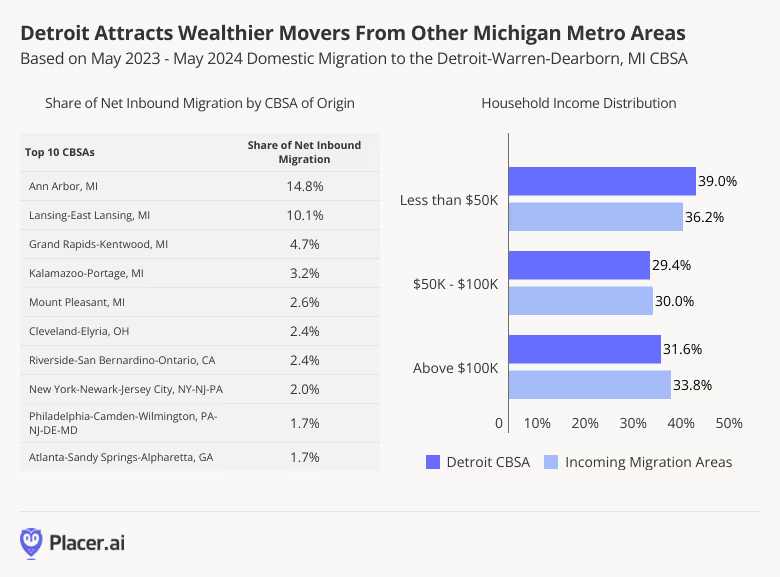
Diving into the CBSAs feeding Detroit’s domestic migration boom reveals that many of the Motor City’s newest residents are coming from other areas in Michigan. Between May 2023 and May 2024, the top five feeder CBSAs for migration to Detroit were located in the Wolverine State, accounting for over a third (35.4%) of new Detroit residents. The influx of Michiganders into Detroit may mean that Detroit’s new residents come with an already strong regional identity and are invested in continuing to revitalize Detroit.
The data also reveals that many of Detroit’s new residents came from areas with higher median household incomes (HHI) than the city’s: Around 33.8% of incoming residents came from areas where the median HHI was $100K and up, compared to just 31.6% of Detroit residents in that HHI bracket. The influx of higher-income residents to the area highlights just how well Detroit has reinvented itself, becoming an increasingly desirable destination for wealthier individuals – a positive feedback loop that could continue driving its economic growth.
The Continuous Comeback City
Detroit has been known by many names over the years – Motown, Detroit Rock City, The Paris of the West – and today, it’s earning a new title: the Comeback City. With a positive economic outlook, steady population growth, and a thriving cultural scene, the future looks bright for Detroit.
Stay up to date with the latest data-driven civic insights at Placer.ai.

