


.svg)


How did home improvement leaders The Home Depot and Lowe’s perform in 2024? And what lies ahead for the chains in 2025? We dove into the data to find out.
Gearing Up For Stability
A challenging retail environment continued weighing on the home improvement space in 2024 as high prices and tighter consumer budgets led many consumers to push off discretionary renovations and remodels. As a result, visits to The Home Depot and Lowe’s remained below 2023 levels throughout 2024. Still, the visit gaps were relatively minor – The Home Depot received 1.6% to 3.5% fewer quarterly visits and Lowe’s saw a 2.2% to 4.7% visit gap relative to 2023 – a testament to the enduring strength of these home improvement giants.
Promotions Drive Home Improvement Visits
Diving deeper into the daily visits data also reveals that, despite the challenges, the two retailers succeeded in driving significant visit boosts through promotions and holiday sales: Mother’s Day, Black Friday, and the Saturday of Memorial Day were the top three visited days for The Home Depot and Lowe’s in 2024. Lowe’s received its highest daily traffic boost on Mother’s Day – likely thanks to its free plant giveaway – while The Home Depot saw its largest visit surge over the traditionally busy Black Friday. Finally, Memorial Day sales drove the third largest visit peak for both chains.
The boost in consumer traffic during special events underscores the potential of seasonal promotions to drive engagement and foot traffic – even in times of wider retail headwinds and economic uncertainty.
Hobbyists May Be Taking Center Stage
Both The Home Depot and Lowe’s received fewer visitors in 2024 compared to 2023, but a closer look reveals that the YoY dips in repeat visitors (who visited at least twice a month) were larger than the declines in casual (once a month) shoppers. For example, in December 2024, the number of casual visitors to The Home Depot dipped 3.0% YoY while the number of repeat monthly visitors declined by 4.0% compared to 2023. YoY visitor trends to Lowe’s generally followed a similar trend.
This trend suggests that, with home sales at their lowest levels since 1995 and many consumers looking to avoid non-essential expenditures, demand for large-scale renovations may be slowing. As a result, contractors and homeowners undertaking major remodeling projects are likely visiting these stores less frequently.
But while these trends may be hampering home improvement visits in the short term, the current downturn could also be setting the stage for a future recovery – as a stabilizing economy could unleash significant pent-up demand.
What Comes Next For Home Improvement?
Visits to the country’s two largest home improvement retailers, while not yet returned to their pandemic-era highs, are beginning to stabilize. Will 2025 see a return to normal for the chains?
Visit Placer.ai to keep up with the latest data-driven retail insights.

Bloomin’ Brands, the parent company of Outback Steakhouse, Carrabba’s Italian Grill, Bonefish Grill, and Fleming’s Prime Steakhouse, faced a year of mixed results in 2024 amid continued challenges in the dining sector.
We analyzed the company’s overall performance, along with its individual brands, to see what the visit data reveals about the past year.
The Metrics Behind the Meal
The past year was a challenging one for many restaurant chains, and Bloomin’ Brands was not immune. Overall visits to the restaurant group declined by 2.9% YoY, with quarterly visits in 2024 falling between 1.9% and 4.0% compared to 2023.
Still, Bloomin’ appears to be working on a pivot – and visits per location metrics suggest that this is working. The company closed dozens of stores throughout 2024, a rightsizing strategy aimed at focusing on high-performing locations. As a result, visits per location tracked more closely with 2023 levels, with visits per location for 2024 as a whole up by 0.1% compared to 2023.
Getting Grain-ular
Diving into individual brands reveals that most of Bloomin’s chains displayed minimal visit gaps. In particular, Fleming’s Prime Steakhouse finished the year strong with a 0.8% YoY increase in Q4 2024 visits – in keeping with the general outperformance of fine dining concepts, especially around the holidays.
Still, one brand, Bonefish Grill, lagged behind the others. The company intends to simplify the menu and enhance the core brand experience, which may help bring visits back to Bonefish in 2025.
Rightsizing Reveals Rewards
While most Bloomin’ Brands chains experienced visit declines in 2024, visits per location tracked closely with 2023 levels, reflecting the impact of the company’s strategic closures.
Outback Steakhouse, Carrabba’s Italian Grill, and Fleming’s Prime Steakhouse all saw YoY increases in visits per location for three out of four quarters in 2024. Fleming’s in particular ended the year strong with a 3.3% visit per location increase in Q4 2024 – suggesting that Bloomin’ might do well by focusing on its more upscale offerings.
And Bonefish Grill saw smaller YoY visit gaps in average visits per location compared to its overall visit metric – a sign that rightsizing may have helped offset some of the broader traffic challenges.
Last Bites
Despite facing a challenging year, the stability in the average visits per location across Bloomin’ Brands serves as a reminder that there are plenty of ways for restaurants to pivot and succeed.
Follow Placer.ai for the latest data-driven dining insights.
Shake Shack and Wingstop, two major names in the fast-casual and quick-service restaurant category, have had a standout year. Both chains enjoyed impressive visits while executing wide-ranging expansion strategies.
We dive into the location analytics for both brands to recap 2024’s success.
Elevated Visits Across the Board
Shake Shack and Wingstop performed extremely well in 2024, with visits up 21.7% and 23.0%, respectively, compared to 2023 – thanks in large part to aggressive fleet expansions. Both chains enjoyed their strongest year-over-year (YoY) visit growth in the first half of the year, with H1 2024 visits to Shake Shack up 26.0% and to Wingstop up 28.7% compared to the same period in 2023. And while growth slowed down slightly towards the end of 2024, the two brands still ended the year with 16.8% (Shake Shack) and 11.6% (Wingstop) Q4 YoY visit growth – quite an impressive metric, especially given the wider dining headwinds.
Suburban Growth
Shake Shack and Wingstop are both in the midst of aggressive fleet expansions: Shake Shack opened 42 new locations and plans to triple that number in the coming years, while Wingstop added at least 138 new locations and also plans on adding hundreds of new stores in the coming years. Both companies have made suburban expansion a central focus of their growth strategies, and psychographic shifts in their captured markets over the past five years suggest this approach is working. Analyzing the chains’ visitor bases using the Esri: Tapestry dataset combined with Placer.ai captured market data reveals that Shake Shack increased the share of “Suburban Periphery” visitors in its trade area from 43.8% in 2019 to 45.4% in 2024. The share of the “Suburban Periphery” segment in Wingstop’s trade area rose from 23.8% to 24.9% during the same period. Wingstop also saw a decline in its share of “Urban Periphery” visitors while the share of the “Principal Urban Center” segment in both chains’ trade areas decreased during the analyzed period – further indicating growth in suburban markets.As more people migrate to the suburbs, offering convenient dining options outside of city centers is likely to remain a winning strategy for both chains.
LTOs: A Recipe for Success
While expansions helped drive the overall visit numbers up, the two chains also received several traffic spikes throughout the year driven by limited time offers (LTOs) and special menu launches. This strategy has recently proven successful for a number of QSR and fast-casual chains – Wendy’s, for example, finished 2024 with a 2.8% YoY increase in Q4 visits (0.7% YoY increase for 2024 as a whole) thanks in large part to its Krabby Patty Kollab LTO. Shake Shack received the most significant visit increase relative to its 2024 weekly visit average during its holiday special which included offers of free burgers every day from mid-December through Christmas Eve. Diners eagerly responded to the promotion, with weekly visits surging by 24.4% during the week of December 16th, 2024 relative to 2024’s weekly average. Similarly, Wingstop’s National Wing Day promo led to a 17.2% visit increase over the week of July 30th. Other promotional activities also influenced visits at these dining chains. For example, Shake Shack’s summer barbecue menu, which included a unique perk – a limited offer of “stain insurance” for customers who got excess BBQ sauce on their clothes – drove visits 13.8% higher than the weekly visit average. Similarly, Wingstop’s Summer of Flavor bundle drove visits to the chain during the week of July 22nd, 2024 by 6.6% relative to the 2024 weekly visit average. These promotions highlight the importance of creating buzz and offering exclusive deals to attract both new and returning customers.
Moving and Shaking
Both Shake Shack and Wingstop enjoyed impressive visits in 2024 while expanding their fleets – but can the two chains continue this success into 2025? Visit Placer.ai/blog to keep up with the latest data-driven dining insights.

RBI and Yum! Brands own and operate some of the country’s most beloved and well-known dining chains. We took a look at the visit data for 2024 to see how the two companies fared in a period of economic headwinds and uncertainty.
Dining Leaders
Restaurant Brands International (RBI) and Yum! Brands are leaders in the fast food and fast casual dining segment. Each company operates four restaurants with major footprints across the country – RBI owns Tim Hortons, Burger King, Firehouse Subs, and Popeyes, and Yum! manages Pizza Hut, Taco Bell, KFC, and The Habit Burger Grill.
Yum! Brands enjoyed visit and visits per location growth in all but one quarter, capping off Q4 2024 with an 0.8% increase in visits and a 1.6% increase in visits per location on a YoY basis. RBI’s visits and visits per location, meanwhile, hovered at or just below 2023’s levels in all but one quarter of the year, highlighting the challenges facing the dining segment in 2024.
Mixed Visits, Popeye’s Stands Out
Of the four RBI brands, Popeyes enjoyed the strongest visitation patterns throughout 2024.The chain has been a standout for the past few years – likely owing to its popular chicken sandwiches – and Popeyes performed well in 2024 as well, with YoY visit growth during most quarters.
Following Popeyes in visit growth was Tim Hortons – Canada’s leading coffee chain – which saw positive momentum in the first half of 2024, though visits dipped in the latter half of the year. And though Burger King’s visits were sluggish, the chain has been focusing on optimizing its store fleets with strong results.
While overall visits across RBI’s brands were slightly below 2023 levels, their ability to remain close to last year’s numbers – and even achieve growth in some quarters – signals resilience.
Yum! Brands: Promotions Boost Visits
Yum! Brands delivered a strong performance in 2024, buoyed by Pizza Hut and Taco Bell’s consistent growth. Taco Bell in particular stood out, driving foot traffic through promotions like its highly popular Taco Tuesday special. The chain experienced quarterly YoY visit growth throughout the year, culminating in a 2.1% increase in Q4 2024 relative to 2023.
Pizza Hut also experienced impressive visitation growth in 2024, especially in Q2. In contrast, KFC faced challenges with declining visits, while The Habit Burger Grill’s traffic remained steady, closely tracking 2023 levels.
Stabilizing Visits, Room For Growth
RBI and Yum! Brands experienced ups and downs throughout 2024, with some of their chains thriving while others showed modest visit declines.
With the new year well underway, how might RBI and Yum! work to drive increased visits to their restaurants?
Visit Placer.ai for the latest data-driven dining updates.
In recent years, Tennessee has emerged as a surprising migration hotspot. The state, which offers a growing tech scene, business-friendly tax regulations, and a relatively low cost of living is rapidly gaining popularity and attracting inbound migration from across the nation.
Where are newcomers coming from – and where within Tennessee are they going? Using Placer.ai’s Migration Trends Report, we took a closer look at the migration data to gain a more thorough understanding of the shifts taking place in the Volunteer State.
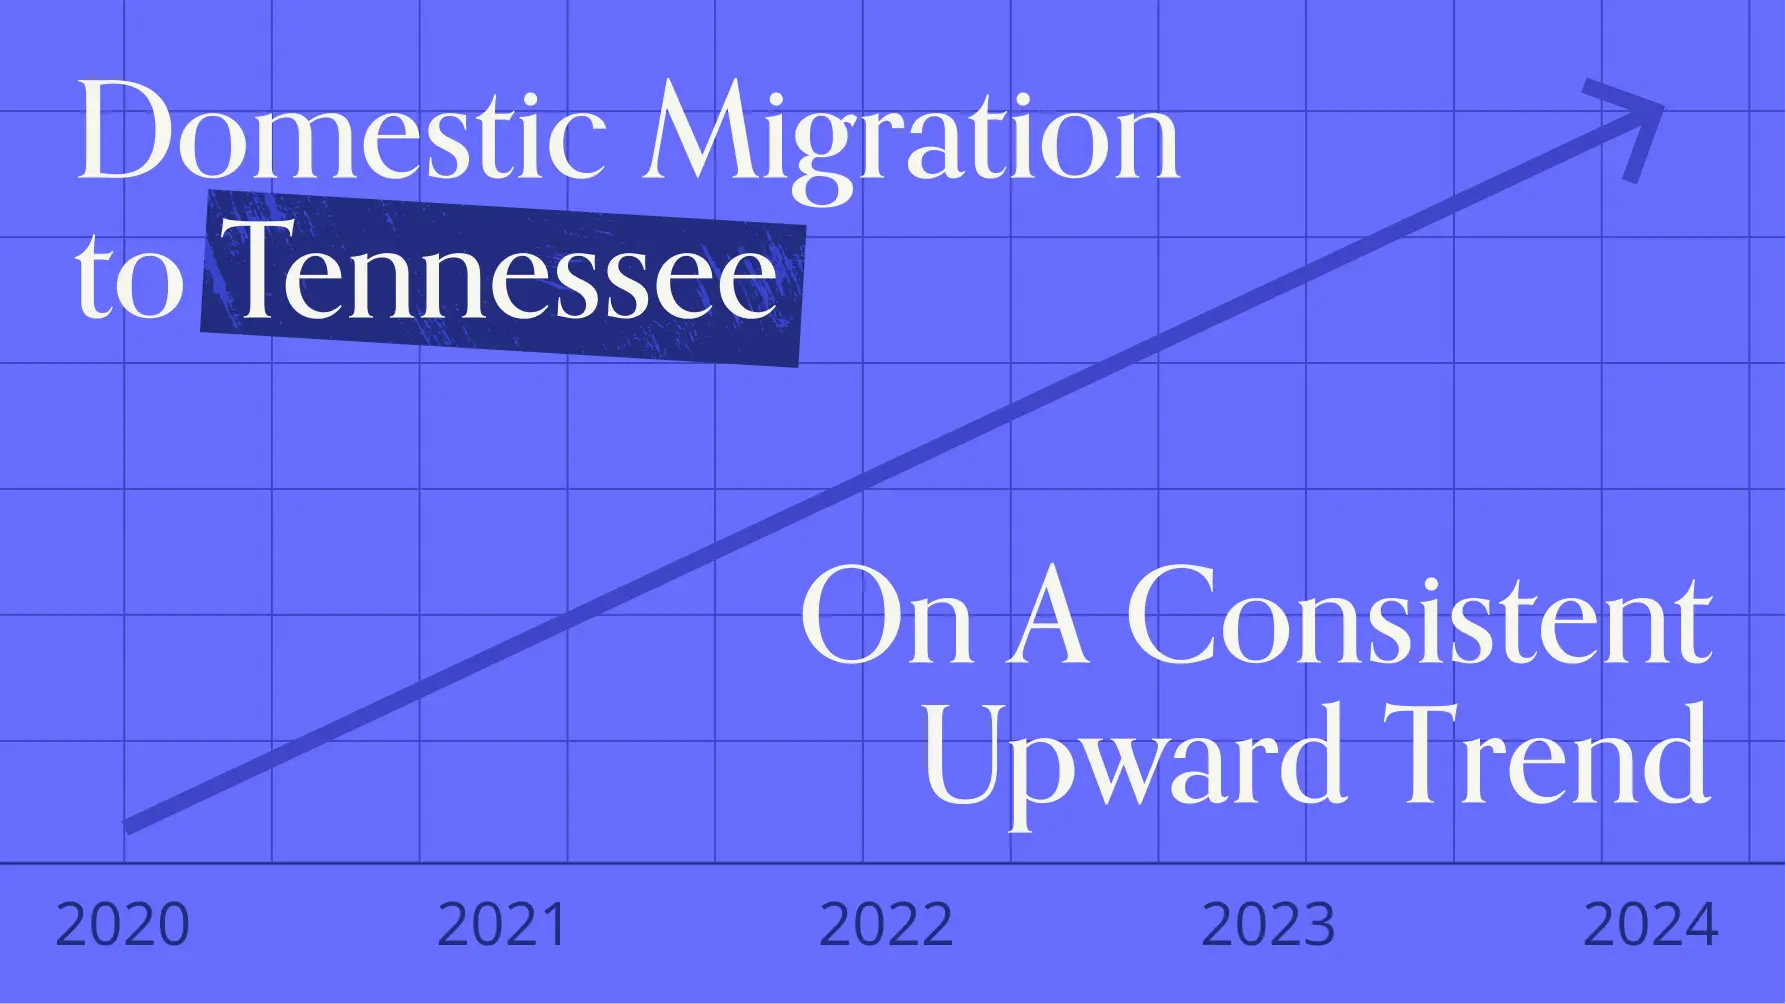
Tennessee’s Migration Trends
The state of Tennessee has experienced significant positive migration over the past few years. Between July 2020 and July 2024, the cumulative net migrated percent of Tennessee’s population increased steadily, with 2.1% of the state’s July 2024 population having moved there from elsewhere in the country over the previous four years.
Majority of Newcomers from the East Coast
Diving deeper into Tennessee’s migration patterns reveal that between July 2020 and July 2024, the state had net positive domestic migration from 41 out of 50 states – meaning Tennessee gained more residents from these states than it lost to those states. Illinois and California together accounted for almost 40% of Tennessee’s net positive domestic migration during the period, and the state also drew a large contingent (33.6% of net positive domestic migration) from the East Coast.
Cities in Tennessee Experiencing Strong Population Growth
While Memphis, Tennessee’s second-largest city, has made headlines in recent years for its declining population, other metro areas in the state are experiencing strong interest from newcomers.
Between July 2020 and July 2024, the Nashville CBSA (core-based statistical area) received the largest share of net positive domestic migration, with 24.6% of newcomers to Tennessee settling in the Music City. Nashville has been establishing itself as a tech hub, a factor which may have driven its strong net migration.
Knoxville came in second, welcoming 18.7% of the positive net migration to Tennessee between July 2020 and July 2024. Other CBSAs rounding out the top five were Chattanooga (9.0% share of positive net migration), Kingsport-Bristol (8.7%), and Johnson City (6.0%).
Age Is More Than a Number
The influx of new residents into Tennessee is not only helping drive the state’s population up – it’s also reshaping its demographic composition. Zooming into the top five CBSAs mentioned above reveals that newcomers generally are coming from CBSAs of origin where the weighted median age is younger than the existing population.
The only metro area bucking this trend was Clarksville, where incoming residents were slightly older than the youthful median 31 years of its residents, though this may be a reflection of its strong university and military presence.
The movement of younger people into these up-and-coming CBSAs reflects the opportunities available for people to grow their careers and put down roots in a state that is quickly becoming a hub for growth and opportunity.
The Only 10 I See
Tennessee seems to have reinvented itself as a destination for young people seeking out opportunities for growth. By continuing to foster a business-friendly environment and supporting its diverse communities, the state is well-positioned to thrive.
Visit Placer.ai to keep up with the latest data-driven migration trends.

How have McDonald’s and Chipotle, two of the most recognizable names in the quick-service and fast-casual dining scenes, fared over the last year? We take a closer look at each chain’s visit performance, and highlight some bright spots of 2024.
McDonald’s: Visits Vary, Outperform Overall QSR
Visits to McDonald’s were mixed throughout 2024, with most months seeing minor visitation lags relative to 2023. Still, YoY traffic trends outpaced those of the overall QSR segment in all but one month (October 2024), highlighting the chain’s power relative to the rest of the market.
Specials Drive Visits
Some of the visitation dips at both McDonald's and the overall QSR segment are likely due to inflation impacting prices across the dining industry. And the rise of the budget-conscious consumer has prompted many chains to lean on limited-time offers and special releases to both offer affordable deals and turn a trip to a QSR into a special occasion. McDonald’s capitalized on this trend, driving impressive visit boosts following the June launch of its $5 Meal Deal. However, it was the chain’s special releases that delivered the most significant increases in weekly visits.
The introduction of the Chicken Big Mac on October 10th, 2024 proved to be a major success, driving a 7.2% increase in visits during the week of the launch (October 7th-13th) and an even larger 8.7% increase in the first full week following the release (October 14th-20th). The chain also enjoyed a jump in foot traffic from its limited-edition collector’s meal, launched on August 12th, 2024, further highlighting the effectiveness of these strategic, nostalgia-driven releases.
Chipotle: Wrapping Up Another Impressive Year
Chipotle has been a fast-casual darling for several years now, consistently driving YoY visit growth and expanding into new markets. And 2024 was no exception for the chain, with visits growing in all months analyzed. This included an impressive 21.1% year-over-year increase in April 2024, followed by sustained growth throughout the remainder of the year, culminating in an 8.8% increase in December 2024 compared to 2023. In contrast, the broader fast-casual category saw much more muted visitation patterns.
Growing Across The Country
Some of Chipotle’s visit growth can be attributed to the aggressive growth strategy the company has undertaken, opening approximately 300 stores in 2024 with plans to add another 300 locations in 2025. A significant part of this expansion strategy focuses on rural and suburban markets in a bid to capture untapped demand beyond traditional urban hubs.
And diving into visits per location reveals that, overall, this strategy is working. All but eight states analyzed showed YoY visit per location growth in 2024 – and five of the top ten states for visits per location growth are among the least densely populated in the country. This suggests that Chipotle's decision to target smaller markets is paying off, enabling the brand to attract new audiences while reinforcing its stronghold in more densely populated areas.
Final Bites
Despite a challenging 2024, McDonald’s and Chipotle are surviving – and even thriving.
What might lie ahead for the two chains as 2025 gets underway?
Visit Placer.ai for the latest data-driven dining updates.

