Eatertainment chains – entertainment concepts that combine dining and play – are thriving in the current experience economy. We dove into the data for game and restaurant chains Dave & Buster’s and Main Event Entertainment to better understand how eatertainment is driving success in 2024.
Ezra Carmel
May 30, 2024
3 minutes
Eatertainment chains – entertainment concepts that combine dining and play – are thriving in the current experience economy. We dove into the data for game and restaurant chains Dave & Buster’s and Main Event Entertainment (acquired by Dave & Buster’s in 2022) to better understand how eatertainment is driving success in 2024.
Year-Over-Year: Reasons to Cheer
The past few years have been challenging ones for restaurants. But eatertainment has a special draw – and since November 2023, both Dave & Buster’s and Main Event Entertainment have seen mainly positive YoY visit growth.
In January 2024, visits slowed in the wake of extreme weather that rocked much of the country and led many would-be diners to stay home. But in February and March 2024 things picked up again, with the two chains seeing YoY visit growth ranging from 4.6% to 10.6%.
Again in April 2024, both Dave & Buster’s and Main Event Entertainment experienced minor visit gaps. But a closer look at weekly visits reveals that this was largely due to a calendar shift: April 2024 had one fewer Saturday than April 2023 – the chains' busiest day of the week by far. (In Q1 2024, Saturdays accounted for 33.8% of total visits to Main Event Entertainment and 33.3% of visits to Dave & Buster’s). And during nearly every individual week of April 2024, the brands maintained strongly positive momentum.
Feeling Special(s): Cultivating Loyal Audiences
Dave & Buster’s and Main Event Entertainment recent visit growth has been partly fueled by the two chains’ growing store counts. And a deeper dive into how the chains’ visitation patterns have evolved since COVID shows why they are well-positioned for continued expansion – and success.
One factor likely contributing to the eatertainment brands’ strength is the increasing loyalty of their visitors. Dave & Buster’s leveled up its rewards program in 2021 – and has been upping its loyalty game ever since. Members can access special deals, like the chain’s recent 50% off food promotion, and earn points by playing games or ordering off the menu. Main Event, too, keeps customers coming back with a variety of promotions, from Monday Night Madness to Kids Eat Free Tuesdays – a particularly attractive offer for the chain’s family-orientedaudience.
And since 2019, both chains have seen a steady increase in the share of visits made by customers frequenting the chain at least twice a month.
When the Time is Right: Visits Late at Night
In addition, both Dave & Buster’s and Main Event appear to be finding success by leaning into the evening daypart.
Back in 2019, Main Event introduced a late-night menu and announced that all of its stores would be open until at least 12:00 AM – and even later on Fridays and Saturdays. (Even before that, some of its stores were open during the wee hours). Dave & Buster’s has also taken steps to increase its night-time business with special late-night deals and happy hours.
And location analytics indicates that this strategy is bearing fruit. Over the past several years, both brands have experienced an increase in their share of late-night visits (i.e. those taking place between 9:00 PM and 2:00 AM). And in Q1 2024, Dave & Buster’s and Main Event saw 23.9% and 27.3% of their total visits during the late-night daypart, respectively.
While it might be assumed that at-home entertainment and the "Netflix effect" pose a threat to eatertainment chains (particularly during the evening hours, as there is more content than ever to get home to), the data suggests that many consumers are staying out late for social dining and entertainment.
More Fun to be Had
Demand for dining and social experiences continues to grow. As consumer behavior and demographics evolve, how will these eatertainment chains perform and which new concepts may rise to prominence as 2024 progresses?
Are luxury retailers and high-end department stores making a comeback? Dive into the data to find out.
Ezra Carmel
May 29, 2024
3 minutes
In this blog, we dive into the latest location analytics and demographic data for luxury retailers and high-end department stores and take a closer look at consumer behavior in the upscale shopping space.
Seasonal Shopping Returns Stateside
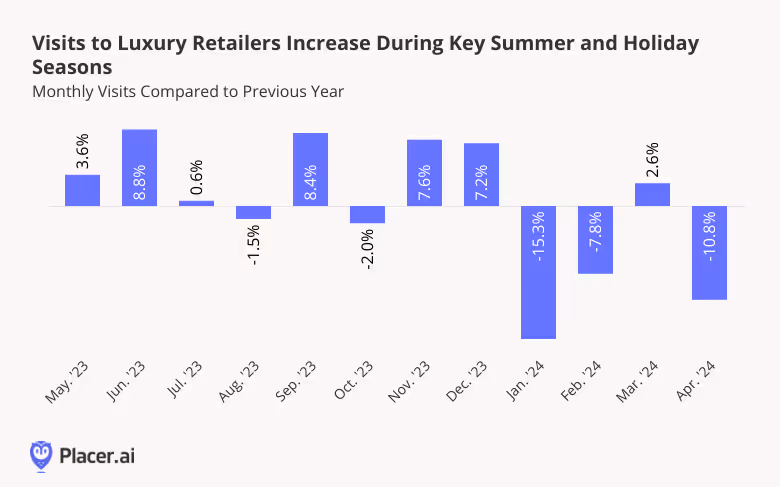
Over the past year, the Placer.ai Luxury Retail Index – including brands like Louis Vuitton, Tiffany & Co., and Chanel – saw year-over-year (YoY) foot traffic growth during crucial shopping seasons. May and June 2023 had significant increases in YoY visits, perhaps due to an influx of recreational shoppers on summer vacation, and July saw an uptick as well. YoY visits peaked again in November and December, likely reflecting the popularity of upscale retail corridors during the all-important holiday shopping season.
Some of this strength may be a result of affluent consumers refocusing their shopping on the U.S.: In 2022, many high-income shoppers chose to purchase big-ticket items abroad due to various economic benefits. But by 2023, demand for domestic luxury retail appeared to rebound, as some upscale retail clients “repatriated” their discretionary dollars.
To be sure, visit gaps re-emerged in some months of early 2024 – though these are partly attributable to factors like January’s unusually stormy weather and an April calendar shift. (April 2024 had one fewer Saturday than April 2023, providing less opportunity for visits in the highly discretionary category). But March 2024 also saw YoY visit growth. And given how well luxury retailers performed during their busiest months of year, the category may very well rally once again heading into the summer.
High-End Department Stores Close the Gap
Recent location intelligence also offers encouraging signs from the high-end department store space.
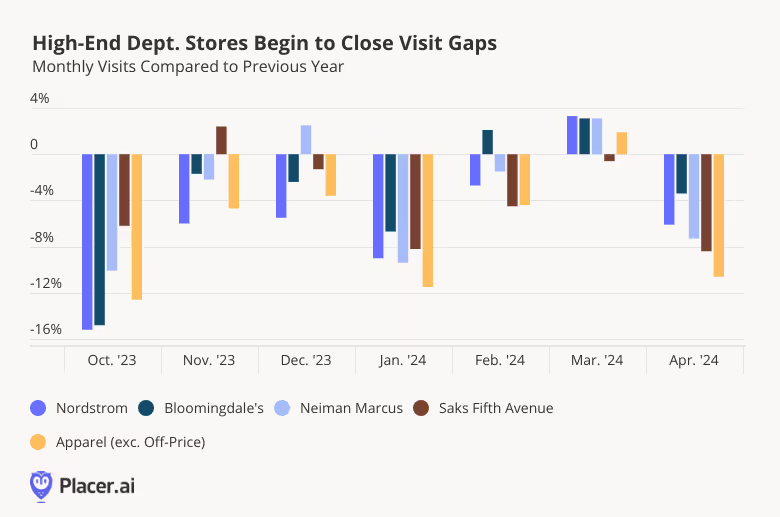
Like luxury retailers, high-end department stores saw narrowing visit gaps during the peak holiday shopping season – with Saks Fifth Avenue seeing a YoY uptick in November 2024, and Neiman Marcus seeing one in December.
In March 2024, YoY traffic turned positive for Nordstrom (3.3%), Bloomingdale’s (3.1%), and Neiman Marcus (3.1%), while Saks Fifth Avenue had just a -0.6% visit gap. And although April 2024 was a challenging month for the retailers, perhaps due in part to the calendar shift mentioned above, all four upscale department stores outperformed the traditional apparel category – another indication that high-end department stores may be poised for a comeback.
The Highest Earners Drive Traffic
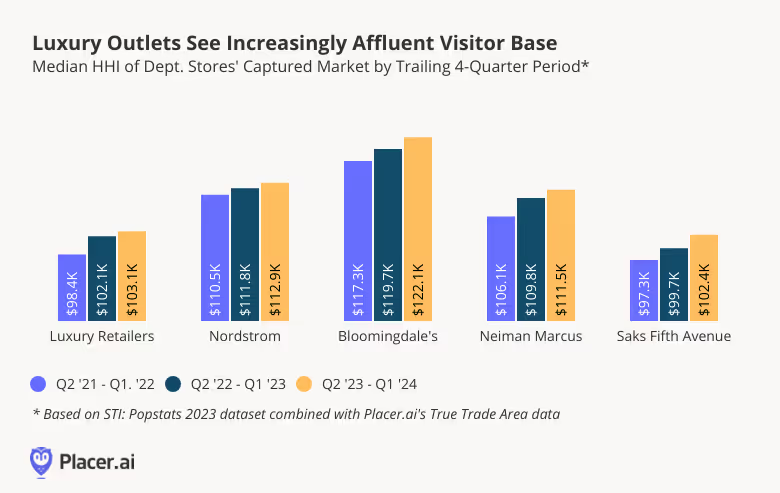
Analyzing demographic changes in the captured markets of both luxury brands and high-end department stores indicates that increasingly affluent consumers are the main drivers of visits to the segment. (A chain’s captured market is obtained by weighting each Census Block Group (CBG) in its trade area according to the CBG’s share of visits to the chain – and so reflects the population that actually visits the chain in practice).
Over the last four quarters, visitors to luxury retailers and high-end department stores came from areas with higher median household incomes (HHIs) than in previous years. For example, during the period between Q2 2023 and Q1 2024, the median HHI of Bloomingdale’s captured market was $122.1K, an increase from $119.7K between April 2022 and March 2023, and $117.3K from April 2021 to March 2022.
In the face of recent inflationary pressures, aspirational luxury shoppers (who tend to be slightly less affluent) are likely quicker to adjust their behavior and trade down to more affordable brands. Meanwhile, prestige luxury shoppers – those with the highest incomes – tend to be relatively resilient, and so are able to continue shopping at their favorite luxury brands, driving up the HHI in these retailers’ trade areas.
Looking Ahead
Luxury retailers and high-end department stores have had recent foot traffic successes, while their clientele has become increasingly affluent. Will these brands continue their upward visit trajectories – and how will they leverage affluent foot traffic going forward?
Discretionary retail has faced its fair share of challenges over the past few years. But even in this challenging environment, some brands, like Ulta Beauty, are continuing to see visit growth, while others, like Gap and Old Navy, are making a comeback.
Bracha Arnold
May 28, 2024
4 minutes
Discretionary retail has faced its fair share of headwinds over the past few years, from pandemic-related restrictions to inflation. And while prices have stabilized, subdued consumer confidence continues to weigh on non-essential segments. But even in this challenging environment, some companies, like Ulta Beauty, are continuing to see visit growth, while others, like Gap Inc. and its portfolio of apparel brands, are making a comeback.
With Q2 2024 well underway, we take a look at the foot traffic patterns for these companies to see how they are faring.
Ulta: The Beauty Powerhouse Sees YoY Visit Growth
In 2020, Placer.ai predicted that Ulta Beauty would be an unstoppable force in beauty retail – and the chain has impressed ever since. Over the past several years, Ulta has been on a consistent upward visit trajectory, propelled by strong demand for affordable luxuries (the so-called “Lipstick Effect”), and consumer interest in self-care.
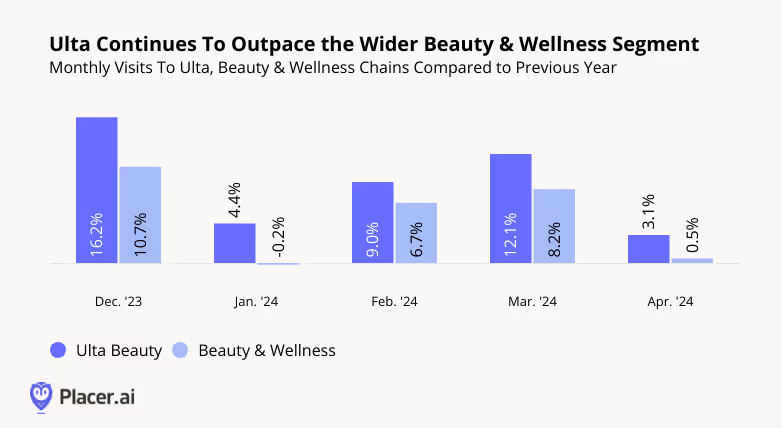
And though the pace of Ulta’s tremendous YoY visit growth has moderated somewhat in recent months, the beauty giant continues to thrive – drawing even more visitors in early 2024 than during the equivalent period of last year. Between January and April 2024, YoY visits to the beauty retailer remained consistently elevated, outperforming the wider Beauty & Wellness space.
Gap Brands: A Retail Revival
The fashion segment has experienced rising prices and persistent inflation over the past few years, leading to a new era of discount and thrift shopping. And iconic apparel retailers like Gap Inc – operator of Gap, Old Navy, Athleta, and Banana Republic – have not been immune to the challenges facing the category.
But through a combination of high-profile hirings and revitalized branding efforts, Gap Inc. has been readying itself for a comeback. In Q4 2023, the retailer announced stronger-than-expected results, driven primarily by Gap and Old Navy. And recent foot traffic to the company’s largest brands provides further evidence that its turnaround efforts may be starting to bear fruit.
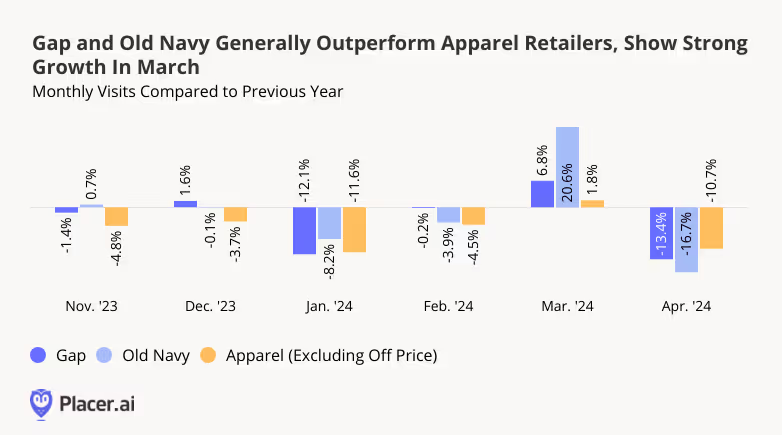
During the all-important November and December shopping season last year, Gap and Old Navy saw YoY visits hold steady or increase, outpacing the wider Apparel space. In January 2024, visits to the two chains declined in the wake of an Arctic blast that kept many shoppers at home. But in February, Gap enjoyed a 0.7% YoY visit bump, while Old Navy saw just a mild drop – less than that of the overall Apparel category. In March 2024, both Gap and Old Navy enjoyed strong YoY visit growth, far outperforming overall Apparel – likely driven by sales events held by eachbrand. And though April saw YoY visits decline once again, with the two chains falling behind Apparel, drilling down into weekly data offers a different perspective.
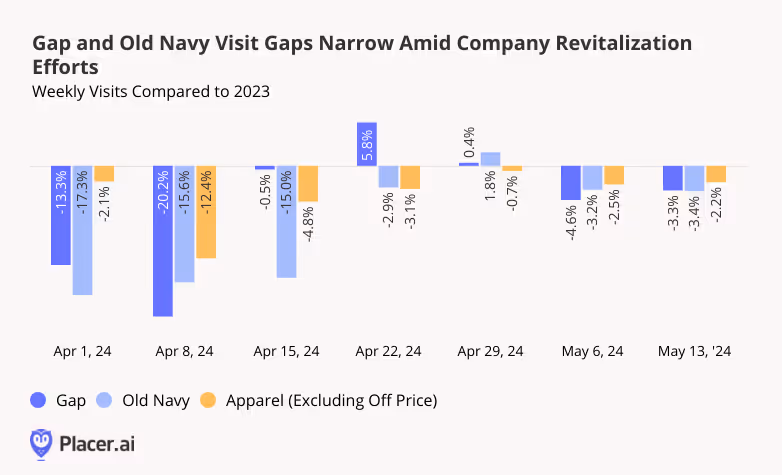
Both Gap and Old Navy started off April with lackluster YoY performance, perhaps due in part to the comparison to an early April 2023 that included Easter weekend. But towards the end of April and beginning of May, Gap and Old Navy’s’ visit gaps narrowed – with some weeks seeing positive YoY visit growth, and with the two chains once again either nearly on par with, or outperforming, overall Apparel.
Gap Inc. itself is bullish about what the next year holds in store, with big names like Zak Posen joining the Gap family in hopes of propelling the company forward. Though it may be premature to declare an end to the troubles that have plagued the clothier in recent years, early 2024 foot traffic provides further evidence that the company is heading in the right direction.
Final Thoughts
Ulta continues to experience visit growth, highlighting Beauty’s enduring appeal. Meanwhile, Gap and Old Navy are witnessing narrowed visit gaps and some weekly visit growth.
Is the Apparel segment making a comeback? Can the Beauty segment sustain its positive momentum indefinitely?
Visit Placer.ai to keep up to date with the latest retail developments.
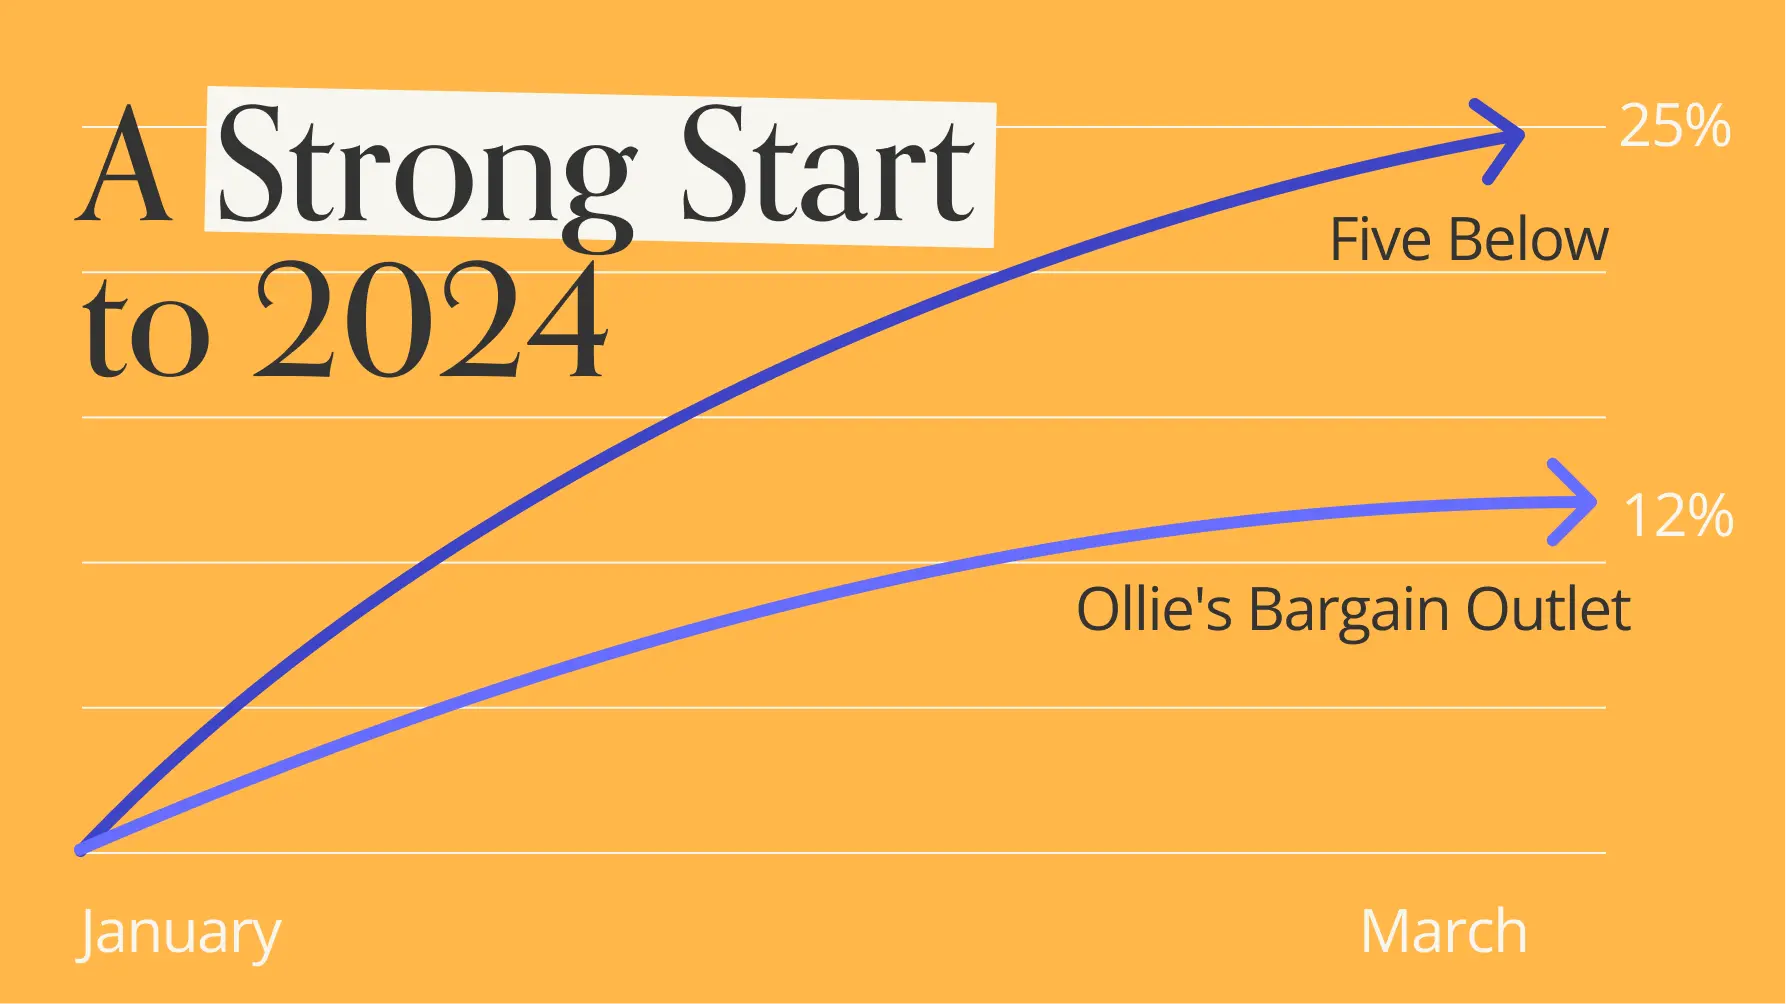
We dove into the data to check in with specialty discount chains Ollie’s Bargain Outlet and Five Below. How did they fare in early 2024? And what can the two brands’ recent performance tell us about what lies in store for them in the months ahead?
Ezra Carmel
May 27, 2024
3 Minutes
We dove into the data to check in with specialty discount chains Ollie’s Bargain Outlet and Five Below. How did they fare in early 2024? And what can the two brands’ recent performance tell us about what lies in store for them in the months ahead?
The Hop Don’t Stop: Easter Caps off the Quarter
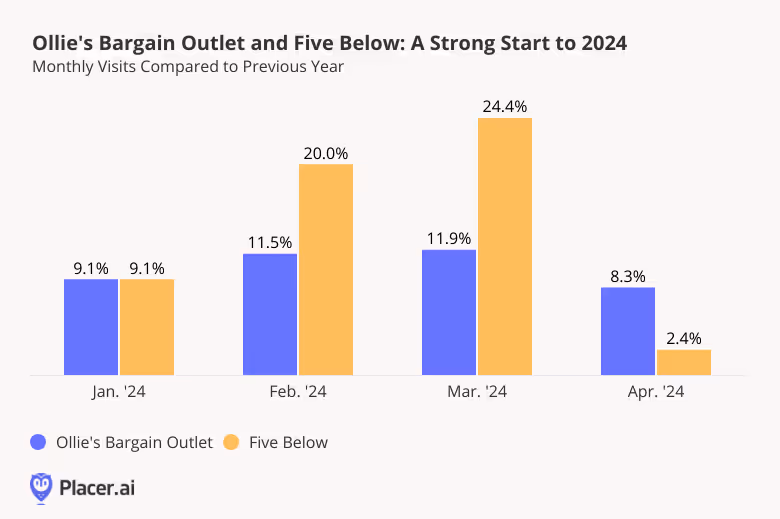
A quest for bargains and the promise of unexpected finds have kept Discount & Dollar Store shoppers coming so far in 2024. Despite lapping a strong 2023, foot traffic to Ollie’s Bargain Outlet and Five Below remained consistently above last year’s levels between January and April 2024, partly due to the chains’ continuedexpansions.
Though both chains draw Easter shoppers with special seasonal offerings, Five Below’s primary focus on low-ticket recreational merchandise makes it a natural destination for shoppers eager to fill their baskets with candy and other inexpensive holiday items. And Q1 2024 foot traffic to the chain appeared to be shaped by Easter shopping patterns. The brand’s YoY visits increased significantly in February with the roll-out of holiday wares, and the Saturday before Easter (March 30th, 2024) saw a sizable foot traffic boost that was 38.7% above the chainwide average for Saturdays in Q1 2024 – contributing to the month’s elevated visits overall. This pull-forward in demand, together with the comparison to an April 2023 that included Easter Sunday, at least partially explains Five Below’s more modest visit growth in April.
For both Ollie’s and Five Below, strong traffic since the beginning of the year indicates continued YoY gains may be expected in the months ahead.
Leisurely and Weekend Visits Drive Growth
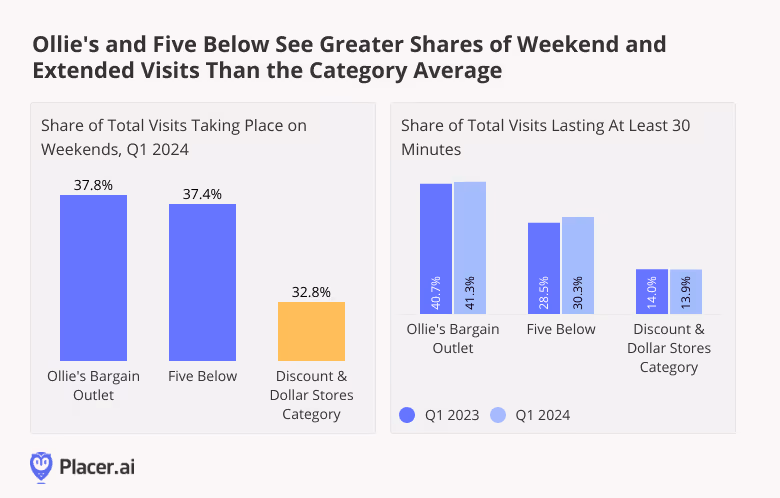
In addition to YoY visit growth in the early months of 2024, Ollie’s and Five Below are seeing elevated weekend visits and an increase in longer visits, indicative of a robust treasure-hunting culture that is driving demand.
In Q1 2024, 37.8% of visits to Ollie’s and 37.4% of Five Below’s visits occurred on weekends, while weekend visits accounted for only 32.8% of visits to the wider Discount & Dollar Store category. This is likely due to Ollie’s and Five Below’s growing notoriety as destinations for treasure hunting – a pastime perhaps preferred at the end of the work week when schedules are more flexible.
Meanwhile, the share of visits lasting over 30 minutes in Q1 2024 increased for both brands YoY, even as it slightly declined for the category as a whole. This indicates that shoppers drawn to Ollie’s and Five Below’s recreational vibes spent even more time browsing the aisles in Q1 2024 than they did last year. Ollie’s closeout buying model and shifting array of steeply discounted brand name merchandise is especially conducive to the thrill of the hunt – and the chain saw a remarkable 41.3% of visits lasting more than half an hour in Q1.
Taking Stock
Ollie’s Bargain Outlet and Five Below continue to demonstrate their consumer appeal in 2024. As the brands expand, holidays prove to be retail highlights while a culture of treasure hunting has shown its capacity to drive consistent traffic.
For more data-driven retail insights, visit Placer.ai.
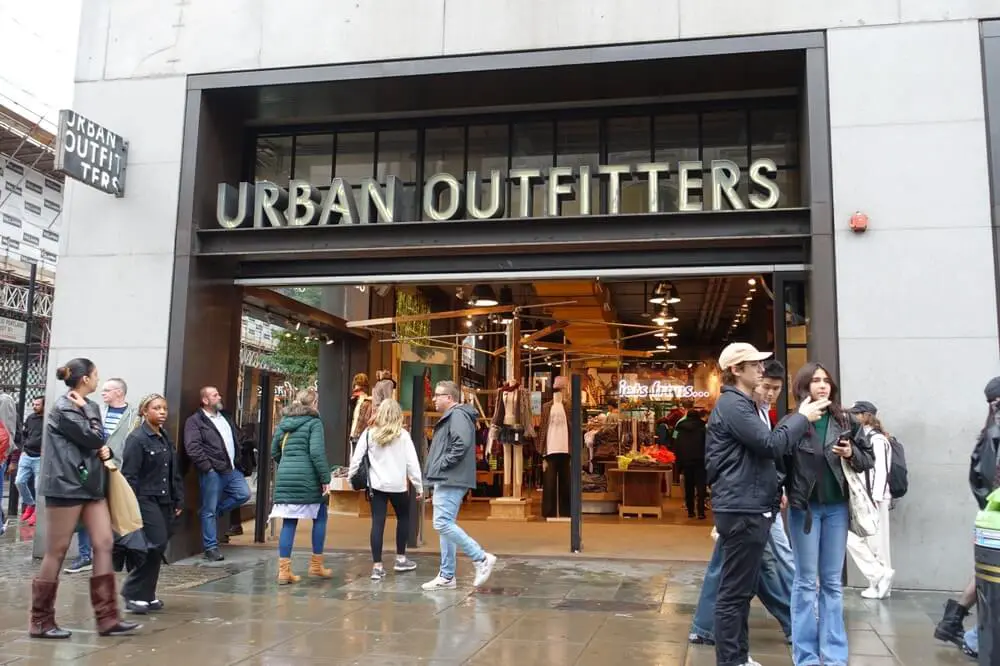
In the spirit of retail quarterly earnings season, it has been eye-opening to see the disparity in performances, especially among specialty retailers. This week, Urban Outfitters, Inc. (URBN) reported first quarter earnings, with comparable dollar sales up 4.6%, a strong growth number compared to many in the industry. Urban Outfitters, Inc. benefitted from a diversified retail portfolio, with the growth stemming from its Anthropologie, Free People and Nuuly brands, both in-store and online, while its namesake brand continues to be challenged over the past few years. As far as specialty apparel retailers go, the company has done a fantastic job of creating retail experiences that are unique and irreplaceable for their customers, and finding true competitors of its brands proves difficult.
Looking at Q1 2024 traffic performance, Free People and Anthropologie led the way, echoing the earnings release. Free People visits, excluding FP Movement, grew 8% year-over-year and Anthropologie saw an increase in traffic of 5% year-over-year. Urban Outfitters, on the other hand, actually saw traffic levels beat sales performance, with traffic flat compared to Q1 2023.
Anthropologie, despite retail and economic headwinds, has tightened up its value proposition to consumers and has a clear vision of its target shopper. Using Spatial.ai’s PersonaLive segmentation (as shown below), Anthropologie attracted the most visits from Ultra Wealthy Families in Q1 2024, followed by Young Professionals and Sunset Boomers. Compared to the other portfolio brands, Anthropologie attracts a higher median income consumer and over indexes with more mature consumers, two groups that have higher levels of spending power in today’s economy and haven’t decidedly altered their retail habits as much as middle- and lower-income shoppers. Anthropologie has clearly benefited from the strength of its visitors, and its curated multi-category retail experience that has shielded the chain from the struggles of other home furnishing and apparel retailers. It will be interesting to watch if the brand is able to continue to maintain its success through the remainder of the year if economic conditions become further challenged.
Free People appeals to a consumer somewhat in the middle of both Anthropologie and Urban Outfitters, and has been able to capitalize on Anthropologie’s success and hedge against Urban Outfitters’ struggles. Free People’s design sense makes it a crowd-favorite but also a source for many “dupes” on other retail platforms; however, the influx of similar designs haven’t seen to slow their momentum. FP Movement, the brand’s athleisure line that also has stand alone retail locations, has been another lever for growth. Using Placer.ai to look at three FP movement locations compared to the Free People chain, FP movement grew visits faster than the parent brand, and also had a higher dwell time. Urban Outfitters, Inc. disclosed that dollar sales for Free People were up almost 18% in Q1 2024, but the company doesn't break out sales between FP Movement and Free People. There are some risks with the athleisure market, as brands face softening performance and consumers shift away from more discretionary apparel categories. FP movement has created core and in-demand silhouettes that drive traffic, but with fashion trends, that may not be enough to sustain long-term visit growth.
Finally, there’s the lackluster performance from the namesake brand. Younger adults have so many retail options at their fingertips that retailers who cater to these consumers can often be lost in the shuffle, especially with so much competition coming from online and offline retail. Urban Outfitters long curated a distinct look and feel, as well as a mix of national brands and private labels that differentiated it from competitors; with retailers in similar price bands like Abercrombie & Fitch staging a comeback, Urban Outfitters has lost its footing. Looking into the consumer segments using Spatial.ai’s PersonaLive, Educated Urbanites and Young Professionals top Urban Outfitters segmentation; price-sensitivity could be making younger shoppers more discerning in their apparel purchases. Off-price may also be a factor here and provide higher levels of competition for the customer base. Urban Outfitters holds a lot of brand value, and if the brand is able to right size assortments and value in the short term, there could be upside to bring it closer to its sister brands.
Compared to most of the specialty retail narratives out in the market, Urban Outfitters, Inc. has a lot of positive momentum with a few of its brands. Nuuly, its subscription rental service, was also called out as a positive highlight of the quarter, and learnings about consumer preferences through that service could help to inform the go-forward strategies at Anthropologie, Free People and Urban Outfitters. There is a lot to celebrate as it relates to its discretionary retail fleet, despite the challenges at the namesake brand, and proves that specialty retail that still feels “special” has consumers' lasting attention.
Earlier this week, we attended the National Restaurant Association show in Chicago and had the chance to speak with a wide range of restaurant owner/operators (large chains, small chains, independents, and franchisees) as well as their vendors, distributors, and other technology solutions. We’ve already seen some great recaps of the event (including one from Nation’s Restaurant News), but we thought we’d offer some of our own observations from the event.
Fierce Fight for Visits Amid New Sources of Competition
We discussed this during our trade show preview last week, but concerns about slowing foot traffic trends and increased competition with alternative food retail channels like grocery, dollar stores, and convenience stores was easily the number one topic of discussion at the event. Most operators we spoke with acknowledged flat or year-over-year declines in comparable visits, which is consistent with the year-to-date on most of the restaurant subcategories we monitor (below)
Most of the restaurant executives we spoke to at the event also noted the improvements of prepared food offerings in the grocery and c-store channels as a competitive headwind. One executive even told us that “C-stores have gone from copying QSR category innovations to setting the bar higher in many ways.” We’ve seen this in the channel shift taking place across the food retail category, which we touched upon last week.
As it pertains to competition in the months ahead, operators across all categories admitted that they were curious about the ripple effect of McDonald’s plans to launch a $5 value menu on June 25 (which will run for a month). We’re already starting to see competitors try to front-run McDonald’s $5 value menu, and there will likely be others who introduce similar promotions in the coming weeks. While these offers are likely to help QSR chains recapture some of the visits lost to other channels, these chains will likely need to continue with their value messaging in the back half of the year (especially with the rollbacks taking place at Walmart, Target, and other superstore chains) while also committing to more menu innovation than we’ve seen year-to-date.
Coffee’s Momentum Continues–With A Notable Outlier
One of the two subcategories that is seeing year-over-year increases is coffee. Some of this growth has been fueled by expansion plans of Dutch Bros, 7 Brew Coffee, 151 Coffee, Scooter’s Coffee, Philz Coffee, particularly in the South and Southeast U.S. (something we touched on late last year). Below, we’ve put together a custom chain of drive-thru focused chains versus the category average to put some context behind where the growth in the category is coming from (although the category itself as a whole continues to see healthy growth).
Starbucks–which reported a 7% decline in comparable transactions during its January-March 2024 quarter–is one of the key outliers from this category. Starbucks CEO Laxman Narasimhan called the company’s performance “disappointing” on its most recent update call. There have been no shortage of opinions on why the chain has underperformed, but our data continues to indicate that occasional visitors are the root of the softer visitation trends, much like they were last quarter. To reverse these trends, the company has already launched flavored pearls for a series of summer seasonal drinks and an improved blueberry muffin. Additionally, the company plans to launch more sugar-free customization options (including syrups) as well as a zero-to-low-calorie energy beverage.
Casual Dining’s Quiet Comeback
The other restaurant category posting seeing year-over-year growth may come as a surprise: casual-dining chains. After a slow start to the year due to weather, the category has generally seen low-single-digit growth on a year-over-year basis (something Placer’s blog team pointed out a few weeks ago). Several executives in the casual dining space we spoke with noted that they had started to see improving trends, with a few citing a narrowing price gap with QSR/fast casual chains (in other words, if consumers are going to pay the same price per entree, they’ll gravitate toward casual dining) as well as a continued propensity to spend for events/holidays (a theme we touched on repeatedly in the past).
Where is the growth coming from? There are a couple of expected categories, including steakhouses, breakfast-first concepts, and eatertainment. Asian concepts have also performed well this year, helped by growth from experiential concepts like Kura Sushi and GEN Korean BBQ.
On the other end of the spectrum, we see weakness in Mexican and Seafood concepts. Seafood should not come as a surprise given that one of other notable development in the restaurant industry this week was Red Lobster’s bankruptcy announcement. The company's Endless Shrimp promotion has been widely blamed for the company's bankruptcy filing--and our visitation data does show a spike in visits coinciding with the promotion--but there were certainly other factors such as unfavorable lease terms that played a part.
How shifting consumer priorities are reshaping value perceptions across QSR, fast casual, and casual chains.
July 9, 2026
The New Definition of Value
As consumer sentiment hovers near historic lows and the cost of goods remains elevated, value has become a defining theme across the dining industry. Yet within the sector's diverse restaurant categories – and for individual brands – the question is no longer whether consumers are seeking value, but what value actually means. A closer look at chains across the industry suggests that, amid ongoing economic pressure, perceptions of value are evolving. For some consumers, value may be tied to affordability and promotions; for others, it may come from quality, convenience, or experience. The result is a market with multiple paths to winning consumer traffic.
Dining Traffic Remains Unstable in 2026
After an uneven but largely resilient 2025, dining traffic in 2026 tipped into a sustained decline.
Monthly visits to the overall dining industry have trailed year-ago levels throughout 2026, with February standing as the lone exception. That month saw a 3.7% year-over-year (YoY) increase in visits, driven in part by comparisons to the period of initial tariff announcements in early 2025. But broader trends remained challenged, and May's 2.5% YoY decline marked the steepest monthly drop of the past twelve months as rising gas prices and weakening consumer sentiment appear to have added pressure to an industry already navigating a difficult environment.
Breaking Down the Industry
These headwinds, though, have not landed evenly. Across the dining sector, some segments have faced more intense pressure than others, with much of the divide coming down to how consumers are perceiving value against experience.
QSR’s Value Proposition Under Pressure From Grocery Stores & Superstores
Over the past several years, inflation and rising menu prices have gradually weakened a cost-based value proposition that has long been central to the QSR segment. More recently, elevated gas prices have added another deterrent, making a trip through the drive-thru a less compelling choice for some consumers.
Strong performance at grocery stores and superstores suggests that competition for share-of-stomach is increasingly extending beyond traditional restaurant rivals. With expanding selections of ready-to-eat and pre-prepared meals, these channels are offering consumers a combination of value, convenience, and quality that can increasingly match limited-service dining options. At the same time, ongoing pressure on household budgets appears to be driving more consumers toward lower-cost meals made at home, creating additional headwinds for the QSR segment.
Fine Dining and the Fast Casual Middle Hold Firm
Yet for many consumers, there is still a time and place for dining out, and in the face of mounting economic pressure, several dining formats have found foot traffic success. Fine dining has posted traffic growth in nearly every month of 2026, with March standing as the lone exception. That decline was likely influenced by a calendar shift, as March 2026 contained one fewer Saturday than March 2025 – a meaningful headwind for full-service restaurants given the outsized role weekends play in driving visits. The segment's sustained growth points to the resilience of higher-income consumers and the enduring appeal of premium, occasion-driven dining experiences.
Fast casual and casual dining have also proven relatively resilient. The fast casual category saw positive YoY foot traffic in every month of 2026 so far, while casual dining's performance has rebounded since the March calendar shift that likely weighed on YoY traffic. A second calendar shift in May 2026 led to an extra Saturday in the month, which likely helped the segment's overall trend. These trends suggest that both fast casual and casual dining occupy an increasingly attractive middle ground where value is defined as a combination of affordability and experience. At the same time, years of menu price hikes at QSR chains have altered the cost equation in fast casual and casual dining's favor, narrowing the price gap between fast food and more elevated dining formats. As that gap has narrowed, consumers may be placing greater emphasis on experience and quality when deciding where to dine.
Inside the Playbooks of Fast Casual Standouts
The balance between price and elevated experience has made fast casual a favorite for value in the dining industry in 2026. A closer look at two of the segment's largest players, CAVA, a relatively young concept, and Chipotle, a legacy chain navigating operational challenges, shows how brands can deliver on that value proposition in different ways and win in today’s dining landscape.
Chipotle Creates Value With LTO Experiences and Loyalty Perks
Chipotle's traffic trends in 2026 have improved compared to 2025, with the brand offering a clear example of how fast casual brands can create value by pairing menu innovation with loyalty perks.
Chipotle outpaced the broader fast casual category in YoY visits nearly every week of 2026 so far. And the graph below shows that the chain's strongest traffic gains tended to coincide with major menu launches and loyalty initiatives – a key component of its ongoing "Recipe for Growth" strategy.
The return of fan-favorite Chicken al Pastor in the week of February 9, 2026 helped drive a 16.6% YoY increase in visits. Two months later, the launch of "Rewards on Repeat" – a refreshed loyalty program offering freebies upon sign-up – generated the period's largest weekly traffic gain, with visits rising 18.2% YoY. And the introduction of Honey Chicken on April 28 provided another boost, as the chain continued to rotate limited-time protein offerings and give customers reasons to return.
These performance peaks suggest that Chipotle has been particularly effective at pairing menu novelty with loyalty perks to reinforce a value proposition anchored by quality and experience.
Chipotle's "Recipe for Growth" Drives Traffic With Loyalty and LTO Launches
Year-over-Year Change in Weekly Visits, Chipotle vs. Fast Casual, Jan.–Jun. 2026
ChipotleFast Casual
Dashed lines mark key Chipotle promotional launch dates. Week-of dates shown; launches may have occurred mid-week.
Share
Embed:
CAVA Expansion and Differentiated Dining Experience
If Chipotle illustrates the power of menu innovation and loyalty-driven engagement, CAVA highlights a different approach to creating value – one rooted in variety, customization, and a consistently differentiated dining experience.
CAVA's overall visits climbed well above 20% YoY in every month of 2026, a pace largely driven by aggressive unit expansion. Meanwhile, same-store visits, which measure traffic at locations open for at least twelve months, sustained positive YoY growth – evidence of genuine demand at existing restaurants alongside a rapidly growing footprint.
While Chipotle leans on limited-time offers, CAVA's growth rests on a consistent, customizable experience. A deep roster of proteins paired with a wide range of bases, dips, and toppings, gives the chain built-in variety that helps keep the concept feeling fresh. In addition, CAVA's Mediterranean-inspired menu offers flavors and combinations that are less easily replicated at home, helping the brand maintain a differentiated experiential value proposition and drive growth.
O Though Chipotle and CAVA are at different points in their evolution and have taken different paths to growth, both highlight the enduring appeal of fast casual's balance of value and quality. In a dining environment where consumers are increasingly weighing cost against experience, the segment's ability to deliver on both has helped make it one of the industry's strongest-performing formats.
Casual Chains Thrive On Everyday Value
Fast casual isn't the only dining segment benefiting from consumers' evolving perception of value. In 2026, several casual dining chains have found success by pairing accessible price points with the elevated experience of a sit-down meal.
Brands such as BJ's Restaurant & Brewhouse, Chili's Grill & Bar, Bonefish Grill, Cicis, and The Cheesecake Factory all posted positive YoY visit growth in multiple months this year, demonstrating that even in a challenging economic environment, diners are motivated when they feel they are getting more in return. These results are particularly notable given the impact of calendar shifts, which weighed on March 2026 comparisons – and provided a tailwind to May performance.
Unlike many fast casual chains, these brands have not relied heavily on a steady stream of limited-time offers to drive traffic. While menu innovation remains part of the playbook, promotions often serve as ticket builders or engagement tools rather than primary traffic catalysts. Instead, these successful casual dining chains have focused on creating everyday value that diners can depend on, narrowing the price gap between limited-service restaurants and full-service dining.
The result is a value equation that encompasses table service, a more relaxed dining environment, and a place to socialize or celebrate an occasion. In an environment where consumers are increasingly weighing cost against overall experience, that combination appears to be helping several casual dining chains maintain positive traffic momentum.
The State of Dining in 2026
Although dining traffic has softened in 2026, the industry's performance suggests that consumers have not stopped spending on restaurants altogether. Instead, they have become more selective about where they dine and what they expect in return.
Across segments, the strongest performers have found different ways to deliver value. For some brands, that means menu innovation, loyalty engagement, and differentiated experiences. For others, it means dependable affordability paired with the service and atmosphere of a sit-down meal. As economic pressures continue to shape consumer behavior, the data suggests that value is no longer defined by price alone, but by the balance of cost, convenience, quality, and experience.
Find out where Americans are moving in 2026, why they're relocating, and how developers, investors, and retailers can stay ahead of the trends.
June 18, 2026
The Geography of Domestic Migration
During the pandemic and its aftermath, Americans were on the move. Millions left expensive coastal markets for lower-cost destinations across the Sun Belt, while boomtowns such as Bozeman, Boise, and Austin struggled to keep pace with the influx of new residents.
That wave of relocation has since cooled, as return-to-office mandates, higher mortgage rates, and a shrinking affordability gap between coastal cities and many COVID-era hotspots have dampened the incentive to move. But even in a slower market, domestic migration remains one of the most powerful forces shaping local economies, housing markets, and consumer demand.
This report leverages AI-powered location analytics to examine the relocation patterns reshaping the United States in 2026 – where Americans are moving, the demographic and economic forces driving those decisions, and how retailers, investors, developers, and policymakers can respond to the opportunities and challenges created by these shifts.
Which major metros are attracting the most new residents? Which pandemic-era standouts have seen growth stall or reverse? And what factors best predict a large metro area's domestic migration growth potential in 2026?
Interstate Flows: Which States Gained and Lost Residents?
South Carolina and Delaware Set the Pace
The latest statewide migration data shows that the slower relocation pace observed in 2024 persisted into 2025. No state recorded net inflows or outflows exceeding 0.7% of its starting population. And while several smaller states continued to attract new residents at meaningful rates, none of the nation's six most populous states saw net in-migration exceed 0.2%.
Among those smaller states, South Carolina and Delaware led the nation with net in-migration equal to 0.7% of their populations, followed by Idaho (0.6%), Maine (0.5%), Tennessee (0.4%), and North Carolina (0.3%). For most of these states, migration accelerated relative to 2024, though Delaware's inflow rate moderated slightly and North Carolina held steady.
Despite their differences, these states tend to offer a similar mix of lifestyle amenities, relatively low congestion, and opportunities for growth. Many also benefit from business-friendly climates, favorable taxpolicies, or housing costs that remain attractive relative to the higher-cost markets from which they draw new residents.
Vermont Trails Behind
At the other end of the spectrum was Vermont, which saw the nation’s largest net outflow as share of population in 2025, losing 0.4% of its population to domestic relocation. The decline deepens a reversal that first emerged in 2024, when the state swung to a net loss of 0.2%, after attracting inflows of 0.8% and 0.5% in 2022 and 2023, respectively.
Vermont's reversal likely reflects a combination of factors, including return-to-office mandates and the waning appeal of remote work. Housing undersupply in the state may have alsocontributed, illustrating how important infrastructure investments are to sustaining migration gains over time.
South Carolina, Delaware, and Idaho Lead the Nation in Domestic Migration Growth in 2025
Net Domestic Migration as a Share of Each State's Starting Population, 2025
Net Migration by State
−0.4%0.0%0.7%
Top Migration Magnets
2024
2025
*Analysis for each year is from Jan. – Dec.
Share
Embed:
Florida Sees Accelerated Inflow as Legacy Exodus States Slow Losses
Among the nation's six most populous states, Florida was the only one to see accelerating net in-migration in 2025, attracting new residents equal to 0.2% of its starting population, up from 0.1% the year before. Texas, by contrast, slowed from 0.1% net in-migration in 2024 to essentially flat in 2025, highlighting the cooling of what was once one of the country's strongest pandemic-era migration magnets.
Meanwhile, the legacy "exodus" states continue to lose residents, but at a slower pace than in previous years. Illinois and California have seen their migration deficits steadily narrow, with further improvement in 2025. Between 2022 and 2025, Illinois moved from -0.8% → -0.2% → -0.2% → -0.1%, while California moved from -0.9% → -0.4% → -0.3% → -0.2%. And though New York has held steady at -0.2% over the past two years, this marks a significant moderation from 2022, when the state experienced net outmigration equal to 1.1% of its population.
Major Insights:
Smaller states dominated migration gains in 2025, led by South Carolina, Delaware, Idaho, Maine, Tennessee, and North Carolina.
Vermont posted the nation's largest outflow after attracting strong inflows just a few years earlier.
Florida was the only top-population state to see meaningful net in-migration in 2025.
Texas' migration boom continued to cool, with net in-migration falling to flat in 2025.
Outmigration from New York, Illinois, and California is slowing, but these states are still losing residents overall.
Zooming In: Net Migration Across Metro Boundaries
Statewide trends reveal important shifts, but a closer look at the nation's ten largest metropolitan areas suggests that broader interstate averages increasingly mask diverging local realities. Several metros are attracting residents through interstate domestic migration even when their states as a whole are experiencing little or no net migration growth.
Phoenix (+0.3%), for example, stood out as the nation's top-performing large metro in 2025, despite Arizona's absence from the list of leading migration destinations – with the majority of its inflow coming from out of state.
Dallas (+0.2%) ranked second, continuing its rebound from -0.1% in 2023 even as Texas' statewide migration gains cooled. Like Phoenix, Dallas drew a majority of its new residents from outside the state, underscoring its growing appeal as a national migration destination. Houston, meanwhile, moved in the opposite direction, falling from 0.1% net in-migration in 2023 to -0.1% in 2025. While it is too early to call this a sustained reversal, the divergence between the two metros may reflect Dallas's growing pull as a corporate magnet alongside rising housing costs and weather-related challenges in Houston.
Metro-level data also suggests that the pandemic-era "big-city exodus" narrative is continuing to fade. Los Angeles improved from -0.8% in 2023 to -0.3% in 2025, while New York held steady at -0.3% after improving in 2024. Even Miami (-0.6%), which ranked last among major metros despite Florida's continued statewide gains, saw its outflows moderate from 2023 levels. And while Illinois continued to post net outmigration, Chicago (0.0%) reached migration neutrality in 2025 after recording losses in both 2023 and 2024.
Major Insights:
Phoenix was the nation's top large-metro migration destination in 2025.
Dallas gained momentum while Houston lost ground, highlighting growing divergence within Texas.
Miami continued to post the largest outflows among major metros despite Florida's broader migration success.
The LosAngeles, Chicago, and the New York metro areas all saw migration losses ease.
Florida Dominates Large Metros
Despite Miami's struggles – and Florida’s relatively modest 0.2% inflow – a look beyond the top 10 large metros reveals that the Sunshine State is home to six of the nation's eight fastest-growing large metros nationwide.
Those top-performing metros, defined as CBSAs with 500K+ residents that added at least 0.8% of their population through net domestic migration over the past year, share a similar profile: lower housing costs, retiree appeal, suburban density, and an easy drive to a larger economic hub.
Much of the growth of these Florida metro areas, however, is being fueled from within Florida itself. While major out-of-state metros such as New York (6.1%) and Chicago (2.0%) remained important sources of new residents, nearly half of the net migration into Florida's top destination metros came from elsewhere in the state. In 2025, Miami (22.5%), Orlando (13.0%), Tampa (5.8%), and Naples (4.2%) together accounted for 45.5% of the net positive migration feeding these fast-growing markets.
Major Insights:
Mid-sized Florida metros dominate the national migration leaderboard.
Florida's migration pipeline is overwhelmingly driven by in-state movement.
The Affordability Factor
The migration flows feeding the nation’s fastest-growing large metros suggest that affordability remains a powerful driver of domestic relocation.
In 2025, seven of the eight top destination metros analyzed above had lower typical home values than their largest feeder markets. Lakeland–Winter Haven, FL, for example, had a typical home value of $313.4K in December 2024, compared with $404.9K in Orlando and $380.2K in Tampa – its two largest sources of net migration. Even North Port–Bradenton–Sarasota, FL – the most expensive Florida metro in this group – drew its largest share of net migration from the New York metro area, where home values are substantially higher.
The lone exception was Charleston–North Charleston, SC, whose largest source of net migration was Baltimore – a market with lower typical home values than the destination. Even in Charleston, however, affordability appears to have played a role. New York, a significantly more expensive market, ranked a close second in 2025, accounting for 6.5% of net positive migration into Charleston, just behind Baltimore’s 6.8%.
While housing costs are only one factor influencing migration decisions, the data suggests that households continue to gravitate toward markets where homeownership is comparatively more attainable than in the places they leave behind.
Most Top Migration Destinations Pull Residents From More Expensive Housing Markets
Typical Home Values* in Top Feeder Markets to Destination Hubs, 2025
Destination HubTop Feeder Market
*Typical home value based on Zillow Research’s Zillow Home Value Index (ZHVI) for Dec. 2024, immediately preceding the analyzed migration period (Jan.–Dec. 2025).
Share
Embed:
Major Insights:
Most high-growth metros attract residents from more expensive housing markets.
Relative affordability continues to be a primary driver of domestic migration.
Demographics Over Dollars
But as important as affordability is in explaining today’s domestic migration patterns, age appears to be an even stronger determinant of where people choose to relocate.
Among mid-sized and large metros (250K+ residents) experiencing significant population shifts – defined as gaining or losing at least 1.0% of their starting population through domestic migration over the past two years – households are increasingly moving toward older, more established communities.
The data reveals a clear negative relationship between migration performance and age differential – a metric calculated by subtracting the median age of the destination market from the weighted median age of its feeder markets. Negative values indicate movement toward older communities, while positive values indicate movement toward younger ones. In other words, the metros attracting the strongest migration inflows tend to be older than the markets sending them residents.
The data also shows a clear positive relationship between migration performance and retiree concentration. Metros with larger shares of residents aged 65 and older generally saw stronger migration gains over the past two years, while younger metros tended to attract fewer newcomers. This suggests that retiree-driven relocation has become an increasingly important driver of migration. At the same time, the influx of younger residents points to the broader appeal of these communities, which offer a mix of affordability, amenities, and lifestyle advantages.
Relocators are Gravitating Towards Older, More Established Communities – With Retirees Helping Fuel the Trend
Net Migration as Share of Starting Population, 2024–2025*
Net Migration vs. Weighted Age Differential
Net Migration vs. Share of Residents 65+
*Analysis includes metro areas with 250K+ residents and domestic migration gains or losses of at least 1.0% during the study period. Weighted Age Differential compares the destination market’s median age with the weighted median age of origin markets, with positive values indicating migration toward younger markets and negative values indicating migration toward older markets. Age data: Census ACS 2020–2024.
Share
Embed:
Major Insights:
People are moving to older, more established communities.
Markets with larger 65+ populations are attracting more domestic relocators.
The New Migration Map: Strategic Implications
The pandemic-era urban exodus is giving way to a more nuanced migration landscape. Large urban markets are stabilizing, while growth is increasingly concentrated in smaller states, secondary metros, and intra-state corridors. Affordability remains a powerful pull, but retirees, lifestyle considerations, and local market dynamics are also playing an increasingly important role in where Americans choose to live.
To capitalize on these shifts in 2026, civic leaders, commercial real estate (CRE) investors, retailers, and developers should:
Monitor smaller states gaining migration momentum. Among the nation's most populous states, only Florida saw (modest) net in-migration in 2025. By contrast, smaller states like South Carolina, Delaware, Idaho, Maine, Tennessee, and North Carolina continued to attract substantial inflow. Investors, retailers, and developers that monitor these patterns may be better positioned to identify emerging growth opportunities.
Invest ahead of growth. Vermont's reversal shows how important it is for housing supply and infrastructure to keep pace with demand. High-growth communities will also need the retail, healthcare, transportation, and service capacity required to support expanding populations.
Look beyond state-level narratives that can obscure local opportunities. Florida led the nation in fast-growing large metros even as Miami lost residents, while Texas saw Dallas gain momentum as Houston fell behind. Likewise, although Arizona was not a top destination state, Phoenix remained the nation's leading major metro for migration gains.
Treat states as migration ecosystems. In Florida, for example, domestic migration is increasingly redistributed across a network of interconnected metros – as costs rise in one market, residents shift to nearby alternatives. Tracking these spillover effects can help identify tomorrow's growth markets before they show up in the rankings.
Don't write off major urban markets. While New York, Los Angeles, and Miami continue to experience net outflows – and Chicago has yet to return to positive territory – migration losses have moderated substantially from their pandemic-era peaks. As these markets stabilize, investments in livability, affordability, and quality of life could help strengthen their long-term competitiveness and economic vitality.
Protect affordability as a competitive advantage. Across the nation's fastest-growing metros, migration flows continue to move from more expensive housing markets to less expensive ones. As demand rises, preserving attainable housing will be critical to maintaining the cost advantages that attract new residents and businesses.
Prepare for a retiree-driven demographic realignment. Older Americans are playing an outsized role in shaping domestic migration patterns, but the communities attracting them are increasingly appealing to a broader range of households as well. As these markets grow, demand is likely to increase for healthcare, recreation, hospitality, and housing, creating opportunities across a wide range of sectors.
Explore key signals guiding data-driven site selection from brands actively expanding their brick-and-mortar footprints.
May 21, 2026
Predicting The Next Best Location
Across segments, retail and dining expansions converge on a common set of priorities, including identifying markets with strong demand, ensuring alignment with target audiences, and leveraging local consumer behavior to drive synergy. Using AI-powered location intelligence, we analyzed five expanding brands and segments to uncover the core principles driving successful site selection.
1. Identifying Sustainable Growth in an Increasingly Saturated Market
Nationwide visits to coffee chains are up in 2026, with established brands and newcomers alike seeing their traffic increase as consumer headwinds lead some to shift their discretionary spend towards more affordable indulgences. But past visit growth does not necessarily indicate future opportunity – it may instead signal market saturation. Relying solely on overall visit trends to guide expansion could lead chains into highly competitive markets where existing supply already meets demand.
For example, analyzing traffic trends in 10 major metro areas where coffee visits increased year-over-year (YoY) in Q1 2026 reveals significant gaps between overall traffic trends and per-location demand. In some CBSAs, overall traffic growth significantly outpaced per-location traffic trends – suggesting that supply is already meeting (or exceeding) demand and limiting room for new coffee locations despite overall category growth. But in other metro areas, where overall visit growth appears smaller, per-location traffic is actually booming – indicating that the underlying demand is resilient enough to support additional coffee concepts.
These patterns highlight the importance of looking beyond topline growth to identify where true whitespace still exists.
Strategic Takeaways:
Relying solely on aggregate category performance can obscure regional white space. A market-level view may reveal opportunities for stronger returns in areas where consumer demand is gaining momentum.
Combining overall visit and visits per location data offers a more complete view of where demand is both strong and sustainable.
2. Ensuring Demographic Alignment on the Hyperlocal Level
Effective site selection matches both regional and local demographics to a brand’s target customer, supporting performance and reinforcing positioning. But even in well-aligned metros, results depend on site-level precision – locations where the trade area visitor profile most closely reflects the brand’s core audience are best positioned to drive incremental upside.
An analysis of Alo locations in the DC area suggests that the company is adopting this strategy. Within the already high-income metro area of Washington-Arlington-Alexandria, individual Alo Yoga stores are placed in centers that draw even more affluent visitors – maximizing the revenue potential of each location.
In fact, Alo's newest stores in the metro area – One Loudoun and Bethesda Row – drive traffic from households with higher median incomes than even the established area locations. This signals a clear focus on premium retail corridors and affluent consumer segments, which reinforces the brand’s positioning while capturing higher-spending customers at the site level.
Strategic Takeaways:
Beyond traffic potential, effective site selection requires a clear understanding of both regional and hyperlocal demographics, as well as the brand’s target audience.
As brands expand, aligning locations with core customer bases can drive success while reinforcing brand positioning.
3. Finding Retail Nodes With Complementary Visitation Patterns
Beyond driving traffic potential and demographic alignment, site selection should also ensure that a brand’s identity and operating model are well matched to the visitation patterns of prospective locations. Barnes & Noble offers a clear example. The company’s ongoing resurgence has relied in part on repositioning itself as a local cultural and social hub, with a stronger emphasis on local curation and community-driven events.
And analyzing Barnes & Noble’s 2026 openings shows a clear tilt toward centers with a higher share of local traffic than the chain average – supporting its shift away from a purely transactional retail model toward a more community-centric experience built around local curation, events, and repeat visitation. By prioritizing locally driven centers, the company’s site selection strategy not only captures relevant traffic but also reinforces its broader repositioning as a neighborhood-oriented brand.
Strategic Takeaways:
Site selection strategy should look to align a brand’s identity and operating model with real-world visitation patterns at prospective locations.
For brands leaning into local curation, choosing centers with predominantly nearby visitors may be the key to performance and preserving brand identity.
4. Understanding the Benefits of Competitor Proximity
Effective site selection recognizes that proximity to competitors can function as a demand driver, amplifying traffic rather than diluting it.
In practice, this often takes the form of clustering – deliberately locating near similar or complementary concepts to capture shared demand. Shake Shack provides a clear example. Analyzing the chain's store fleet shows that many locations sit near other QSR and fast-casual concepts, creating opportunities to capture dining-based traffic. At the same time, strong cross-visitation patterns indicate that these co-located brands share a common customer base, positioning the brand closer to consumers who are already likely to visit. And, at least for Shake Shack, this strategy appears to be working – traffic to the chain increased 19.9% YoY in Q1 2026.
Strategic Takeaways:
As in retail, co-tenancy in the restaurant space can be mutually beneficial – establishing a center as a dining destination, driving incremental traffic, and increasing a brand’s opportunities to win share-of-stomach.
Incorporating cross-visitation analysis into site selection helps pinpoint locations where target customers are already visiting nearby brands. Centers that already attract a brand’s overlapping customer base provide a stronger foundation for incremental growth.
5. Balancing Growth and Cannibalization Risk
Incorporating trade area analysis into site selection can also help determine whether a new location will generate new traffic or risk cannibalizing existing demand. Aldi, a rapidly expanding grocery chain, offers a relevant example.
The company opened a fourth Las Vegas store on S Decatur Blvd in October 2025, positioned between existing locations on W Craig Rd and S Rainbow Blvd, approximately eight miles from each. And analyzing the core trade area of each of the four Las Vegas locations indicated limited visitor cannibalization over the last six months, despite the stores’ close proximity. Only 6.2% and 7.6% of the S Decatur Blvd store’s trade area overlapped with the W Craig Rd and S Rainbow Blvd stores’ trade areas, respectively.
These findings show that there is no one-size-fits-all approach to store spacing – it varies by brand, category, and market. Analyzing a company’s existing store network alongside competitor density and overall demand can help determine how closely locations can be placed without hurting performance. In many cases – especially in high-frequency categories like grocery – markets can support stores that are closer together than expected.
Strategic Takeaways:
Site selection strategy needs to take into account local demand and visitation behavior typical of the category as a whole and of existing locations in particular.
Trade area analysis can reveal where a market allows for network densification without significant risk of visit cannibalization.


.svg)


.avif)


