While Boston trails both the New York City and Nationwide Office Building Index in return-to-office rates, one standout related to office activity is the Newbury Street location of the Dutch brand Suitsupply. Visitation to this location saw steady growth from February to August this year.
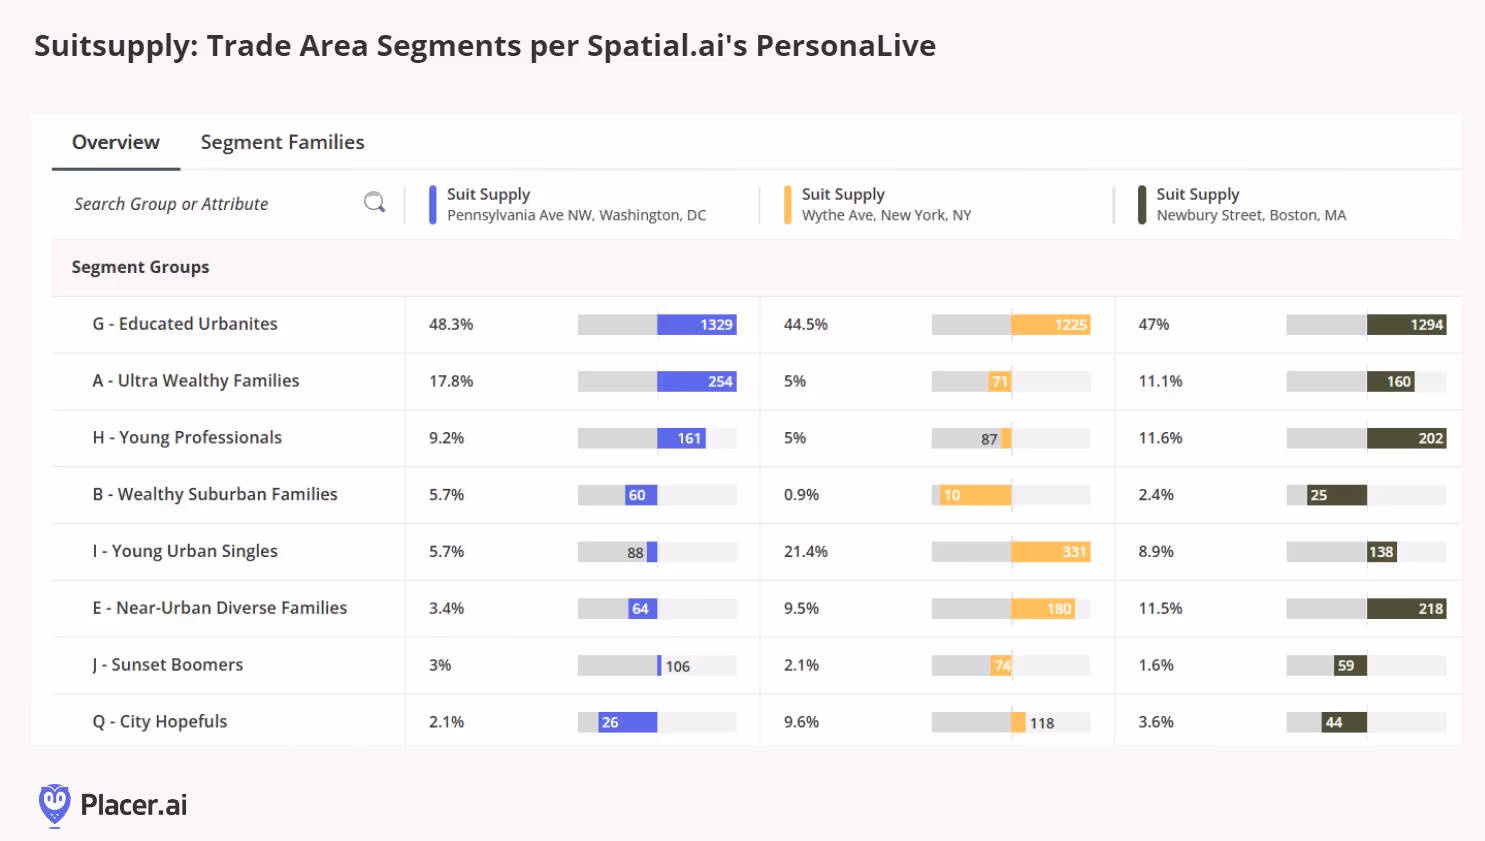
When examining the three East Coast cities in the chart—Washington, D.C., New York, and Boston—Educated Urbanites make up nearly half of Suitsupply's trade area, according to Spatial.ai’s PersonaLive data. In Boston specifically, there are also high indices for Near Urban Diverse Families and Young Professionals.
Both the Newbury St and Washington, DC Suitsupply locations saw the greatest gains compared to the prior year.
What might explain the gains in Boston? We have a few theories. First, Boston is a city where nearly a quarter of the population consists of students. The steady growth at the Newbury Street location from February to August could reflect students preparing for spring interviews, purchasing suits for summer internships, and later for weddings in late summer and early fall. Notably, a previous Anchor article highlighted that fall has become the most popular time of year for weddings. Additionally, the strong cohort of students and young professionals in their 20s and 30s may find the office environment particularly beneficial for camaraderie and mentorship. This group is also more likely to seek out—or at least be less resistant to—returning to the office compared to millennials and Gen X.
On a lighter note, there could be something lucky about this store, as it was the 100th location opened by the Amsterdam-based brand. From a quantitative perspective, year-over-year traffic to Newbury Street has increased over the past six months, with notable growth in June and August.
The importance of visual merchandising and the customer experience cannot be overlooked. A unique feature of Suitsupply is its in-store tailoring, often showcased prominently in the front window. This not only provides engaging "retail theater" but also reassures customers of the craftsmanship behind their suits. Some shoppers have even been drawn into the store out of curiosity sparked by seeing an artisan at work. Online reviews for the Boston location highlight customers' appreciation for attentive service, reasonable prices, meticulous attention to detail, and outstanding tailoring.
This week, we attended the Restaurant Finance & Development Conference (RFDC)in Las Vegas, a gathering of industry leaders including senior executives, real estate professionals, franchise groups, investors, and analysts. Similar to insights from last month’s Fast Casual Executive Summit, many operators acknowledged that 2024 has been a challenging year but expressed cautious optimism as they look ahead to 2025.
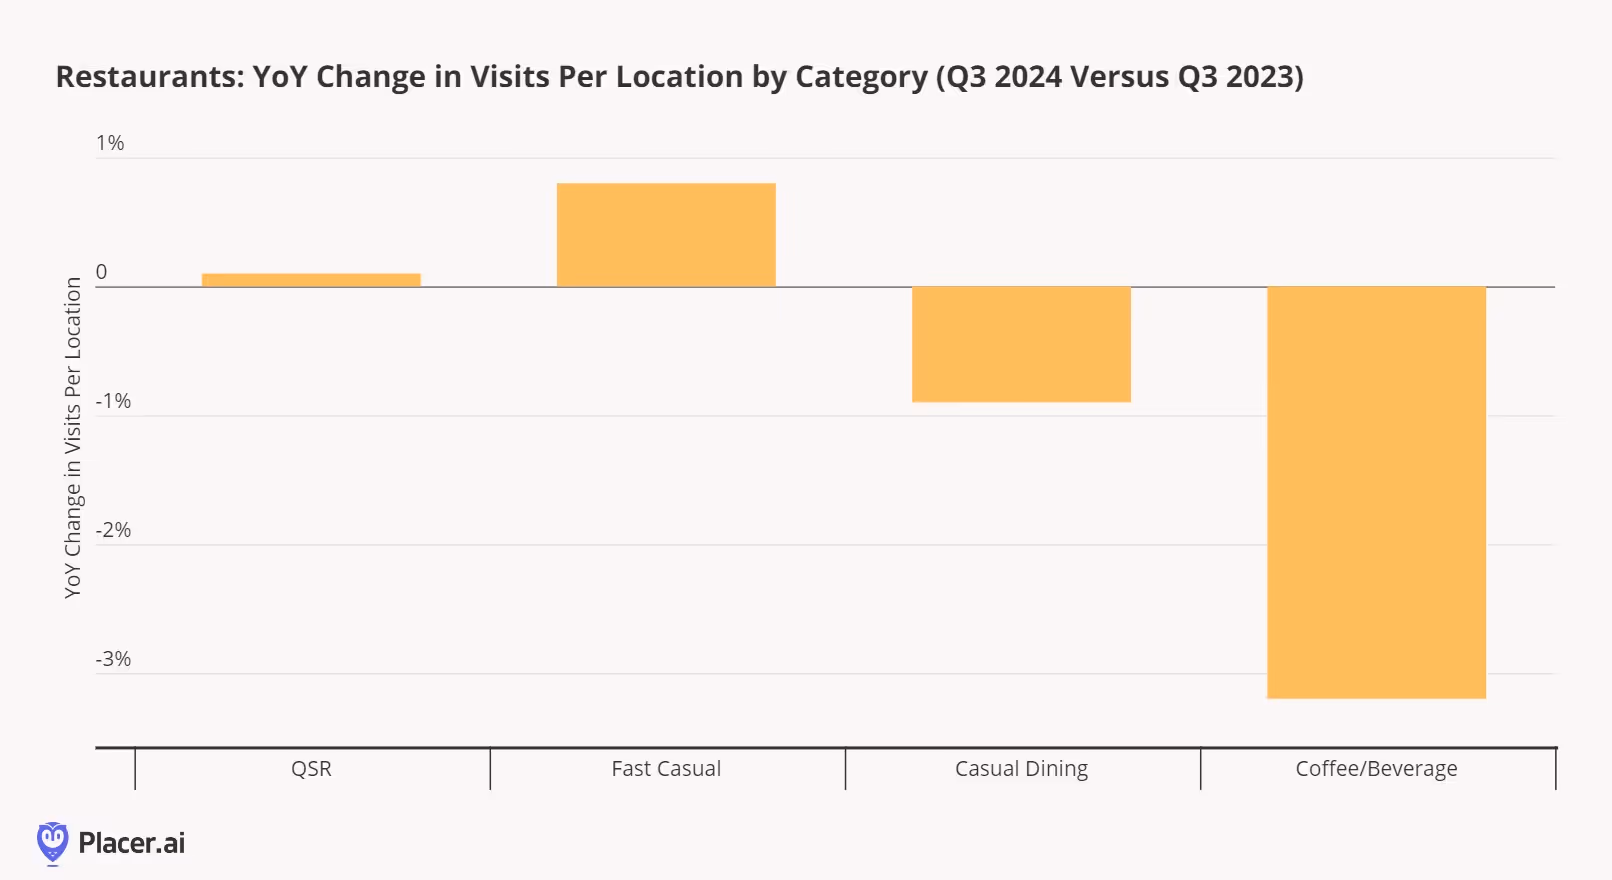
Restaurant operators have faced numerous headwinds this year, including inconsistent weather, heightened promotional activity across all tiers, increased competition from other food retail channels, elevated labor costs and shortages, and unfavorable lease terms contributing to a rise in bankruptcies. In Q3 2024, most restaurant chains experienced flat or declining visit-per-location trends, as shown below.
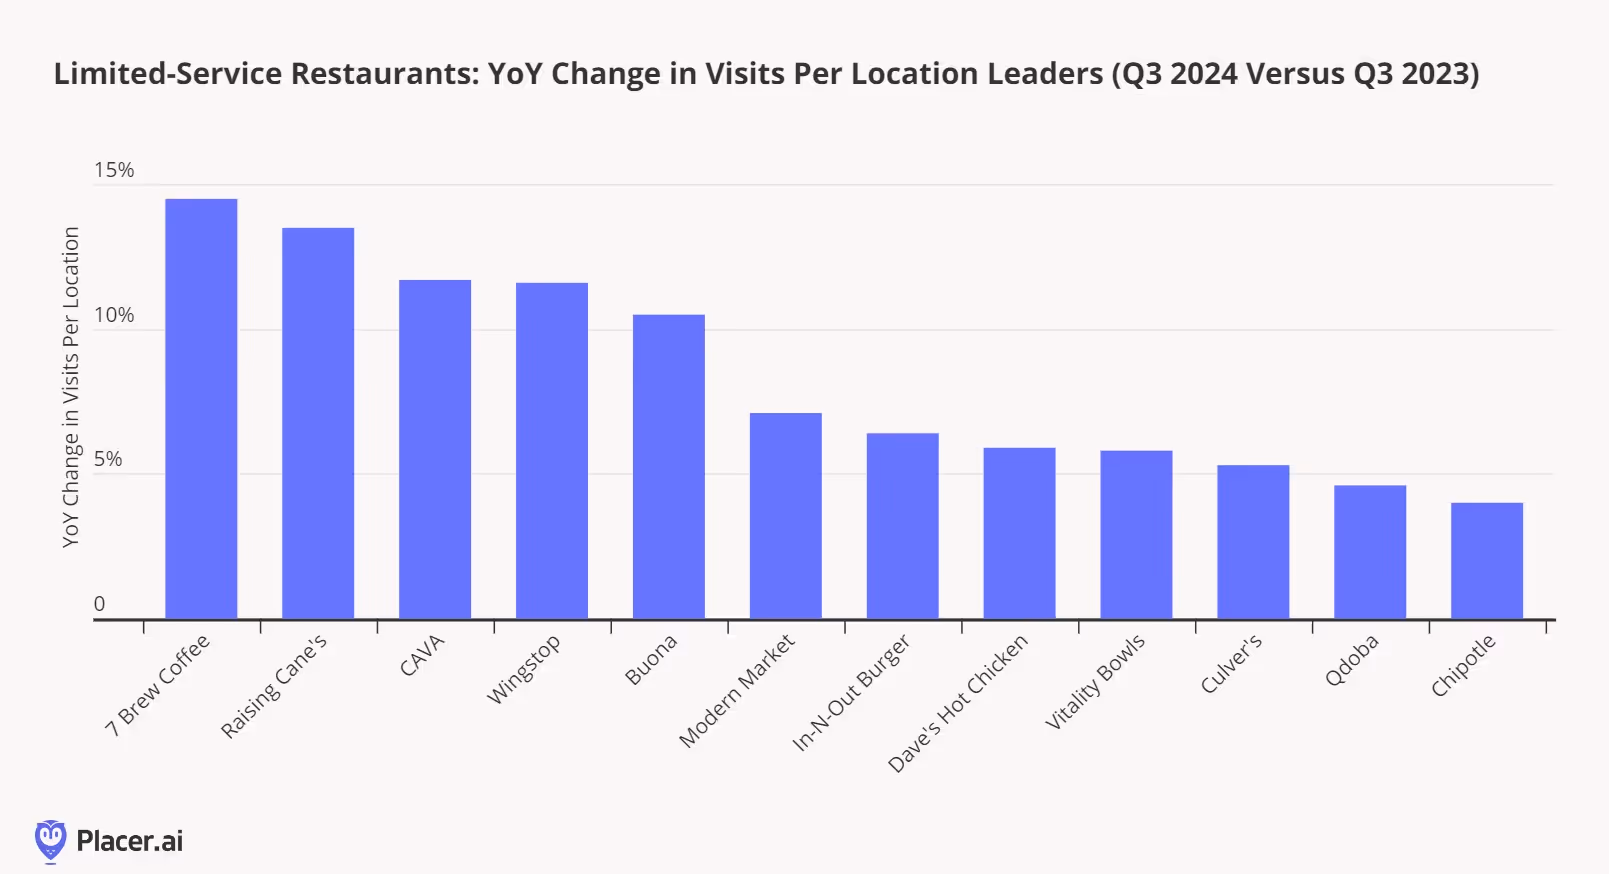
Still, some chains managed to achieve impressive growth in visitation per location this past quarter. Below, we highlight the top-performing limited-service restaurant chains (including QSR, fast casual, and coffee/beverage categories with more than 20 units) based on year-over-year visitation per location during Q3 2024.
The most striking takeaway from this chart is that these standout restaurant chains largely avoided the "value wars" seen across the industry this year. Instead, they leaned on menu innovation—chains like CAVA, Chipotle, and Wingstop introduced new offerings that didn’t overly complicate preparation—and operational excellence, particularly in drive-thru efficiency, with leaders such as 7 Brew, Raising Cane’s, In-N-Out, and Culver’s driving visit growth.
Reflecting on the success of these chains, it’s unsurprising that a major theme among restaurant operators at the RFDC event was maximizing returns from existing locations rather than prioritizing unit expansion in 2025. Many chains emphasized improving operations, including simplifying menus to boost throughput while still allowing limited-time offers to drive demand. Others highlighted technology-driven solutions, such as automated make lines and AI-powered voice ordering for drive-thrus. Additionally, executives explored alternative strategies to enhance unit-level returns, including expanded catering services and leveraging retail media opportunities.
What else is on restaurant operators’ minds as we look ahead to 2025?
Restaurant value wars not going away in the first half of 2025. Despite a renewed focus on optimizing menus and operations, restaurant value wars are not disappearing anytime soon—at least not in the first half of 2025. Chili’s reported a 14.1% growth in comparable sales during the July-September 2024 quarter, driven by its popular "3 for Me" value campaign, with transaction growth of 6.5% and a 10.1% rise in visits per location according to Placer data. Other casual dining operators are responding with similar value-driven promotions, such as Applebee’s “Really BIG Meal Deal” and Red Robin’s “$10 Gourmet Cheeseburger Deal.” Meanwhile, McDonald’s is extending its $5 Meal Deal into December, signaling that other QSR chains will likely follow suit with bundled value offerings into next year.
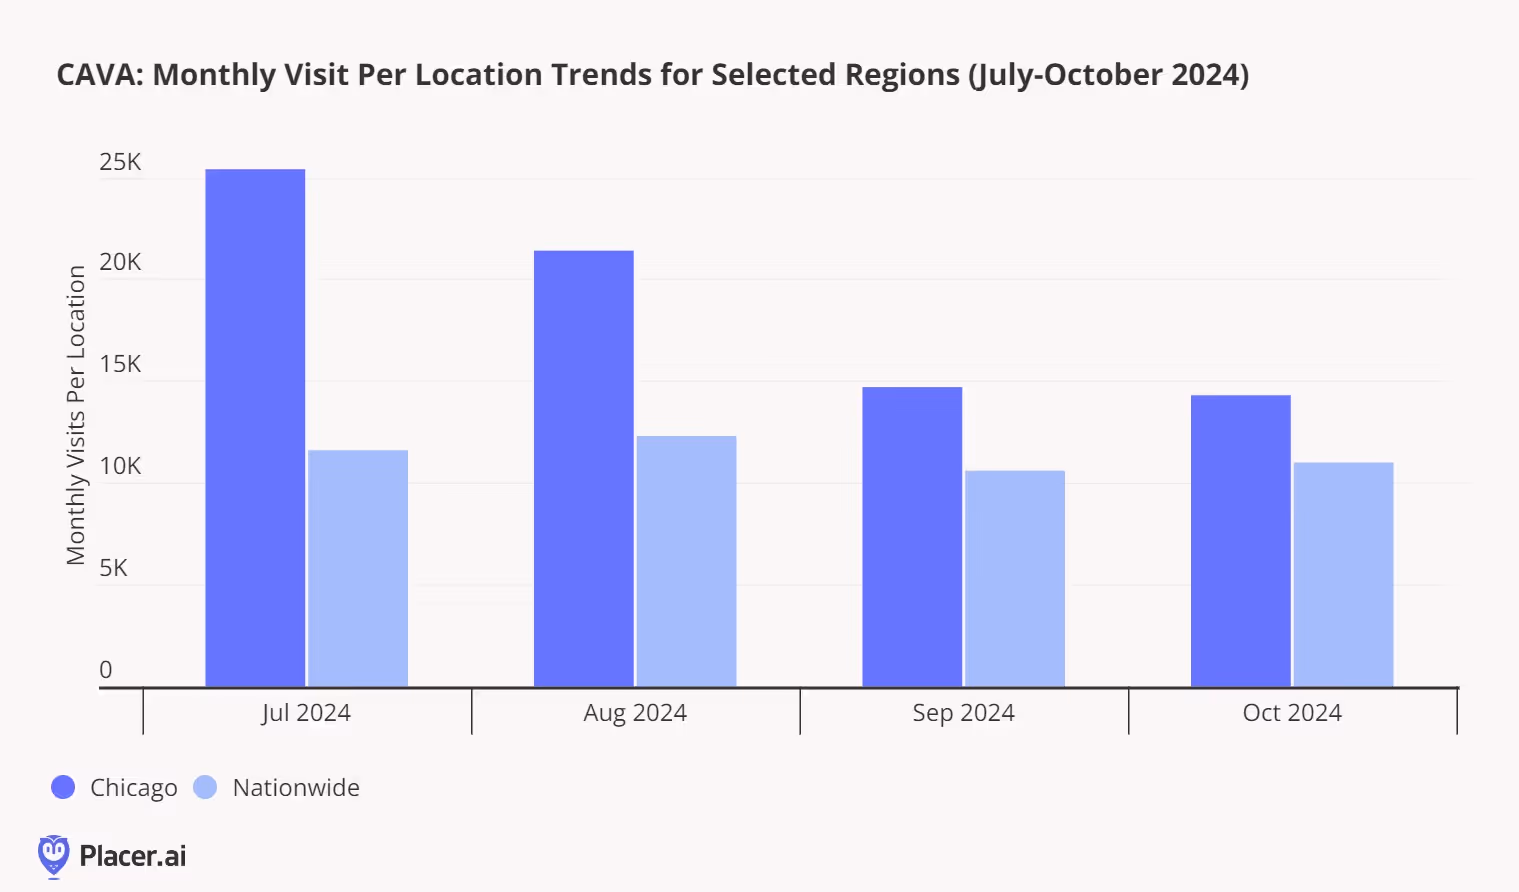
CAVA's continued momentum. CAVA’s remarkable performance also stood out--something Placer's blog team recently highlighted--including an 18.1% increase in same-restaurant sales during Q3 2024, bolstered by 12.9% transaction growth. As the chain diversifies its visitor base and boosts visits per location, it has effectively managed increased demand through innovations such as Garlic Ranch Pita Chips, a refreshed loyalty program, seasonal menu additions, and its "Project Soul" store format—which emphasizes human connection with softer seating, greenery, and a warmer design palette. CAVA’s successful market entry into Chicago further underscores its growth potential. Notably, the chain's visit-per-location trends in Chicago remain ahead of nationwide trends, positioning it for success as it plans to enter South Florida and additional Midwest markets. At a time when many early-stage restaurant chains struggle with expansion, CAVA’s results showcase its operational strength and ability to capture new market opportunities.
Starbucks turnaround in focus. Starbucks' turnaround efforts were a frequent topic at this year’s RFDC show. The chain recently debuted new TV ads, reminiscent of Starbucks CEO Brian Niccol’s successful turnaround playbook during his time at Chipotle. Niccol’s strategy to enhance the customer experience, reduce bottlenecks and operational complexities, and refine the Mobile Order and Pay system remains promising but will require time to take full effect. Expect further menu updates in early 2025, including a more streamlined offering—beyond the already announced discontinuation of the olive-oil-infused Oleato drinks.
The festive season is upon us, making it the perfect time to focus on a retail category that truly shines in Q4 2024: gifting, books, and paper. Despite the digital age, consumers continue to show a strong preference for shopping for these items in-store and still value tangible versions of these products. However, as discretionary retail faces challenges in meeting consumer expectations, has this category managed to capture consumer excitement and deliver delight amidst competing distractions and purchase priorities?
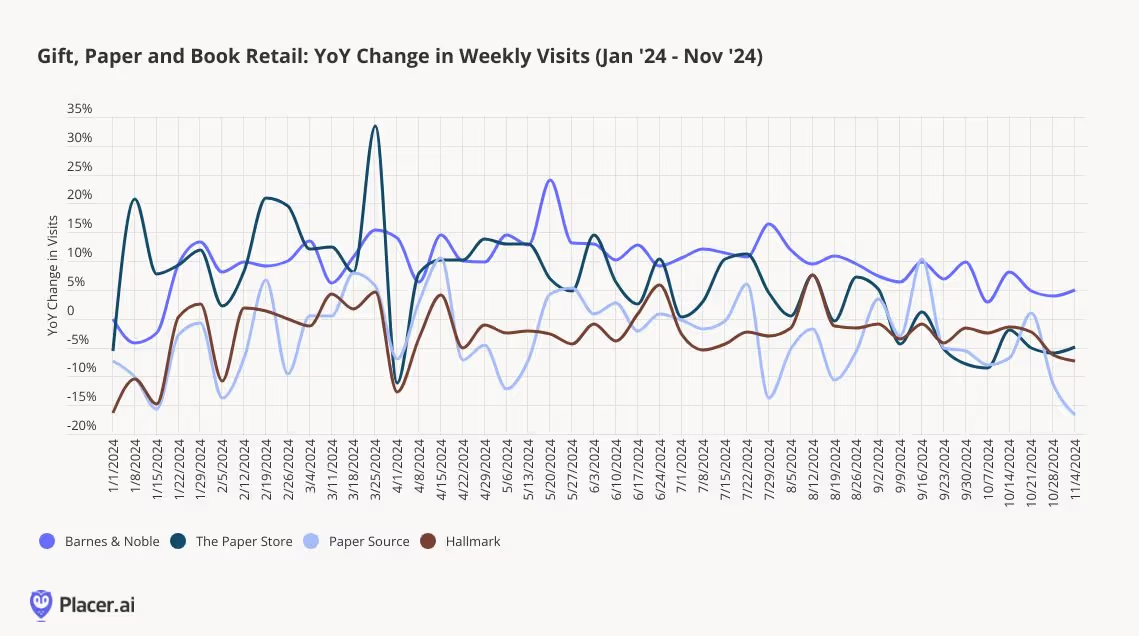
The book, paper, and gift market has experienced mixed performance among retailers this year, but even those facing year-over-year traffic declines have opportunities to improve. Barnes & Noble continues to set the standard, particularly in a category that was among the first to face e-commerce disruption; compared to 2019, visits are up 7% in 2024 despite a smaller store footprint. Paper Source is down 2% year-over-year in visits but is maintaining trends consistent with 2023. Similarly, Hallmark stores have seen a 2% decline in traffic year-to-date, though this aligns with a 5% reduction in store count. Notably, The Paper Store, a Northeastern chain of Hallmark Gold Crown stores, has outperformed the broader Hallmark brand by positioning itself more as a gift-first retailer, with cards and stationery playing a secondary role.
The book, paper, and gift market has experienced mixed performance among retailers this year, but even those facing year-over-year traffic declines have opportunities to improve. Barnes & Noble continues to set the standard, particularly in a category that was among the first to face e-commerce disruption; compared to 2019, visits are up 7% in 2024 despite a smaller store footprint. Paper Source is down 2% year-over-year in visits but is maintaining trends consistent with 2023. Similarly, Hallmark stores have seen a 2% decline in traffic year-to-date, though this aligns with a 5% reduction in store count. Notably, The Paper Store, a Northeastern chain of Hallmark Gold Crown stores, has outperformed the broader Hallmark brand by positioning itself more as a gift-first retailer, with cards and stationery playing a secondary role.
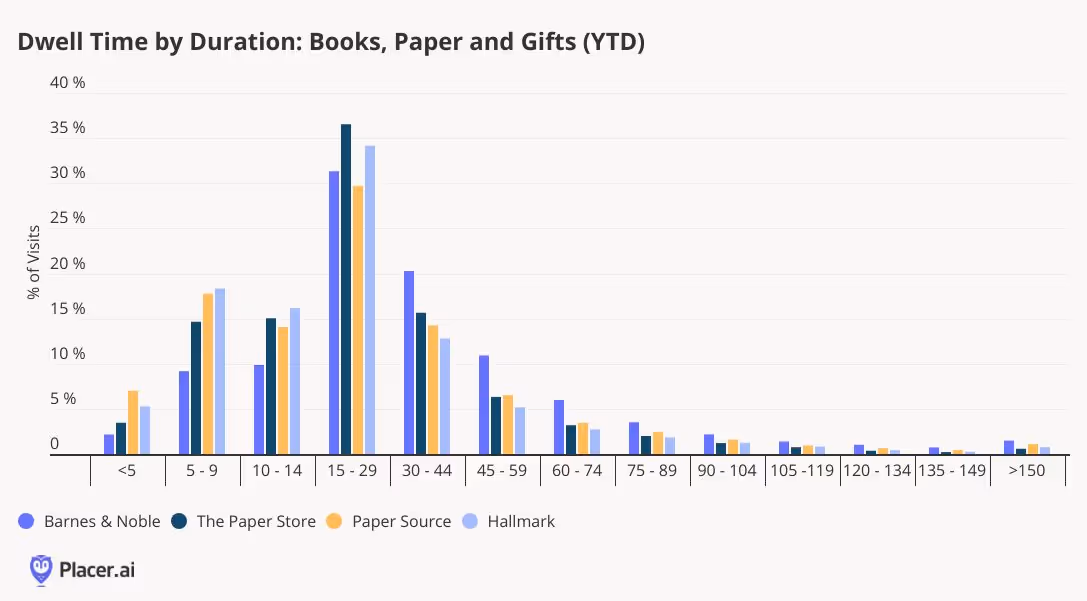
Barnes & Noble's consistent and sustainable traffic growth can be attributed to several successful initiatives. The retailer has expanded its product categories, doubled down on gifting, strengthened its position as a third space, and tapped into consumers' enduring love for books—all of which have set it apart in a challenging discretionary retail landscape. The effectiveness of these efforts is reflected in the chain's dwell time, which averages 37 minutes—nearly 10 minutes longer than any of the other chains reviewed—and excels at keeping visitors in-store for over 30 minutes.
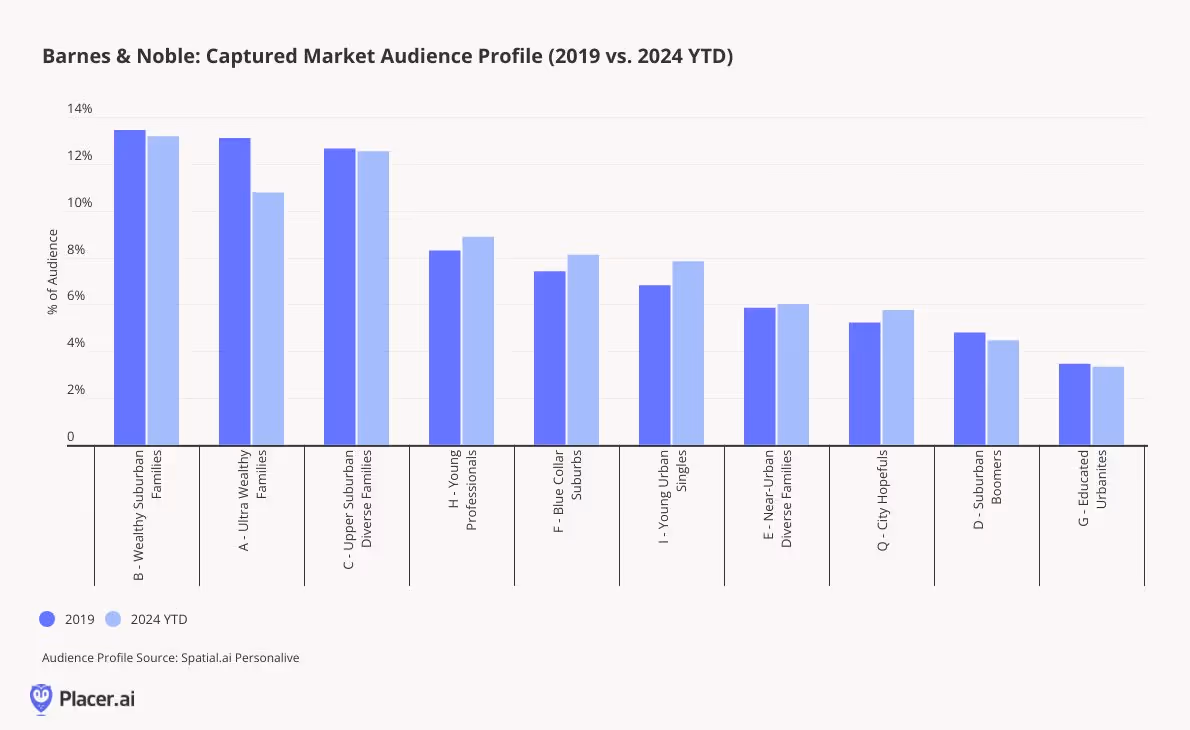
Barnes & Noble has done an impressive job of evolving its visitor demographics over time, particularly in the face of the digital revolution and the disruption of the book category. The success of specialty retailers often reflects broader cultural movements and shifts in consumer preferences, and Barnes & Noble is no exception. According to PersonaLive customer segments, the chain has significantly increased its penetration of younger consumer segments, such as Young Professionals and Young Urban Singles, when comparing 2024 year-to-date with 2019. Factors contributing to this trend could include the rise of book club culture among younger cohorts, the appeal of working from the in-store café, and an expanded assortment of gifts and paper products for special occasions.
This focus on younger consumers seems to be paying off. In 2024, 6% of Barnes & Noble visitors also shopped at a Hallmark location, although only 1% visited Paper Source, its sister brand. The integration of Paper Source shop-in-shops within Barnes & Noble locations may be cannibalizing cross-visitation between the two standalone chains.
As for Paper Source, it shares many of the elements driving Barnes & Noble's success but faces challenges in fully unlocking its potential. One key differentiator is its invitation business, but as consumers increasingly turn to digital platforms like Facebook or Paperless Post for invitations, even the booming wedding market hasn’t been enough to significantly drive growth.
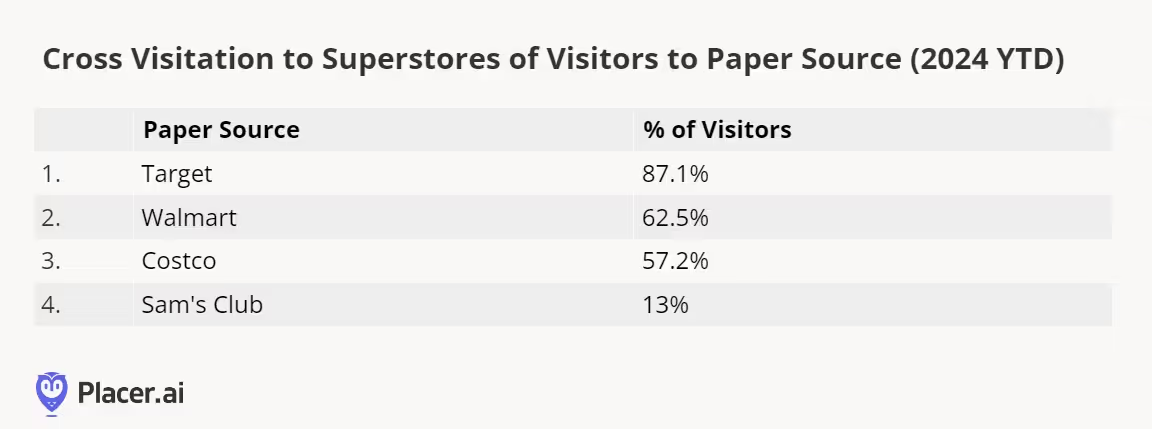
A significant challenge for Paper Source comes from competition within the superstore category. This year, 87% of Paper Source visitors also shopped at Target, and 63% visited Walmart. Both retailers have invested heavily in expanding their party supplies, cards, and gifting assortments, making it more convenient for shoppers to purchase these items during a single trip, rather than visiting a separate specialty store.
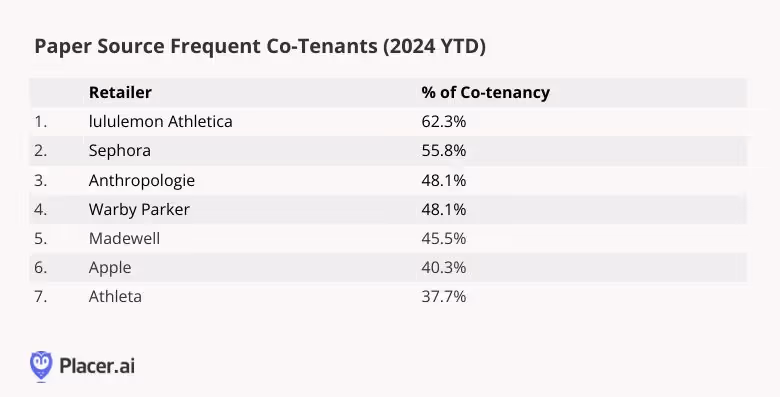
Paper Source has a strong demographic foundation to build upon as it works toward stabilization. According to PersonaLive, the chain significantly outperforms Barnes & Noble in visitation percentages among Ultra Wealthy Families, Young Professionals, and Educated Urbanites, with Ultra Wealthy Families accounting for nearly a quarter of its visitors. Its frequent co-tenants reflect similar socio-economic patterns, aligning with successful specialty chains that appeal to wealthier shoppers, such as lululemon, Sephora, Anthropologie, Warby Parker, Madewell, and Apple. With these favorable dynamics in place, Paper Source has an opportunity to thrive—success may depend on effective messaging and marketing to this affluent customer base.
The differences between Hallmark stores and The Paper Store highlight contrasting strategies: one chain has successfully expanded its product offerings to capture a more engaged audience, while the other remains closely tied to the traditional paper category and has struggled to do the same. There is little overlap in visitation between the two chains, suggesting that consumers may perceive The Paper Store as entirely separate from Hallmark, despite its status as a Gold Crown retailer.
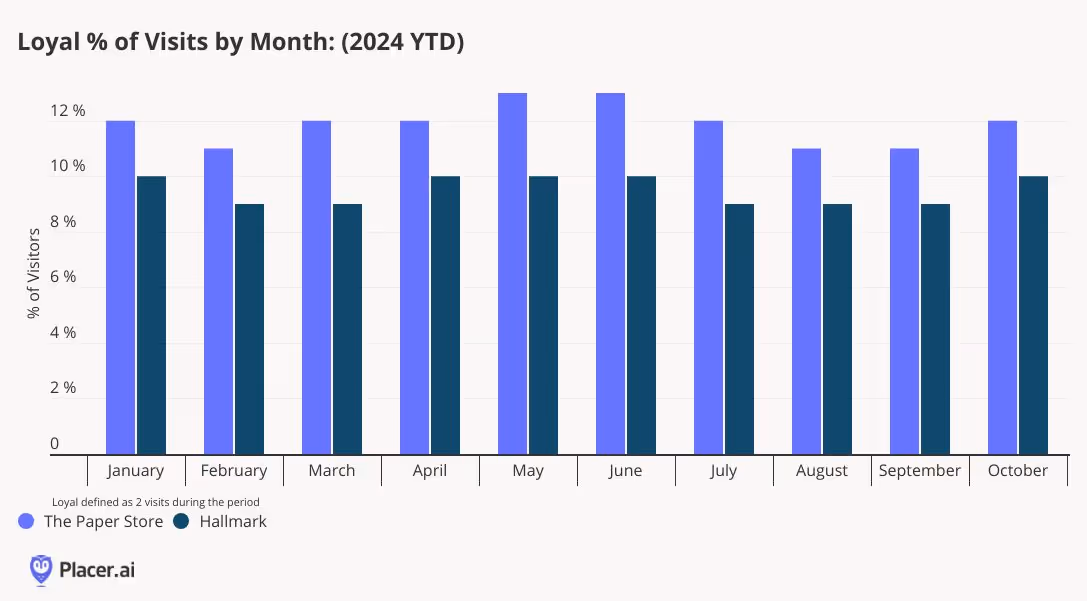
The Paper Store’s elevated and expanded assortment has fostered stronger loyalty among its visitors compared to the Hallmark chain. In 2024, loyal visitors—defined as those visiting twice per month—accounted for 12% of The Paper Store’s visitors, 2 percentage points higher than Hallmark. Additionally, The Paper Store serves more as a destination, with 37% of visitors heading home afterward, also 2 points higher than Hallmark. By expanding its product categories and curating localized selections, The Paper Store has successfully differentiated itself from the traditional Hallmark model, a strategy that could benefit the national chain as well.
The gifting, book, and paper retail category demonstrates varied consumer behavior across chains. The success of Barnes & Noble and The Paper Store underscores the importance of expanding product assortments to attract visits, as consumers increasingly seek convenience by consolidating their purchases in fewer trips. While consumers may tolerate more frequent visits for essential retail, in specialty retail, convenience and variety are critical. The category’s overall resilience suggests that consumers still have discretionary spending power for the right products at the right time, offering hope for retailers still refining their approach.
Has consumer demand for sporting goods and sportswear maintained itself, or is interest waning? We dive into the data to find out.
Shira Petrack
Nov 14, 2024
3 minutes
The sporting goods and sportswear category has had a rough couple of months. Two mainstays in the space – Bob’s Stores and Eastern Mountain Sports – filed for bankruptcy in June, and several sportswear and athleisure leaders posted disappointing results. So is the consumer demand for leggings and sneakers waning? Or is the category merely facing a temporary slowdown? We dove into the data to find out.
Lululemon in the Lead
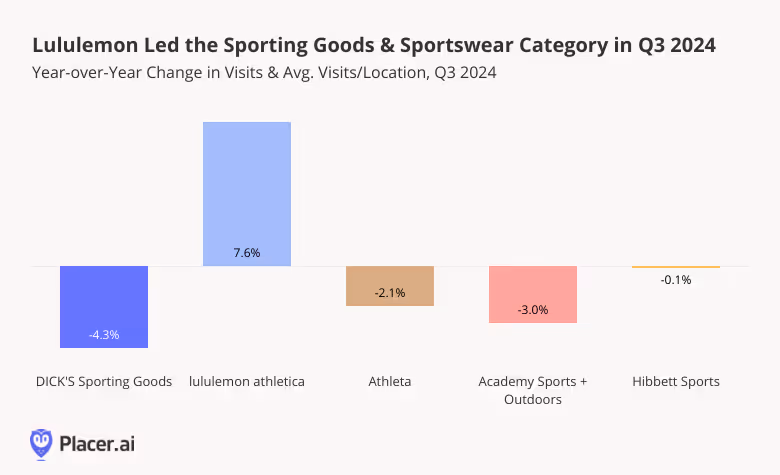
With budgets still tight, many shoppers are turning to value apparel and value athletic wear – and this trading down may be impacting the sporting goods and sportswear space: Q3 2024 visits to most sporting goods and athletic wear chains analyzed, including DICK’s Sporting Goods, Athleta, Academy Sports + Outdoor, and Hibbett Sports, remained at or moderately below 2023 levels. Still, the relatively minimal visit gaps indicate that demand for the category remains stable and may rise again with increased consumer confidence.
Meanwhile, lululemon athletica saw a 7.6% increase in YoY visits in Q3 2024 thanks to the company’s ongoing expansion.
Different Chains Serve Different Audiences
But even as the sporting goods and sportswear category may be facing a temporary lull, diving into the demographics of the trade areas for the various retailers reveals the variety of sporting goods and sportswear consumers – showing the varied demand for the category.
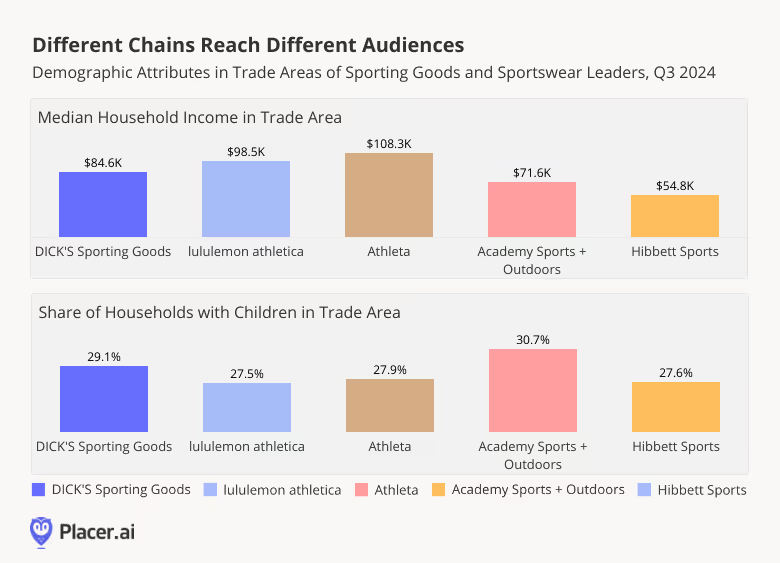
The median household income within the trade areas of the five chains analyzed ranged from $54.8K for Hibbett Sports to $108.3K for Athleta. The share of households with children within the trade areas also varied among the chains: DICK’s Sporting Goods, and Academy Sports + Outdoors included significantly more households with children in their captured markets when compared with Athleta, lululemon, or Hibbett Sports.
It seems, then, that each chain appeals to a specific consumer segment – DICK’s and Academy Sports both serve families, although DICK’s attracts the higher-income households and Academy Sports draws more middle-income shoppers. Lululemon and Athleta both operate at the higher-end of the athletic wear spectrum, but Athleta shoppers tend to come from slightly more affluent areas with larger household sizes. And Hibbett has carved out a niche among lower-income consumers.
Reason for Optimism Ahead of the Holidays
Demand for sportswear and gym gear may not be as strong as it was at the height of the pandemic when gyms were closed and consumers were doubling down on comfort. But the variety of audiences within the category leaders’ trade areas indicates that appetite for athletic wear and sporting goods is still widespread. And with Black Friday around the corner, these chains – and especially the higher-priced retailers among them – may well get a boost from price-conscious consumers looking to snag discounts at their favorite premium chains.
For more data-driven retail insights, visit placer.ai.
How are visits to the Placer 100 Index - a dynamic list of leading chains - faring as the year's fourth quarter begins? And what can visits tell us about the upcoming holiday season?
Shira Petrack
Nov 13, 2024
3 minutes
About the Placer 100 Index for Retail & Dining: The Placer 100 Index for Retail and Dining is a curated, dynamic list of leading chains that often serve as prime tenants for shopping centers and malls. The index includes chains from various industries, such as superstores, grocery, dollar stores, dining, apparel, and more. Among the notable chains featured are Walmart, Target, Costco, Kroger, Ulta Beauty, The Home Depot, McDonald’s, Chipotle, Crunch Fitness, and Trader Joe's. The goal of the list is to provide insight into the wider trends impacting the retail, dining and shopping center segments.
Placer 100 Index Swings Positive in October
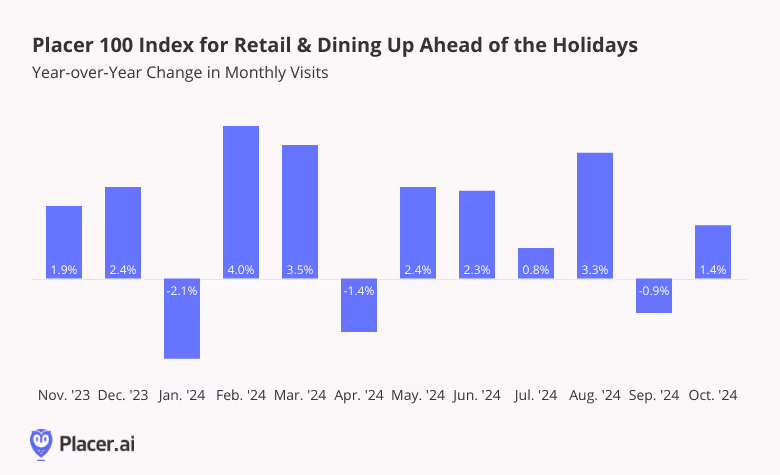
Visits to the Placer 100 Index chains grew over the summer, as the back to school season drove a 3.3% year-over-year (YoY) jump in August 2024 visits. And visits in September 2024 were essentially on par with September 2023 levels – indicating that shoppers did not stay home to make up for retail’s summer surge, which could signal an increased willingness to spend ahead of the critical Q4.
And indeed, the fourth quarter of the year started strong, with the Placer 100 Index up 1.4% YoY in October 2024 – and with consumer confidence recently hitting a 9-months-high, the upcoming holiday season looks particularly promising.
Placer 100 October 2024 Winners
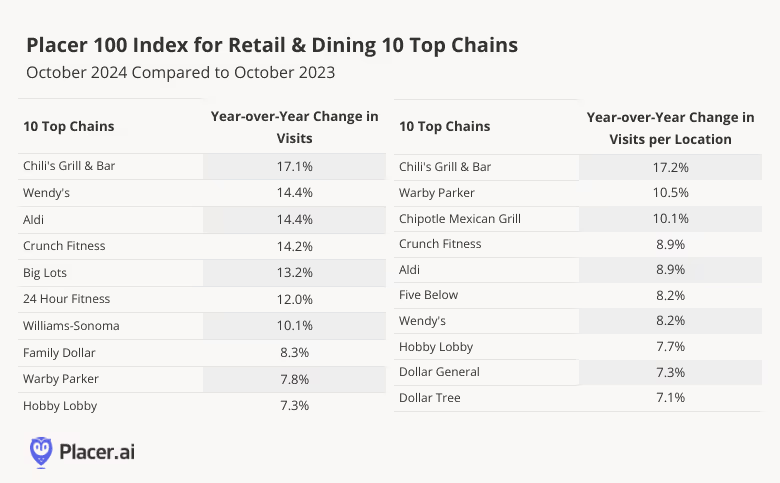
Chili’s Grill & Bar topped the Placer 100 October chart in terms of both overall and per-location visit growth. The chain is still riding the wave of its Big Smasher Burger success, which sent visits skyrocketing following the product’s launch in late April. Warby Parker also saw impressive increases in overall visits and in visits per location as the chain continued opening new stores and adding eye exam offerings to existing locations.
Aldi and Crunch Fitness also saw growth in both metrics, with the increase in overall visits outpacing the strong increase in visits per location – pointing to a successful expansion strategy.
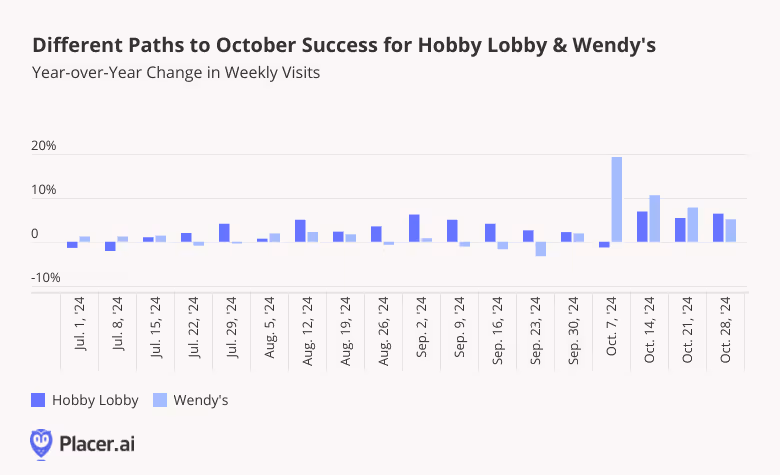
Placer 100 October 2024 Spotlight: Hobby Lobby & Wendy’s
Hobby Lobby and Wendy’s also experienced increases in both overall visits and visits per location in October, with different paths leading to the two chains’ October successes.
Hobby Lobby’s visits follow clear seasonal patterns. The chain’s traffic usually peaks in December, but traffic already begins to rise in August as parents and teachers stock up on supplies and classroom decorations. Visit growth then ramps up throughout September and October as consumers purchase Halloween-themed costumes and decorations. So far, Hobby Lobby appears to be having a particularly successful year, with visits outpacing last year’s numbers since the summer – and with the chain’s busiest season of the year coming up, Hobby Lobby is positioned to close out the year with a bang.
Wendy’s, meanwhile, demonstrated how chains can create their own growth opportunities without aligning with existing calendar-driven spending occasions. The chain introduced the Krabby Patty Kollab menu items on October 2nd to celebrate the 25th anniversary of "SpongeBob SquarePants,” which sent visits surging. And YoY traffic was still up four weeks later, revealing the potential of LTOs to drive up dining traffic even in the absence of a specific seasonal boost.
Which chains will top the Placer 100 Index in November?
With the summer behind us, we took a closer look at the data to assess the impact of the return-to-office mandates that have been ramping up in recent months. Are offices continuing to fill up, or has the office recovery run its course?
Lila Margalit
Nov 12, 2024
3 minutes
Note: This post utilizes data from Placer.ai Data Version 2.1. and thus reflects minor adjustments in data from previous reports.
Amazon, Dell, Goldman Sachs, Walmart, UPS – these are just a few of the major employers that have been cracking down on remote work in recent months, some requiring their teams to be on-site full time.
So with summer behind us, we dove into the data to assess the impact these accumulating RTO mandates are having on the ground. Are offices continuing to fill up, or has the office recovery run its course?
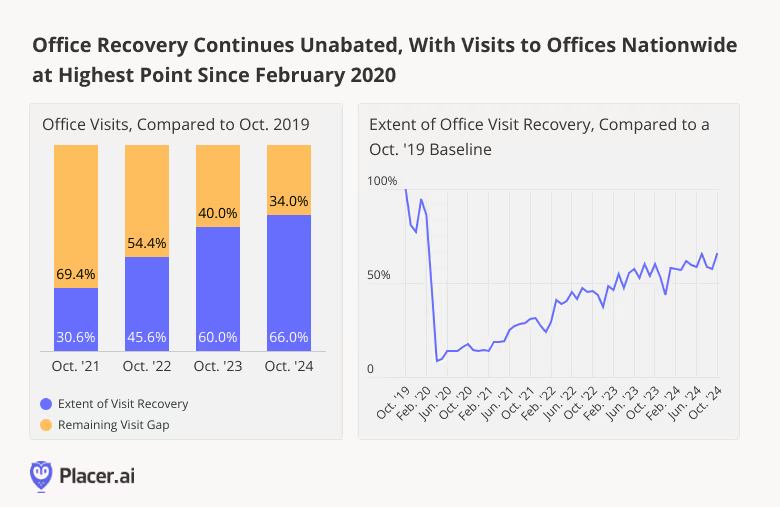
Recovery, Unabated
In October 2024, office visits nationwide were 34.0% below October 2019 levels. And looking at monthly fluctuations in office foot traffic over the past five years shows that the RTO remains in full swing – with last month’s visits reaching the highest point seen since February 2020.
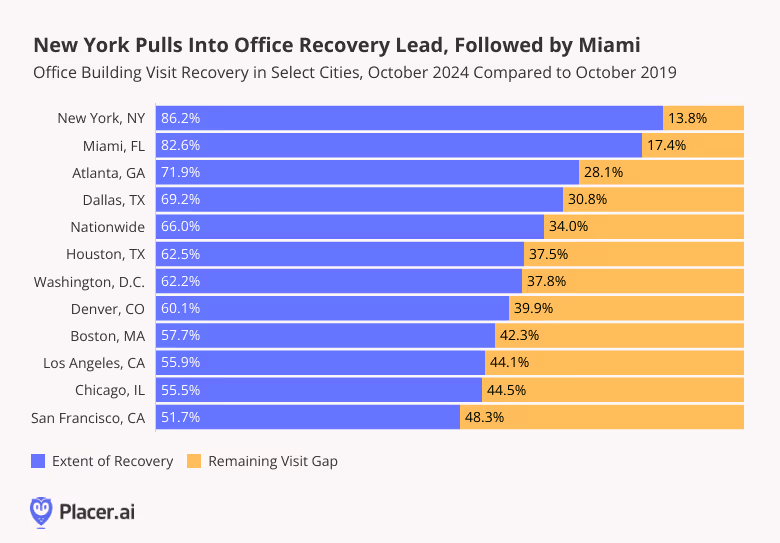
New York and Miami Hold the Lead
Digging down into regional data shows that in several major hubs – including Atlanta, Dallas, Houston, Denver, Washington, D.C., Chicago, and San Francisco – October 2024 was the single busiest in-office month since COVID. And in Boston, Los Angeles, Miami, and New York, October was the second-busiest month, outpaced only by July.
Still, New York and Miami continued to lead the regional office recovery pack, with October 2024 visits in the two cities up to 86.2% and 82.6%, respectively, of 2019 levels. The two hubs, joined by Atlanta and Dallas, continued to outperform the nationwide average. And Houston, which lagged behind other major business hubs during the summer in the wake of major storms, reclaimed its position just under the nationwide baseline.
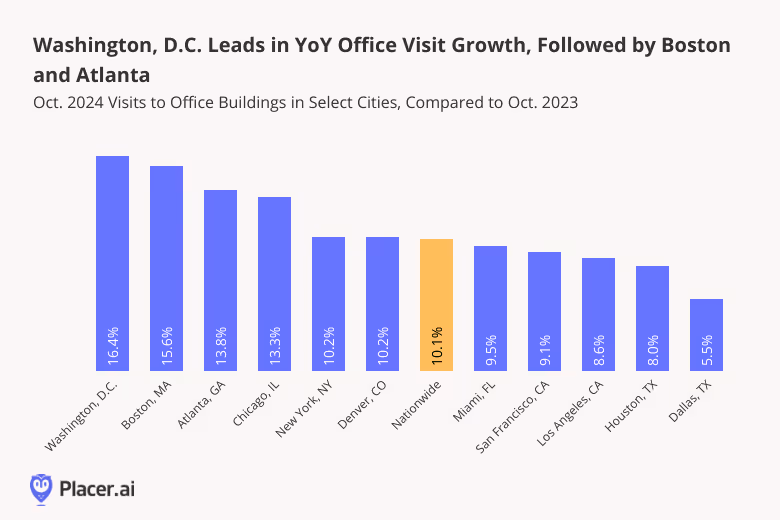
Washington, D.C., Boston, and Atlanta Lead in YoY Growth
In October 2024, visits to office buildings in Washington D.C. increased 16.4% year over year (YoY), likely boosted by an RTO push meant to increase meaningful in-person work in federal agencies – though many government employees continue to telework. Boston, where office building occupancy is outperforming national levels, visits saw a 15.6% YoY uptick. And Atlanta, where major employers from UPS to NCR Voyix are requiring workers to show their faces five days a week, saw visits grow 13.8% YoY.
Nationwide, office foot traffic increased 10.1% YoY – showing that the return-to-office is still very much a work in progress.
More Recovery Ahead?
Office attendance fosters creativity, mutual learning, and a sense of community – and can be critical for early-career success. But working from home at least some of the time offers greater flexibility that can improve employees’ work-life balance and in some cases, even enhance productivity. How will companies and employees continue to navigate the ongoing RTO?
Follow Placer.ai’s data-driven office recovery analyses to find out.
This blog includes data from Placer.ai Data Version 2.1, which introduces a new dynamic model that stabilizes daily fluctuations in the panel, improving accuracy and alignment with external ground truth sources.


.svg)