January is a time for new beginnings – and nearly half of Americans vowed to improve their fitness in the new year. So with 2024 picking up steam, we dove into the data to explore the current state of fitness. How did leading fitness chains perform last month?
Lila Margalit
Feb 21, 2024
4 minutes
January is a time for new beginnings – and nearly half of Americans vowed to improve their fitness in the new year. So with 2024 picking up steam, we dove into the data to explore the current state of fitness. How did leading fitness chains perform last month? And what’s in store for the industry as a whole?
‘Tis the Season to be Healthy
The first month of the year is a time for gyms to shine. Analyzing month-over-month changes in the average number of daily gym visits reveals that the biggest visit spike of the year takes place between December and January, when people double down on their motivation to make a change.
This year was no exception. In January 2024, visits to gyms nationwide jumped by 22.1% relative to December 2023 and were up 1.7% year-over-year (YoY) – despite lapping a very strong January 2023 – indicating that the post-COVID obsession with health and wellness is showing staying power.
Drilling down into the data for the nation’s five most-visited fitness chains shows that there’s plenty of room at the top. Value gym Crunch Fitness led the pack with a 21.1% YoY foot traffic increase, partly fueled by the brand’s continued expansion. Next in line was 24 Hour Fitness, where YoY visit gains highlighted the chain’s recovery from its pandemic-induced troubles. Planet Fitness outpaced its own outstanding 2023 performance with a 1.7% YoY foot traffic increase. And LA Fitness and Anytime Fitness also held their own – with visits just 2.0% and 4.4% under January 2023’s already-impressive levels.
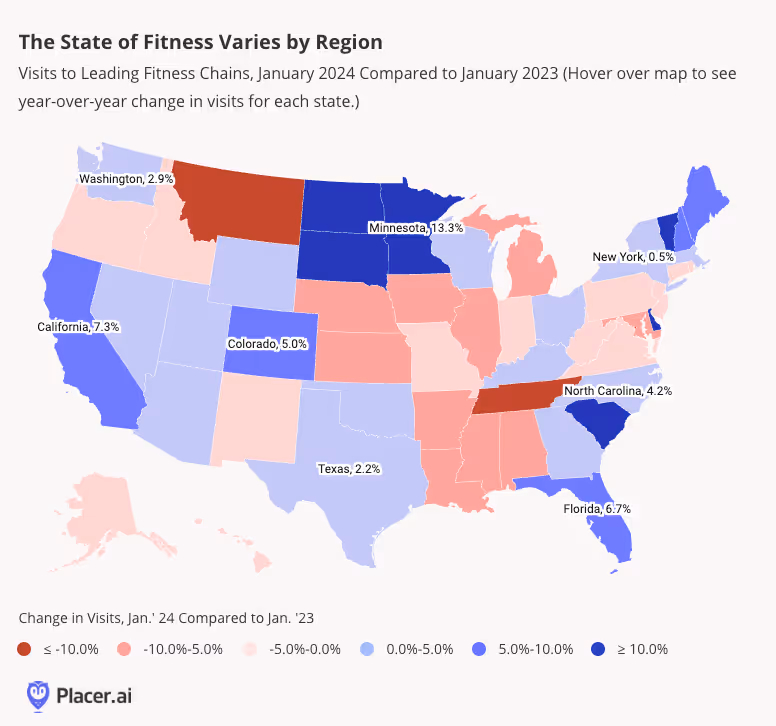
A Regional Story
But the state of fitness isn’t only a national story – it’s also a regional one. Looking at January 2024 YoY fitness visits by state shows significant variations, with some areas seeing strong industry-wide growth, and some seeing YoY visit gaps. Major markets like California, Texas, Florida, and New York all saw visit increases – despite the unusually cold weather in some of these areas, including New York and Texas. Several states, including South Dakota, North Dakota, Minnesota, and South Carolina, even saw visits to fitness centers skyrocket by more than 10.0%. At the same time, parts of the Midwest and South Central regions saw foot traffic dips.
Planet Fitness Dives into Multi-Channel Advertising
Planet Fitness remains America's most-frequented gym, drawing millions of customers each year with low prices and a quality Judgement Free Zone. In January 2024, a whopping 59.3% of total visits to Crunch Fitness, 24 Hour Fitness, LA Fitness, Anytime Fitness, and Planet Fitness – went to Planet Fitness’s vast club fleet. And in 2023, the category leader added 1.7 million new members to its rosters.
Given Planet Fitness’s incredible reach, it may come as no surprise that the chain has jumped on the media advertising bandwagon, announcing last month the launch of its own media network. The network will connect advertising partners with Planet Fitness’s growing audience, leveraging multiple channels – including in-club TV screens and other on-site promotional solutions.
And a look at the demographic characteristics of Planet Fitness’s trade areas across major markets shows just how varied a customer base the fitness leader attracts – with clubs in different areas of the country drawing very different audiences.
In California, for example, the median household income (HHI) of Planet Fitness’s captured market stood at $71.9K in 2023, 16.1% below the statewide baseline of $85.7K. But in New York, the median HHI of the brand’s captured market was $79.9% – 2.7% above the statewide baseline. And though Planet Fitness is squarely positioned as a bargain gym, a significant share of its captured market consisted last year of wealthy households earning more than $150K a year. This metric also varied across regions, as did the household composition of the chain’s customer base – with New York attracting customers from areas with disproportionately high shares of singles, and California drawing visitors from places with outsize shares of large households.
Given the variation in its captured markets, Planet Fitness’s media network offers potential advertisers not just the ability to reach millions of customers – but also the possibility of creating targeted campaigns aimed at different locations’ specific audiences.
Key Takeaways
Gyms have flourished in recent years, buoyed by consumers’ growing emphasis on health, wellness, and affordable experiences. But will newly-committed gym rats tire as the power of their new year’s resolutions wanes? How will the sector continue to fare as 2024 wears on?
Follow Placer.ai’s data driven analyses to find out.
Dutch Bros. has impressed with its foot traffic growth over the past few years. We took a closer look at the foot traffic data to understand where this chain’s growth is headed.
Bracha Arnold
Feb 20, 2024
2 minutes
Dutch Bros. has impressed with its foot traffic growth over the past few years. We took a closer look at the foot traffic data to understand where this chain’s growth is headed.
Brewing Up Visits
Dutch Bros., the country’s third-largest coffee chain, began as a simple coffee pushcart in Grants Pass, Oregon. Thirty-two years later, the company is one of the fastest-growing coffee chains in the country, having grown to over 900 locations in the country’s North and Southwest regions.
Analyzing the change in monthly visits to the chain since 2019 reveals near-constant growth over the past few years – a noteworthy feat considering the challenges facing the space over COVID and during the recent inflation. And while some of Dutch Bros. visit increase is likely due to its expanding store fleet, the consistency and magnitude of the growth suggests that the chain is keeping its new customers coming back.
Dutch Bros.’ success continued in 2023 and into the new year, with the company posting consistent year-over-year (YoY) visit gains for the past thirteen months. January 2024 visits to Dutch Bros. were 10.0% higher than in January 2023, while overall visits to the coffee space decreased by 2.7% YoY during the same period.
Who Visits Dutch Bros.?
Dutch Bros.’ drive-thru design helped the chain thrive during the pandemic – and the layout is also helping the chain reach suburban audience segments.
A chain’s potential market refers to the population residing in a given trade area, weighted to reflect the number of households in each Census Block Group (CBG) comprising the trade area. A chain’s captured market weighs each CBG according to the actual number of visits originating to the chain from that CBG.
Analyzing the psychographic makeup of Dutch Bros' trade areas in four major markets – Texas, Arizona, Oregon, and California – revealed that the chain’s captured market attracts an outsize share of suburban audience segments. Specifically, Spatial.ai: PersonaLive’s “Blue Collar Suburbs” and “Upper Suburban Diverse Families” were both overrepresented in Dutch Bros.’ captured market relative to their presence in the chain’s potential market. This suggests that the chain is particularly popular among suburban coffee lovers, regardless of income levels or economic backgrounds. As Dutch Bros. continues its expansion, focusing on suburban, car-centric areas may serve it well.
Pour It Up
Dutch Bros. has been a remarkable success story over the past few years despite the widespread economic headwinds challenges the dining space at large has experienced. Will the chain continue to see its momentum continue into 2024 and beyond?
Stay up-to-date with the latest data-driven dining insights by visiting placer.ai.
The Super Bowl was hosted in Las Vegas for the first time ever, and was followed by lots of after-game parties and parades. We used the latest location analytics to take a closer look at the Vegas hotspots where fans and celebrities celebrated (or drowned their sorrows) after the game.
Ezra Carmel
Feb 19, 2024
3 minutes
Super Bowl LVIII was a memorable event on and off the field. Rising-star quarterback Brock Purdy of the San Francisco 49ers led a valiant effort – though ultimately fell short – against the Kansas City Chiefs and their veteran starter Patrick Mahomes. The game made history as the first-ever Super Bowl hosted in Las Vegas; plenty of cause for celebration – if the city needed any. And because Vegas is packed with world-class entertainment venues just steps away from the stadium, Super Bowl 2024 was poised to be a bash from the get-go. We used the latest location analytics to take a closer look at the Vegas hotspots where fans and celebrities celebrated (or drowned their sorrows) after the game.
Hotels & Casinos Hit the Jackpot
Alongside the excitement of the game inside Las Vegas’s Allegiant Stadium, the party atmosphere of The Entertainment Capital of the World did not disappoint. Compared to the two previous Super Bowls, this year’s contest had the highest percentage of postgame hotel & casino visits – a whopping 38.4% of stadium visitors on Super Bowl Sunday visited a hotel or casino immediately after the game.
These venues have numerous attractions – restaurants, bars, nightclubs, and hotel rooms – so it’s difficult to know what specifically drove elevated foot traffic. However, it’s fair to say that postgame parties were a significant factor.
The Top Party Spots
Diving deeper into the data revealed which Vegas venues drove the most postgame traffic from stadium visitors. Caesars Palace came out on top, welcoming 6.3% of postgame foot traffic. Notably, the hotel’s Omnia nightclub was the location of the 49ers' postgame gathering where Lil Wayne attempted to alleviate the heartbreak of the losing squad.
Las Vegas’ Harry Reid Int’l Airport – where some fans and staff likely made a quick exit after the game – took second place, and Wynn Las Vegas was the third most-visited postgame location and cemented itself as a Super Bowl party destination – having hosted the champs last year as well. This time around, big stars in Chiefs Kingdom – including Patrick and Brittany Mahomes, Travis Kelce, and Taylor Swift – showed up for an after-party at Wynn Las Vegas’ XS Nightclub to celebrate the victory to the music of Marshmello and Jelly Roll. The hotel’s Encore Beach Club put on an additional after-party honoring Dr. Dre, Snoop Dog, and Usher – who performed the Super Bowl halftime show. Ludacris, who also appeared on stage at halftime, was among the big names in attendance.
Wynn Las Vegas, with 3.7% of postgame traffic, was the fourth most-visited postgame venue. The hotel’s Zouk Nightclub hosted the Chiefs’ official after-partycelebration, with Travis Kelce, Taylor Swift, Megan Fox, and Machine Gun Kelly in attendance.
The Party Doesn’t Stop
The Super Bowl LVIII celebrations didn’t end on the Las Vegas Strip. Per tradition, at the end of the game, Super Bowl MVP Patrick Mahomes and his family declared “We’re going to Disneyland!” The following day, the Mahomes family was at a sold-out Disneyland Resort to celebrate the win and take part in the iconic victory parade.
The parade – scheduled for 2 pm – proved popular among Disneyland guests. Location intelligence showed that hourly visits to Disneyland climbed during the lead-up to the parade and peaked at the parade’s start time.
This One’s in the Books
Las Vegas provided a super-sized entertainment backdrop for sports’ biggest stage and one of the most thrilling Super Bowls to date. Location intelligence from the 2024 Super Bowl suggests that fans who make the trip look beyond the in-stadium action for ways to keep the celebrations going after the final whistle.
For more data-driven entertainment, hospitality, and tourism insights, visit Placer.ai.
There are so many ways to say Happy New Year in Asian languages, such as “Gong Xi Fa Cai” in Mandarin, which means wishing you prosperity in the coming year, “Saehae Bok Mani Badeuseyo” in Korean, wishing you lots of luck, and “Chuc mung nam moi” in Vietnamese, with a similar meaning of wishing you a joyful year. Along with these auspicious greetings are traditional foods such as dumpling soup, mung bean pancake, BBQ beef, sticky rice cakes, and candied fruits. Within the melting pot that is the USA, one can often find an Asian-themed shopping center in which to partake of the festivities. In Westminster, CA, Asian Garden Mall is one of the largest Vietnamese shopping centers in the U.S. At The Source OC, Korean shops and eateries abound. In the Midwest, one can visit Asia Mall Minnesota, with a pan-Asian panoply of offerings.
Last year, Lunar New Year kicked off on Jan. 22, and we can see that Asian Garden Mall visits skyrocketed on that day (below)
During the summer, there is also a vibrant night market there, open from 7-11pm on the weekends. Finds include pork skewers and buns, grilled scallops, mini shrimp crepes, and sugar cane juice.
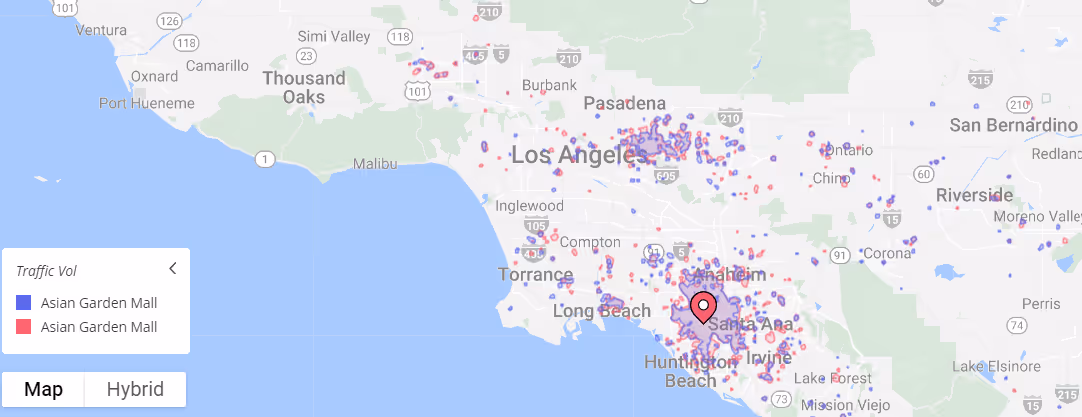
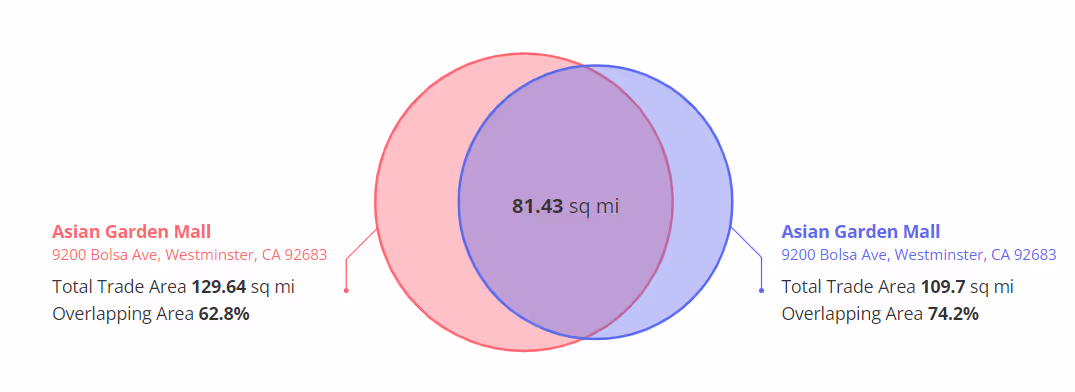
The night market takes place in the parking lot of Asian Garden Mall and draws accretive business. What would normally be empty during the Feb-May period without a night market becomes a thriving evening adventure during the summer months.
In comparing Feb-May visits (blue) versus Jun-Sept visits (red) below, the mall also draws from a much larger trade area when the night market is occurring.
In terms of festivities, parades and food stalls abound at celebrations like the Tet festival in New Orleans, which takes place this year on Feb. 16-18 in the Village de l’Est neighborhood. There will be fireworks and a dragon dance and of course vats of simmering pho, crispy spring rolls, and puffy fried bananas. In San Jose, CA, home to one of the US’s largest Vietnamese populations, a Tet celebration will be held in the former Sears parking lot at Eastridge Center from Feb 16-18. There will be a talent contest, a visit from Miss Vietnam California, carnival rides, and of course plenty of food booths and desserts.
One of the newer Korean-themed malls is the Source OC, which opened in 2019. While the majority of the food options transport you to being in Korea, there is also Italian at Il Fiora, Japanese at Izakaya Ichie, and Mexican at La Huasteca. One can indulge in Gangnam House Korean BBQ, Monday to Sunday shaved ice, and Cheesetella Japanese Cheesecake. We saw the Source OC dip during Covid like practically all retail, but it has bounced back and is now exceeding pre-Covid visitation levels. Besides the draw of the food, there is also an indoor golf-simulator, a VR experience, and a children’s playground.
Both Koreatown Plaza and Koreatown Galleria are long-standing stalwarts in the heart of LA, but as Americans of all ethnicities increasingly migrate to suburbs, we will no doubt see more shopping center options catering to ethnic tastes outside of downtowns.
The nation’s first enclosed shopping mall was Southdale Center in Edina, MN, a project that opened in 1956, by Victor Gruen, an Austrian-American who would henceforth be known as the “father of the shopping mall.” His original vision was a community hub with access to many shops as well as medical centers, schools, and even residences. This did not occur in the 50s, but three-quarters of a century later, many mall developers are re-envisioning malls to be places to live, eat, play, and shop as well as have access to essential services and to be that third space for community gatherings and celebrations. How fitting that another recent mall in Minnesota, the Asia Mall has been conceived as a reflection of the local community. It opened in November 2022, inspired by the desire for a one-stop pan-Asian mall to get all groceries as opposed to dashing around Minneapolis, St. Paul, Brooklyn Park, and Brooklyn Center to obtain the desired goods. Food and drinks are procured from various Asian countries, such as Vietnam, China, and Korea and anchored by grocery store Asian Mart 88. Dining includes Pho Mai, Hot Pot City with all-you-can-eat hot pot, Cruncheez Korean hot dogs, and Mochi Dough doughnuts. As part of the trend for including essential services, this mall also has a hair salon, insurance company, and travel agency.
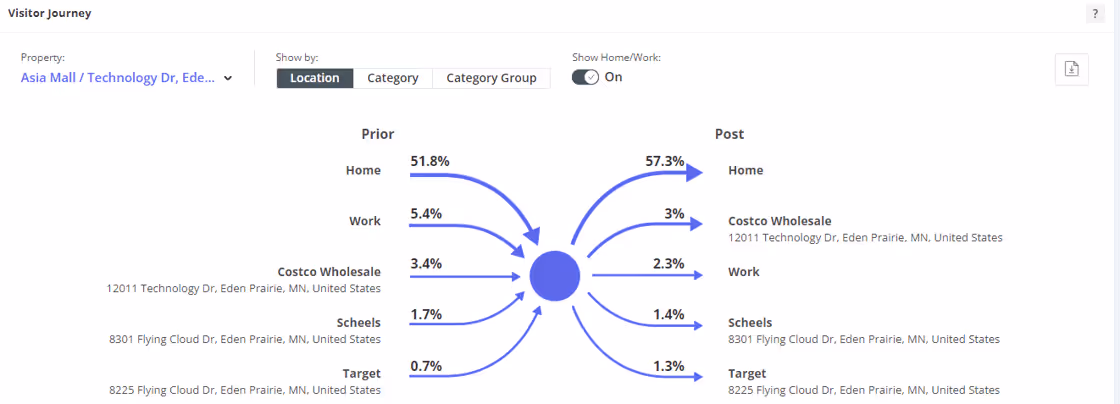
It also appears the concept of one-stop-shop, be it for Asian groceries or for warehouse-sized purchases, is prized by the inhabitants of Eden Prairie who really value efficiency. Asia Mall does half the visits of the nearby Costco, which is impressive. Besides home and work, visitors of Asia Mall are most likely to visit Costco before or after a shopping trip (below).
How did off-price leaders T.J. Maxx, Marshalls (both owned by TJX Companies), Burlington, and Ross perform in last year? And how is 2024 shaping up for the category? We dove into the foot traffic data to find out.
Bracha Arnold
Feb 15, 2024
3 minutes
How did off-price leaders T.J. Maxx, Marshalls (both owned by TJX Companies), Burlington, and Ross perform in last year? And how is 2024 shaping up for the category? We dove into the foot traffic data to find out.
Continuing To Grow
Off-price apparel retailers typically employ a straightforward method: sell excess or off-season merchandise that would otherwise remain unsold at a discount, benefiting both shoppers and manufacturers.
This retail model has consistently performed well, as evidenced by the consistent growth in visits to T.J. Maxx, Marshalls, Ross, and Burlington over the past few years. And despite the overall sluggishness experienced by much of the apparel retail category in 2023, visits to these stores continued to increase year-over-year (YoY) in every quarter analyzed.
January 2024 YoY visit growth slowed slightly – perhaps due to Q1 2023’s exceptionally strong performance. But despite the difficult comparison, foot traffic for most chains remained close to 2023 levels while YoY January visits to Ross increased 5.5%, highlighting the resilience of the off-price sector.
HHI Varies By Brand
The demographic and psychographic makeup of a chain’s trade area – which shows the types of visitors who frequent the chain – can be determined by looking at the chain’s potential or captured market. A chain’s potential market is calculated by weighing the Census Block Groups (CBGs) feeding visits to the chain according to the size of the CBG, while the captured market weighs each CBG according to the relative number of visits to the chain originating from that CBG.
Using these tools to analyze the median household income (HHI) in the trade areas of the four chains reveals a divergence between the two TJX-owned chains T.J. Maxx and Marshalls, on one side, and Ross Dress for Less and Burlington, on the other. The median HHI in T.J. Maxx and Marshalls’ potential market is higher than the potential median HHI for Ross and Burlington – and the two TJX brands’ captured market median HHI is even higher. Meanwhile, the median HHI in Ross and Burlington’s captured market is lower than the median HHI in their own potential markets.
The variance in median HHI between the chains may have to do with differences in branding and product selection. Marshalls and T.J. Maxx tend to have the higher price points, with T.J. Maxx in particular expanding its designer offerings over the past few years through its Runway stores. Ross and Burlington, known for their no-frills approach to clothing shopping, have relatively lower price points – and may see more customers seeking bargains over high fashion.
Families Drawn To Off-Price Retailers
While an analysis of trade area median HHI highlights differences between the chains’ visitor bases, a deeper exploration of Marshalls, Ross, and Burlington’s trade areas suggests that the retailers also share common ground – specifically, their popularity with middle-income families. For almost all brands, the captured market share of households categorized by the Spatial.ai: PersonaLive dataset as “Family Union” and “Cultural Connections” was larger than the potential market share. T.J. Maxx, which had a slightly lower share of “Cultural Connection” households in its captured market relative to its potential market, was the sole exception.
All four chains continue to add stores to their fleets – Ross opened 97 stores in fiscal 2023, and Burlington is looking to expand in over 60 former Bed Bath and Beyond locations. Focusing on trade areas with diverse families, then, may serve Marshalls, Ross, and Burlington. And T.J. Maxx, which has been enjoying a resurgence of interest from younger shoppers, might consider expanding into areas that attract young professionals.
Dressing To Impress
Off-price apparel retailers continue to succeed despite – or perhaps because of – a challenging economic climate. Will their success continue into 2024?
Visit placer.ai to keep up-to-date on the latest data-driven retail trends.
With shopping center vacancy rates now lower than they were pre-COVID, we dove into the demographic and psychographic trade area data for leading Indoor Malls, Open-Air Shopping Centers, and Outlet Malls to understand who visited malls in 2023.
Shira Petrack
Feb 14, 2024
2 minutes
With shopping center vacancy rates now lower than they were pre-COVID, we dove into the demographic and psychographic trade area data for leading Indoor Malls, Open-Air Shopping Centers, and Outlet Malls to understand who visited malls in 2023.
Shopping Center Types Draw a Variety of Audiences
Diving into the demographics of the trade areas of the various mall types in 2023 reveal both similarities and differences between the typical visitor to Indoor Malls, Open-Air Shopping Centers, and Outlet Malls.
In all three mall types, the median trade area household income (HHI) in the three mall types was higher than the nationwide median HHI of $69.5K (according to the STI: Popstats 2022 dataset). But Open-Air Shopping Centers drew the highest income visitors, with a trade area median HHI of $87.8K in 2023. The trade area of Open-Air Shopping Centers also had the lowest share of Households with Children and the highest share of singles (One-Person and Non-Family Households).
Outlet Malls lay at the other end of the spectrum, with a trade area median trade HHI of $73.9K, the highest share of Households with Children, and the lowest share of single households. And the median HHI and household composition for the trade area of Indoor Malls stood between those of the other two types.
Different Family Segments for Different Mall Types
Even though Outlet Malls tend to draw the highest, and Open-Air Shopping Centers draw the lowest share of family visitors (Households with Children), diving deeper into various family segments reveals a more nuanced picture.
For example, the trade areas of Outlet Malls do indeed contain the highest shares of the “Family Union” and “Promising Families” segments – defined by Experian: Mosaic as blue-collar families and young families in starter homes, respectively. But Open-Air Shopping Centers tend to draw the highest share of the more affluent “Flourishing Families” segment – perhaps thanks to the Open-Air Shopping Centers’ higher trade area median HHI.
So while the demographic analysis can provide an overall snapshot of the various mall types’ audience, diving into the psychographics can yield a higher-resolution picture of the types of shoppers frequenting each shopping center category.
Looking Ahead to 2024
For the most part, malls – especially Indoor Malls and Open-Air Shopping Centers – succeeded in exceeding or staying close to 2022 visit levels last year, despite the economic headwinds. And while January data indicates that the space may be entering a challenging period, there are plenty of reasons to think that the dip in early 2024 foot traffic is just a temporary setback driven by a unique set of circumstances. As the year continues to unfold, tracking visits in this sector will offer more insights into the state of the 2024 consumer.
For more data-driven retail insights, visit placer.ai/blog.


.svg)


.avif)
.png)
.avif)
.png)

.png)
.avif)
.png)


.png)
.avif)
.png)
%20(1).avif)

.avif)
.png)

