Over the past few months, we’ve noted how consumers–particularly from lower-income trade areas–have started to migrate from QSR to value-grocers, dollar stores, and convenience stores. Against that backdrop, we wanted to examine visitation trends for QSR chains in the state of California, where a $20 per hour minimum wage law was put in place on April 1 for employees of fast-food chains with more than 60 locations nationwide (with some exemptions for smaller stores at grocery stores, airports, and entertainment venues). This represented a 25% increase from the previous minimum wage for fast-food employees of $16 per hour (which remains the state’s minimum wage for other categories except for workers in healthcare facilities, which also saw minimum wage increased to $20 per hour).
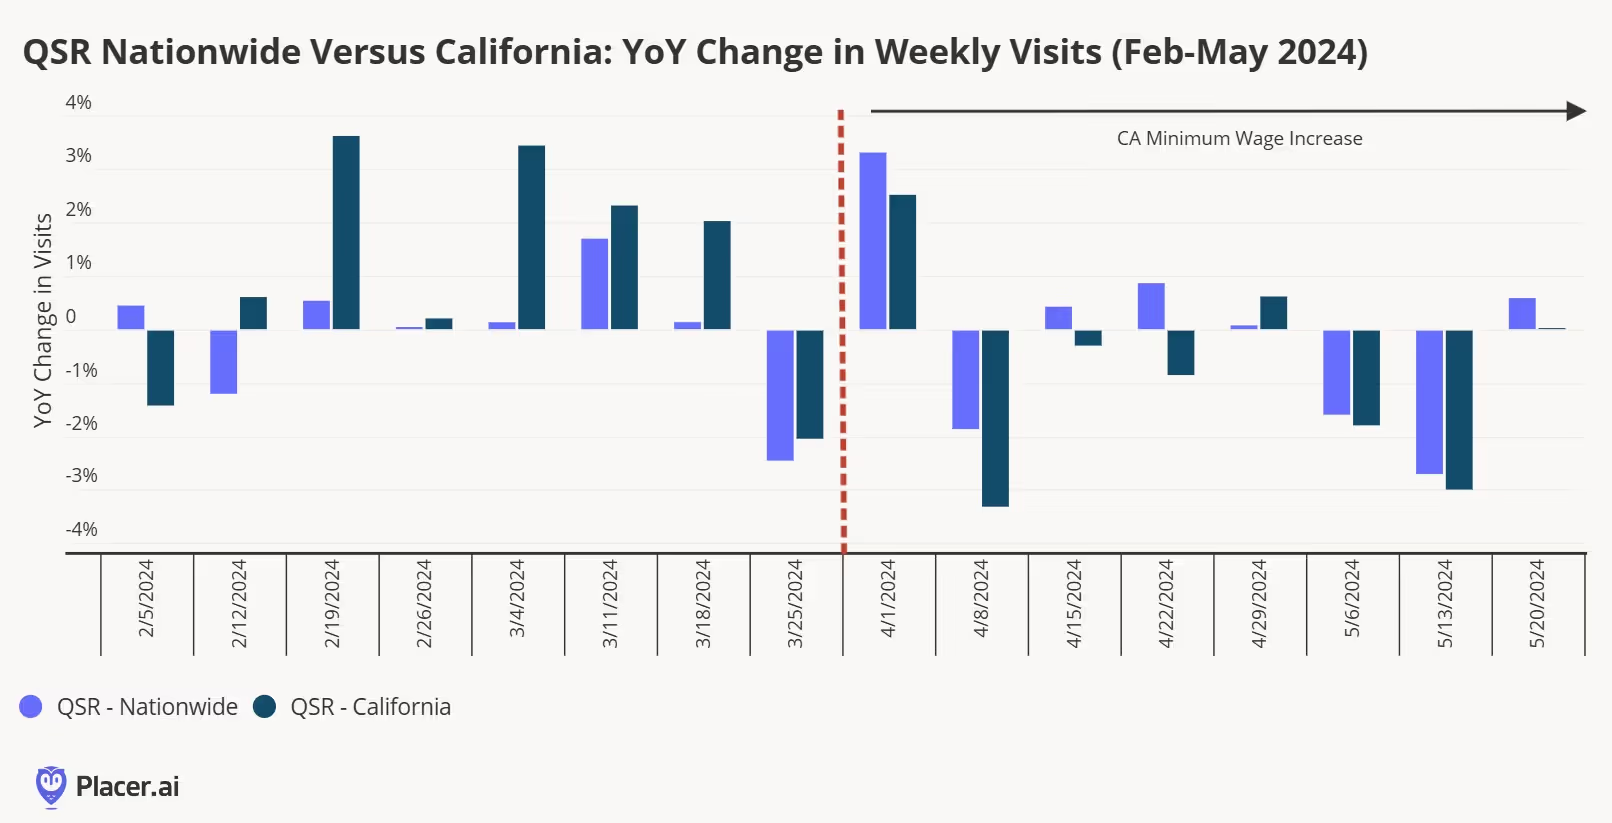
As a result of the minimum wage increase, most chains have raised prices in the region anywhere from the mid-single digits to the midteens. We compared year-over-year visit trends for QSR chains nationwide and California, and it’s clear that the menu price increase is having an impact. During February-March 2024 (we’ve excluded January due to inclement weather across much of the country), year-over-year QSR visit trends in the state of California had been running slightly ahead of national averages (below). However, this abruptly shifted when the minimum wage increase went into effect, with the nationwide visit trend year-over-year exceeding the state average seven of the eight weeks during the April-May 2024 timeframe.
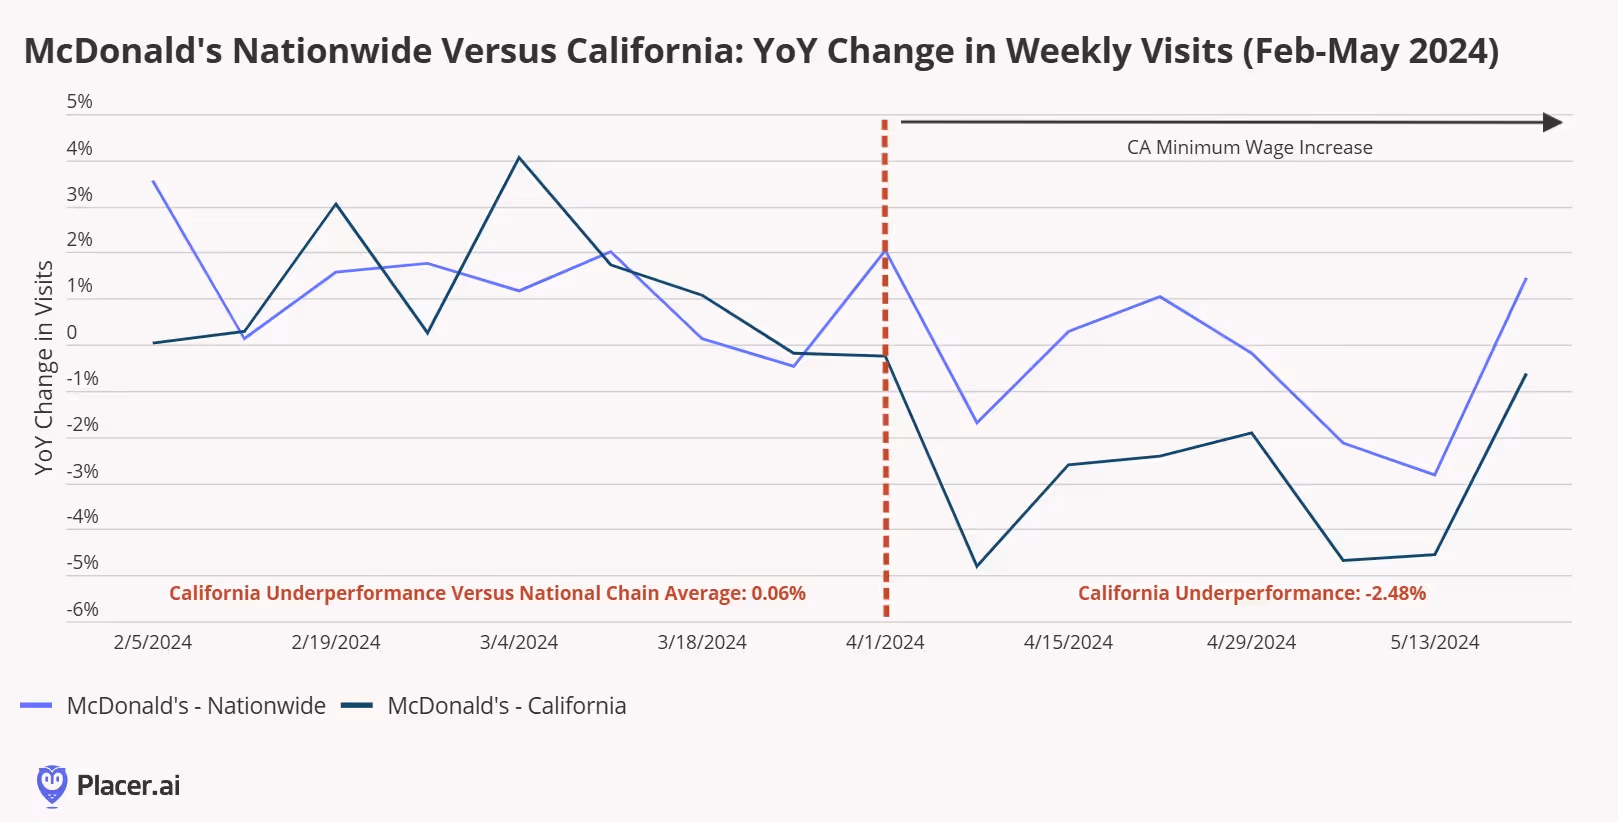
We also see the impact at the chain level. Below, we’ve looked at year-over-year visitation trends for McDonald’s nationwide and in California (where about 9% of its restaurants are located) from February through May. Again, we see a situation where McDonald’s California was seeing roughly the same year-over-year visit trends as its national average during February-March but underperformed by almost 250 basis points after the minimum wage increase went into effect.
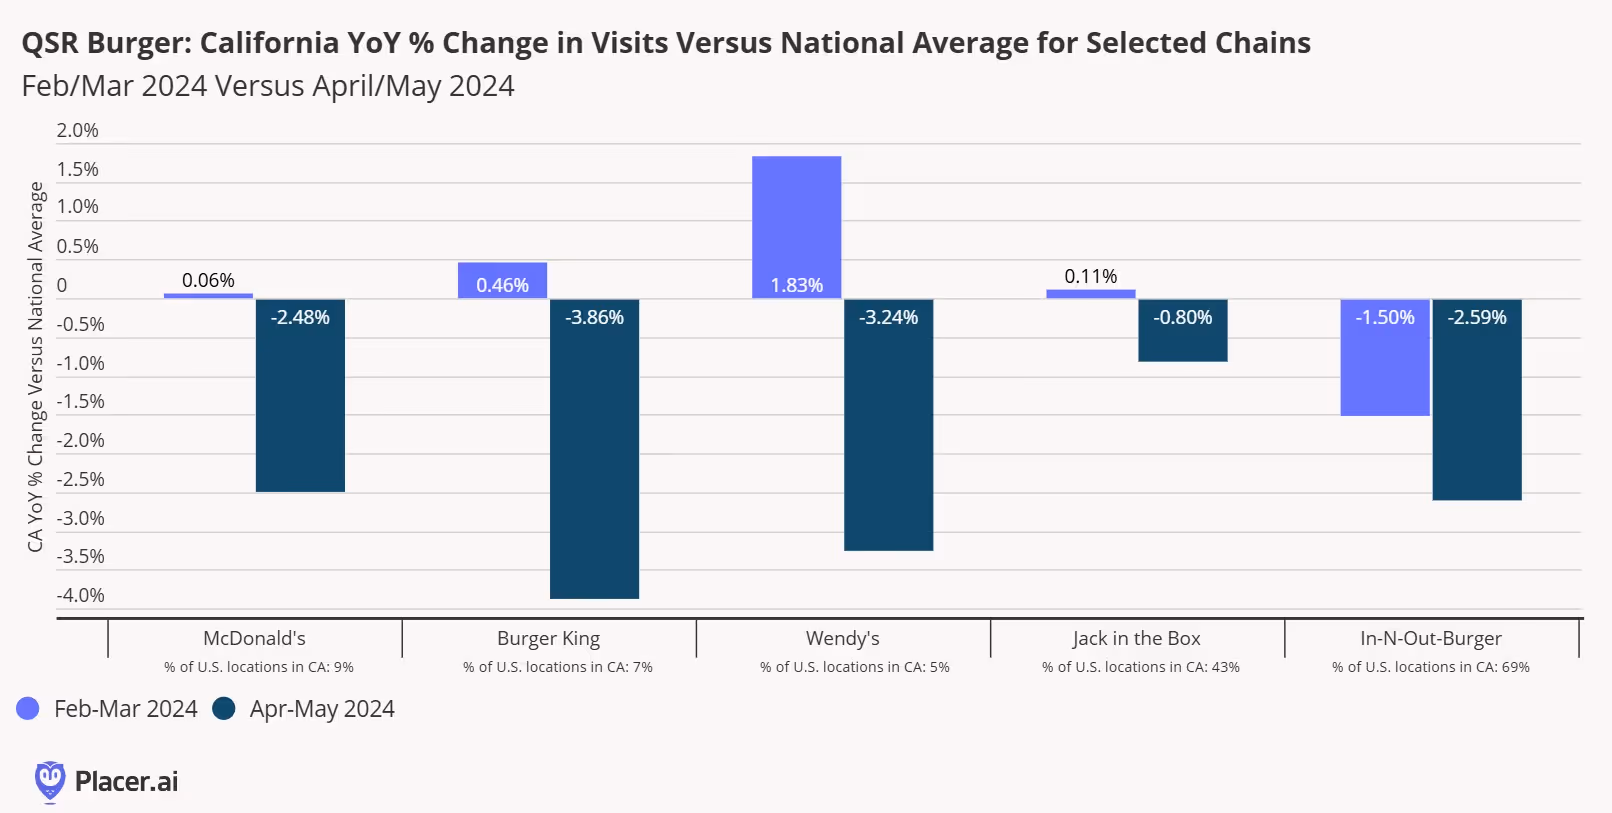
Our data indicates that QSR burger chains have generally been the hardest hit by the California increase in minimum wage and subsequent increase in menu prices. In addition to McDonald’s, we see that other large QSR burger chains in the state also underperformed their national average following the minimum wage increase. Chipotle–which raised menu prices by 6%-7% in California to help offset the minimum wage increase–also saw year-over-year visit trends in California underperform its national average in April and May.
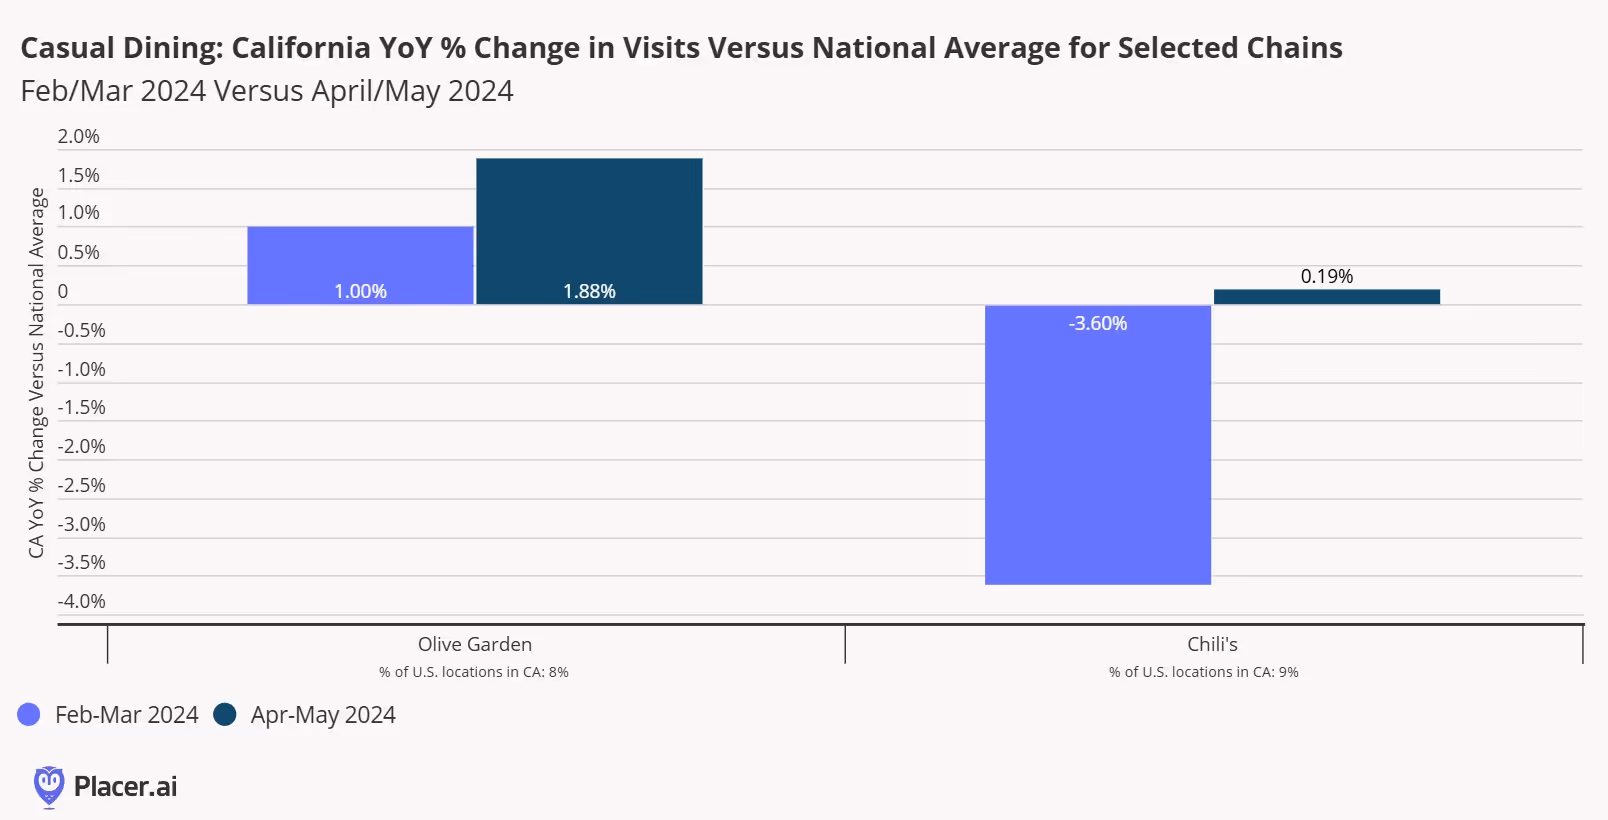
It’s early, but we’re starting to see the ripple effect of the minimum wage increase across the broader restaurant industry. First, we’ve started to see some operators close locations in the state, especially chains that were already facing financial difficulties. Earlier this week, Rubio’s Coastal Grill shut down almost 50 locations in California and filed for Chapter 11 bankruptcy protection, citing “significant increases to the minimum wage in California” as a reason for closing the restaurants. Second, the minimum wage hike and subsequent increase in QSR menu prices may be benefitting casual dining chains (many of which were already paying above the new minimum wages for many employees). Below, we see that Darden’s Olive Garden concept and Brinker International’s Chili’s concept in California have outperformed their national averages with respect to year-over-year visit trends starting in April (below). Finally, the minimum wage increase could make it more costly to do business across other retail and restaurant categories, something we called out in our recap of 99 Cents Only going out of business.
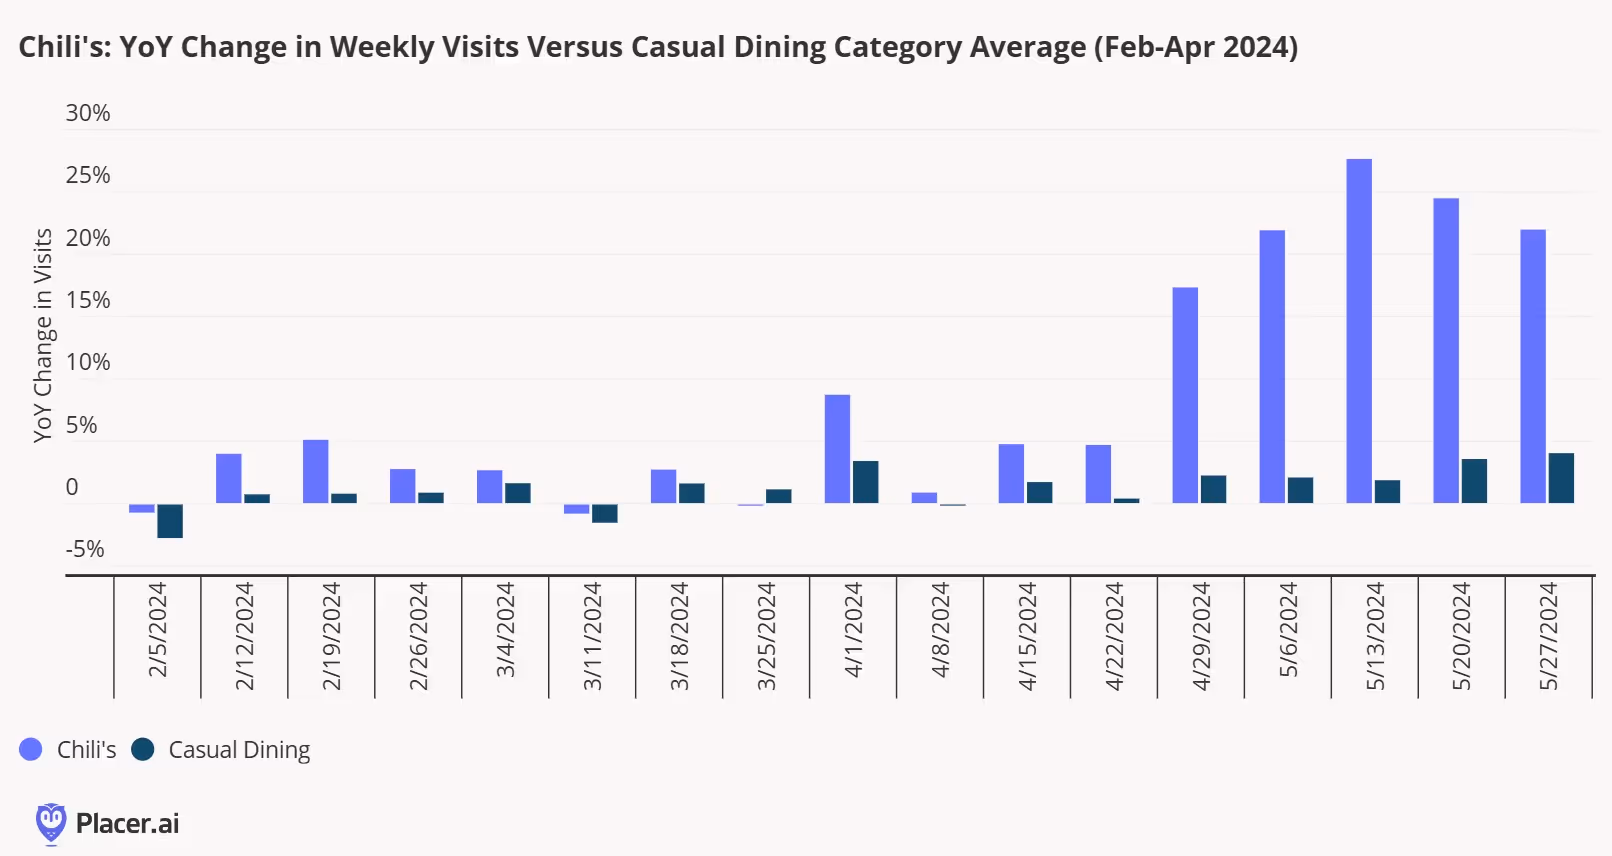
As we discussed following this year’s National Restaurant Association show, casual dining has been making a comeback the past several months, with many chains accentuating value proposition through promotions. Chili’s has seen visitation trends outperform casual-dining category averages by a significant amount the past several weeks (below) through its value messaging, while Buffalo Wild Wings All-You-Can Eat wings promotions on Monday and Wednesdays starting in mid-May has been one of the more successful promotions that we’ve seen in the full-service restaurant category in some time. However, with several QSR chains starting to get more promotional ahead of McDonald’s planned $5 value menu promotion at the end of the month, it’s clear that QSR chains are looking to also emphasize value in the coming months, even while facing higher labor costs.
Our May mall index examines visit performance at malls, indoor malls, outlet malls, and open-air shopping centers to see how visits rebounded from April's dip and explores how Mother's Day and Memorial Day drove visits across malls.
Maytal Cohen
Jun 6, 2024
3 minutes
About the Mall Index:The Index analyzes data from 100 top-tier indoor malls, 100 open-air shopping centers (not including outlet malls) and 100 outlet malls across the country, in both urban and suburban areas. Placer.ai leverages a panel of tens of millions of devices and utilizes machine learning to make estimations for visits to locations across the country.
Key Takeaways:
In May 2024, indoor malls, outlet malls, and open-air shopping centers all saw significant year-over-year (YoY) visit increases – providing further evidence that April’s slowdown was due to an Easter holiday calendar shift, rather than any real category weakness.
Both Mother’s Day and Memorial Day drove substantial visit spikes across mall types – with foot traffic outperforming last year’s levels.
Outlet malls experienced more pronounced visit bumps on Easter weekend and Memorial Day, while open-air shopping centers drew bigger spikes on Mother’s Day.
May Sees a Strong Rebound in Mall Visits
After a brief calendar-driven slowdown in April, May saw a resurgence in foot traffic to malls. Indoor malls led the way with an 8.6% YoY increase, followed by open-air shopping centers and outlet malls, which experienced YoY jumps of 6.2% and 5.7%, respectively.
This uptick is likely due to a variety of factors – from warmer weather to rising consumer confidence amidst slowly easing inflation. And malls’ particularly strong showing on two of May’s most important retail milestones – Mother’s day and Memorial day also helped propel the segment forward.
Category Strength Boosted and Showcased by Holiday Visit Spikes
Taking a closer look at visit patterns to the three mall types on Mother’s Day and Memorial Day shows how significant these special days were for mall foot traffic. On Mother’s Day (May 12th), indoor malls, open-air shopping centers, and outlet malls saw respective visit spikes of 15.8%, 26.0%, and 11.4%, compared to an average year-to-date (YTD) Sunday. And Mother’s Day visits were up significantly YoY as well – further highlighting the category’s robust positioning.
All three mall types also saw impressive visit bumps on Memorial Day – this time compared to an average YTD Monday. The relative spikes were bigger across the board, since malls tend to be less busy on Mondays than on Sundays. But for outlet malls, Memorial Day visits really hit it out of the park – with foot traffic up by a whopping 123.3%. As a day off work featuring plenty of markdowns, Memorial Day is an ideal time to make the longer trip to an outlet mall and hunt for bargains.
And in another promising sign for the category, Memorial Day visits to all three mall types increased YoY – showing that despite continued headwinds, malls are still on the rise.
Which Mall Kings Rule Special Calendar Days?
Comparing weekly mall visits to an early January baseline also shows the varying impact of different holidays on the three mall types.
On Easter, and even more so on Memorial Day – an extended weekend very much focused on savings – outlet malls won the day. On these holidays, shoppers may be more likely to have the time and state of mind to make a day of their shopping trip and lean into the treasure-hunting experience.
But on Mother’s Day, more upscale open-air shopping centers took the lead, as consumers embraced a more unique and luxurious shopping experience. Still, all three mall types drew increased traffic on the different special days – showing that each can benefit from a variety of calendar highlights.
Looking Ahead
Malls’ strong May performance – especially on the holidays – shows that shopping centers are on the upswing once again. This could be an encouraging sign for the category heading into the summer, and may hint at a promising shopping season during the warm months ahead.
For more data-driven retail insights, visit our blog at Placer.ai.
With summer nearly upon us, we dove into the data to see how the return-to-office fared in May 2024. Did the post-pandemic visit recovery trajectory observed in April continue apace? And which major regional hub saw the most YoY visit growth?
Lila Margalit
Jun 5, 2024
3 Min
The Placer.ai Nationwide Office Building Index: The office building index analyzes foot traffic data from some 1,000 office buildings across the country. It only includes commercial office buildings, and commercial office buildings with retail offerings on the first floor (like an office building that might include a national coffee chain on the ground floor). It does NOT include mixed-use buildings that are both residential and commercial.
With summer nearly upon us, we dove into the data to see how the return-to-office fared in May 2024. Did the post-pandemic visit recovery trajectory observed in April continue apace? And which major regional hub saw the most YoY visit growth?
May Office Visits Hold Steady
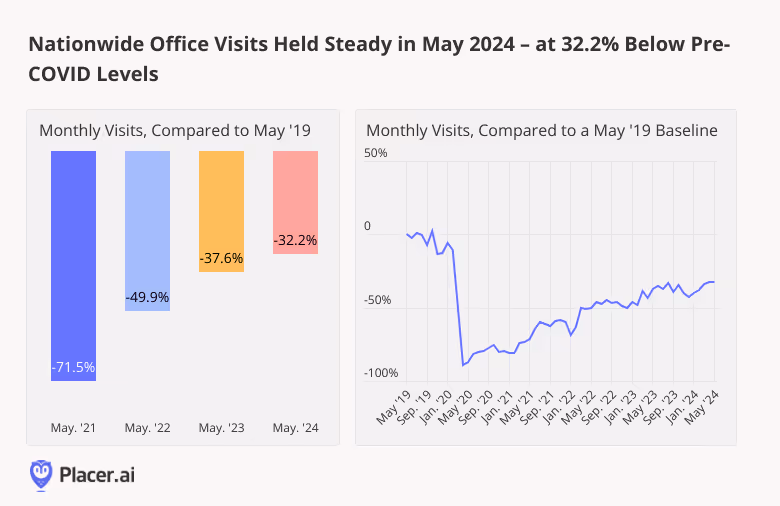
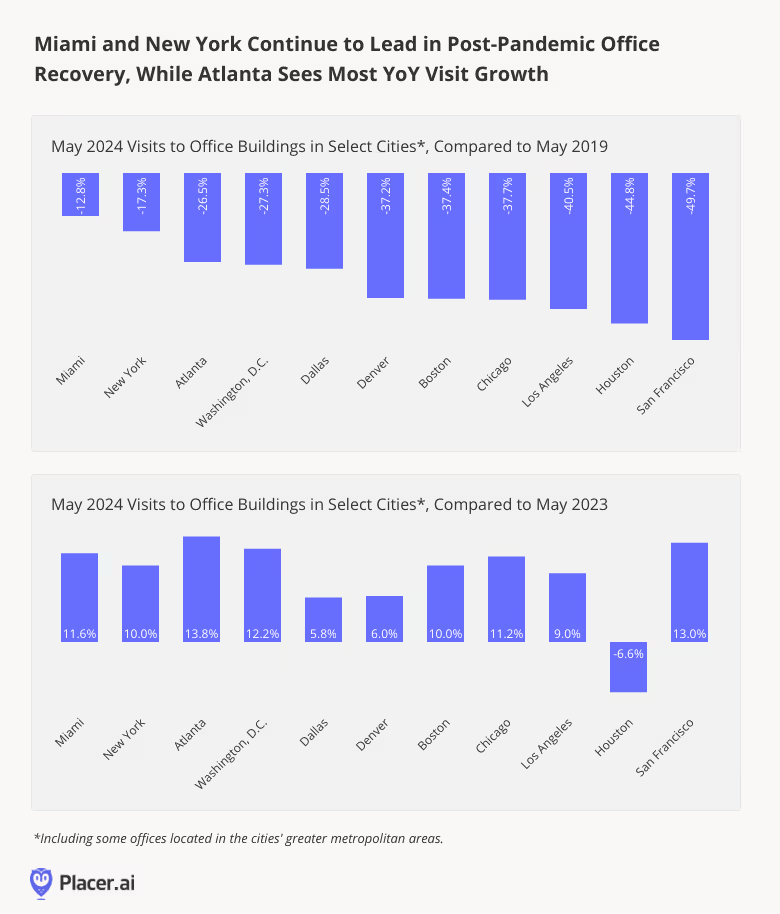
The office recovery is still very much underway. Visits to office buildings nationwide in May 2024 were just 32.2% lower than in May 2019 – and slightly higher than they’ve been during any other month since COVID. Year-over-year (YoY), office foot traffic in May increased by 8.6%.
Regional Round Robin
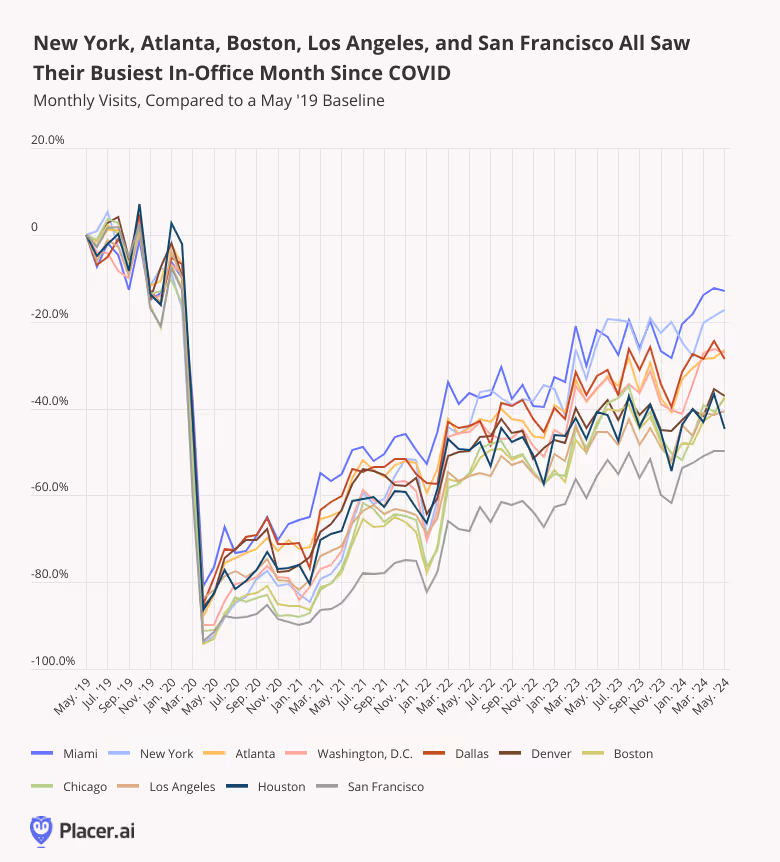
And drilling down into the data for 11 major business hubs nationwide shows recovery continuing unabated throughout (most of) the country. For New York, Atlanta, Boston, Los Angeles, and San Francisco, May 2024 was the single busiest in-office month since February 2020. And for Miami, Washington, D.C., and Denver, it was the second-busiest month.
Consistent with recent trends, Miami continued to lead the post-COVID recovery pack, followed by New York: Foot traffic to the two cities was just 12.8% and 17.3%, respectively, below May 2019 levels.
But the data also contained some surprises. Atlanta, which saw the biggest YoY visit jump of any analyzed city, pulled into third place – outpacing Washington, D.C. And Houston, the only city to see a YoY decline in visits, fell significantly in the rankings.
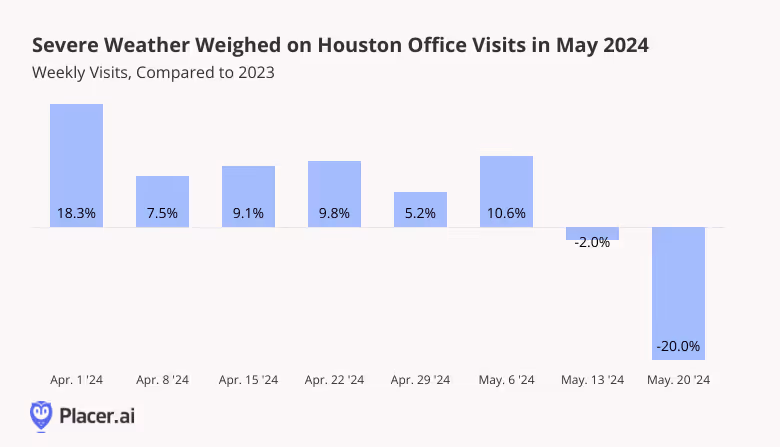
Houston Office Visits Impacted by Storm
Why did Houston YoY office visits drop in May? A look at weekly YoY visits to local office buildings confirms that this was likely due to the extreme weather that engulfed the city during the second half of the month. On Thursday, May 16th, Houston was hit by a particularly violent storm that caused significant damage to the downtown area – breaking windows, downing power lines, and leaving a battered city in its wake. Additional severe weather events pummeled the region as the month wore on – forcing many residents to hunker down at home. And it was when the storm hit that YoY visits began to turn negative, with the week of May 20th seeing a significant 20.0% drop. As the weather improves in the southeast Texas hub, office recovery will likely resume.
Final Thoughts
Five years after COVID upended office routines, employees and companies are still feelingout the ideal balance between WFH and in-person interaction. Will office attendance increase or decrease as the weather warms up?
Follow Placer.ai’s data-driven office analyses to find out.
With summer upon us, we dove into the data to explore Memorial Day foot traffic trends. How did people spend the long weekend? And how did major dining and retail categories fare on the holiday?
Lila Margalit
Jun 4, 2024
3 minutes
With summer upon us, we dove into the data to explore Memorial Day foot traffic trends. How did people spend the long weekend? And how did major dining and retail categories fare on the holiday?
Road Tripping
Gas stations were bustling on Friday, May 24th, as people filled their tanks in anticipation of a long, travel or activity-filled weekend. Visits to gas stations were up 32.3% compared to an average day this year – and the highest they’ve been since January 1st, 2024.
Year over year (YoY), gas station foot traffic increased 1.5%. And compared to pre-COVID, too, gas station visits were up 1.8% – showing that people are once again hitting the road, whether to go on weekend getaways or to visit nearby parks and attractions.
Seeing the Sights
Indeed, Americans partake in many different activities on Memorial Day – from attending parades and memorial events to sight-seeing or enjoying the great outdoors. And visiting museums is a time-honored holiday tradition: On Monday, May 27th, museums nationwide drew a whopping 71.5% more visits than on an average Monday this year.
YoY, Museums were 1.6% busier on May 27th than in 2023 – and museum-goers spent more time exploring the exhibits (who says attention spans are decreasing?), browsing the gift shop, or fueling up at the cafeteria.
Enjoying A Nice Meal
Memorial Day weekend is a prime time for picnics and barbecues. But for many Americans, it’s also an opportunity to enjoy a nice meal at a restaurant with friends and family.
Like on Mother’s Day, full-service restaurants get a much bigger Memorial Day visit boost than either fast-casual eateries or fast-food (QSR) joints. But all three dining segments enjoyed a significant YoY holiday visit increase this year – proving that despite still-high food-away-from-home prices, people are finding room in their budgets to treat themselves on their day off.
Hitting the Sales
And the last Monday in May is, of course, a big day for savings, on everything from big-ticket items like mattresses, furniture, and major appliances, to clothing and other discretionary items. This year, apparel stores saw the biggest Memorial Day visit spike, with foot traffic up 40.5% compared to an average day and 88.2% compared to an average Monday. But home furnishing stores, home improvement stores, electronics retailers, and (to a lesser extent), grocery stores, all experienced considerable holiday visit spikes of their own.
And comparing Memorial Day retail activity to last year shows most of the analyzed categories seeing minor visit increases or holding steady – no small feat in today’s challenging retail environment. Like dining segments, grocery stores impressed with a 9.3% YoY visit increase – perhaps buoyed by consumers buying last-minute ingredients for their picnics or barbecues.
Final Thoughts
People were on the move this year on Memorial Day – fueling up their cars, and enjoying museums, restaurants, and retail sales. What does the rest of the summer hold in store for American consumers?
Follow Placer.ai’s data driven analyses to find out.
We dove into tourism and migration data for Las Vegas, NV to take a closer look at changing visitor and resident populations in the entertainment capital of the world.
Ezra Carmel
Jun 3, 2024
3 minutes
Known as the entertainment capital of the world, Las Vegas has always been a tourist hotspot. But for a growing segment of the population, Vegas is also becoming a popular place to lay down permanent roots. We dove into the tourism and migration data for the region in order to take a closer look at Las Vegas’ changing visitor and resident populations.
Viva Las Vegas: Overnight Stays Are Up
Like many vacation destinations, Las Vegas took a significant tourism hit at the onset of COVID. But with travel restrictions now a thing of the past, visitation to Las Vegas is roaring back.
Analyzing travel to Las Vegas using the Travel & Tourism Report shows that since the halfway mark of 2023, the total number of visit nights spent by travelers in the city (i.e. by those staying up 31 days) have consistently outperformed pre-pandemic levels. And with the sole exception of July 2023, visit nights have increased year-over-year (YoY) as well.
Alongside robust demand for experiences, investment in new, one-of-a-kind entertainment venues like the Sphere – which opened towards the end of 2023 – has likely played a part in reigniting tourism.
High Rollers: A Steady Increase in Affluent Visitors to The Strip
Who are the tourists driving this comeback? To explore the demographic characteristics of today’s visitors to Las Vegas, we zoomed in on the Las Vegas Strip – the iconic epicenter of it all, where most of the city’s luxury hotels, shops, restaurants, and casinos are concentrated.
Analysis of the Strip’s captured market with demographic data from AGS: Demographic Dimensions reveals that as tourist activity in the city began to pick up again, the median household income (HHI) of visitors to the Strip increased steadily. In Q1 2024, the median HHI of visitors to the Strip reached $93.0K, perhaps aided by tourism surrounding this year’s Super Bowl.
This indicates that the Strip is becoming a more upscale visit destination, and that demand for Vegas’ luxury offerings are driving visits. As more consumers with ample discretionary dollars make their way to Vegas, pricey shows – in addition to retail – are likely to become ever-more lucrative advertising opportunities.
Full House: Net-Positive and High-Income Migration to the Region
A tourism boom isn’t the only phenomenon making waves in Sin City. In recent years, more and more out-of-towners have made Greater Las Vegas their home, and unlike some pandemic-era migration hotspots, Las Vegas continues to attract new residents.
Between December 2019 and December 2023, the Las Vegas-Henderson-Paradise CBSA experienced net-positive domestic migration of 3.9%. In other words, the total number of people that moved to Las Vegas over the four-year period from elsewhere in the U.S., minus those that left, was equivalent to 3.9% of the region’s December 2023 population. Meanwhile, analysis of the CBSA’s origin to destination HHI ratio reveals that between December 2019 and December 2023, the median HHI of incoming residents was 20% higher than the median HHI of the local population.
And comparing migration data in December 2023 to December 2020, 2021, and 2022, revealed consistently positive net migration and origin to destination HHI ratios in the years since 2019. This indicates that the Las Vegas-Henderson-Paradise CBSA continues to attract many new and affluent residents. When planning future amenities and services, the region may want to take into account the opportunities – and challenges – presented by these population shifts.
The Desert Oasis Calls
Be it for a quick trip or full-on relocation, Las Vegas remains a prime destination in both the U.S. tourism and domestic migration landscapes. New entertainment venues and amenities keep Vegas top-of-mind for upscale vacationers while economic incentives drive moves from a high-income cohort.
For more tourism and migration insights, visit Placer.ai.
Last summer’s touring sensations Taylor Swift and Beyonce held concerts that will remain in the hearts of many. With thousands in attendance, both live tours were absolute juggernauts. It was like an adrenaline shot for the performing arts category after COVID-induced closures. Remember the days of drive-in concerts as a panacea? While these two reigning Queens of Music took top billing, there are hundreds of local venues around the country that cater to smaller audiences at a time but are no less impactful on their communities. These are the heart and soul for local plays, musicals, symphonies, operas, touring bands, and art exhibitions. Fundraisers are often held at community performance venues, and they can be incubators for performers to move on to a larger stage.
Placer recently attended the California Presenters Conference, which includes representatives from California, Oregon, Washington, Nevada, Arizona, New Mexico, and Texas. Programming directors, events managers, and community liaisons all met to share best practices, challenges, and successes. One box office manager, Jonathan Lizardo of the Lisa Smith Wengler Center for the Arts at Pepperdine University, noted that “Nostalgia” was an important theme at his performing arts center, with a recent live show of the Animaniacs in Concert proving to be a hit with adults and kids alike. In this case, his patrons were seeking some escapism and levity in their lives. On the other end of the spectrum, the arts can also be a powerful way to engage the audience in more serious issues, as one panel on Responding to Global Conflict at arts venues drew a crowd. Another topic of interest was the importance of engaging youth with the arts, through school-sponsored visits or after school enrichment. Many University performing arts centers reps were also in attendance, such as USC Vision and Voices, Stanford Live, Caltech Presents, and Seattle University.
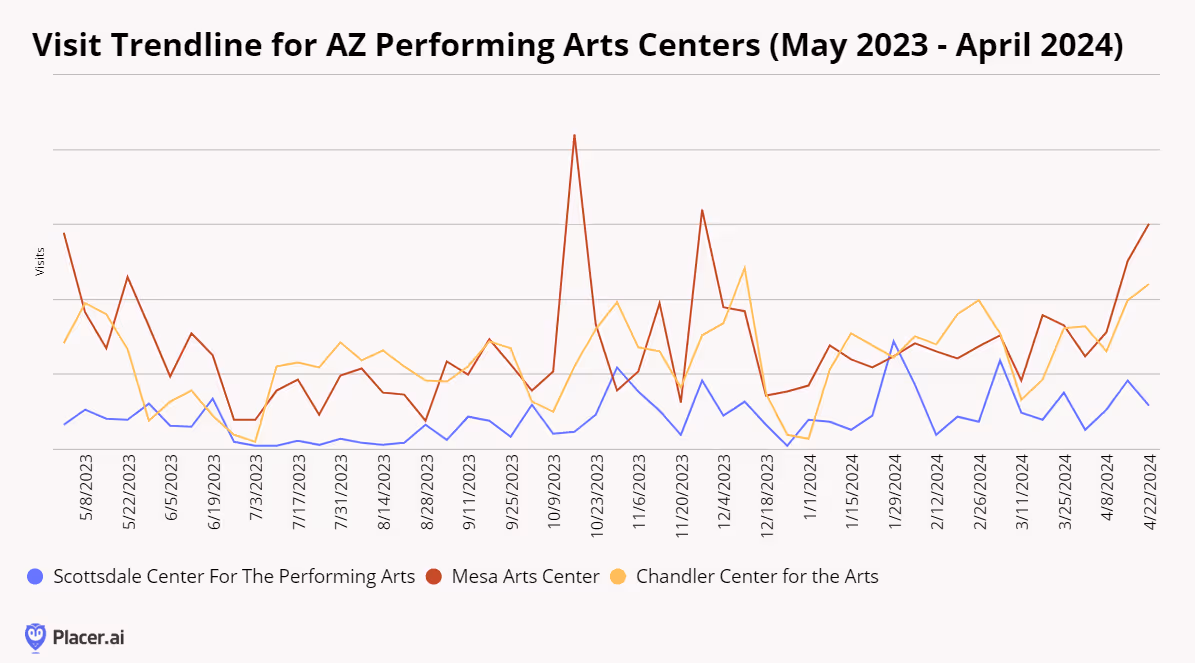
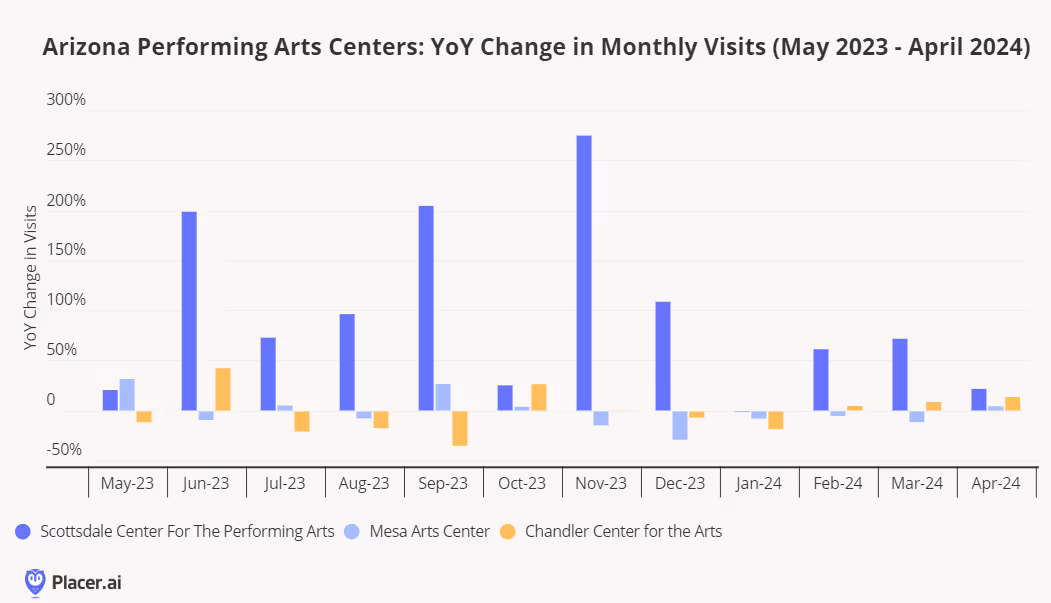
Placer’s presentation touched on macrotrends around discretionary spend, examples of venue attendance around the US, an analysis of the visitation trends, audience profile, and economic impact of Taylor Swift’s US tour, and in depth look at a select group of performing arts centers in Arizona to see the role that they play in their community.
Mesa Arts Center has had the highest overall visitation in the past 12 months. Located in Mesa, AZ, it encompasses over 210,000 sq ft and was completed in 2005 at the cost of $95 million. In addition to four performance venues, it is also home to Mesa Contemporary Arts Museum. Programming is suited to a multitude of interests, including National Geographic Live, Broadway, classical music, popular music, ethnic artists, western artists, and dance. It also offers Art Studio for visual arts classes; Opportunities for Ages 55+ such as flamenco classes; and Festivals and Events, such as Dia de Los Muertos. Within the theaters complex, there are four theaters--the 1,570-seat Tom and Janet Ikeda Theater, 550-seat Virginia G. Piper Repertory Theater, 200-seatNesbitt/Elliott Playhouse, and the 99-seat Anita Cox Farnsworth Studio.
The Chandler Center for the Arts recently celebrated its 35th season. Upcoming performances include ballet like Coppelia or live music, such as Billy Joel’s The Stranger. Entertaining acts such as Stomp, Piano Battle, and Cirque du Soleil will also make their way over during the 2024-2025 season. Located in downtown Chandler, the venue includes three dynamic performance spaces (the 1,500-seat Main Stage, the 350-seat Hal Bogle Theatre, and the 250-seat Recital Hall) as well as two extensive art galleries (The Gallery at CCA and Vision Gallery).
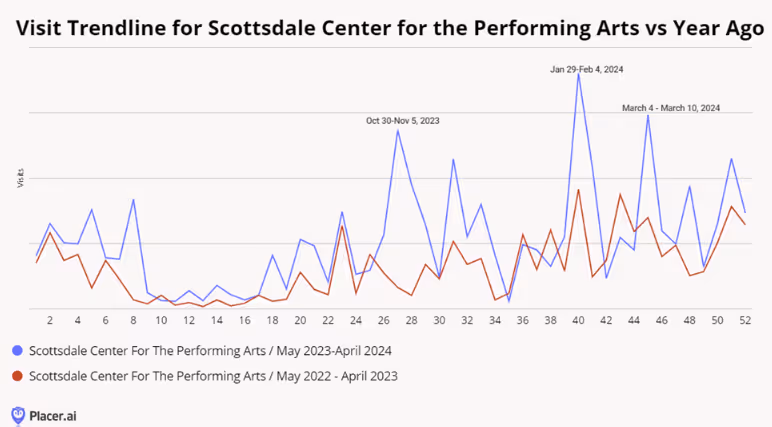
While Scottsdale Center for the Performing Arts had the fewest absolute visits in the past 12 months, its year-over-year variance increase has been the highest.
What might account for the difference, one might wonder. Fortunately, Placer data enables one to compare a venue against itself in order to highlight differences from one year to the next. According to the 2023-2024 calendar, it appears that Hubbard Street Dance Chicago playing 2 nights in a row, was a hit with the audience during the week of Jan 29-Feb 4.
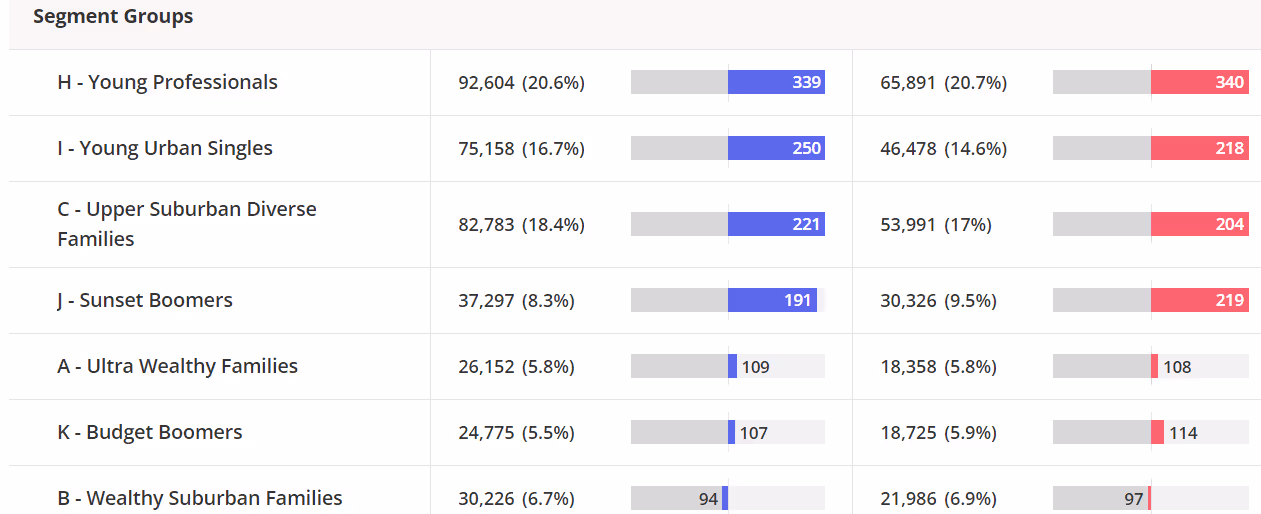
It appears the increase in visits cannot be attributed to a single segment. In fact, visits across multiple segments increased year-over-year when comparing May 2023 - April 2024 (blue) vs. May 2022-April 2023 (red) per Spatial.ai PersonaLive.
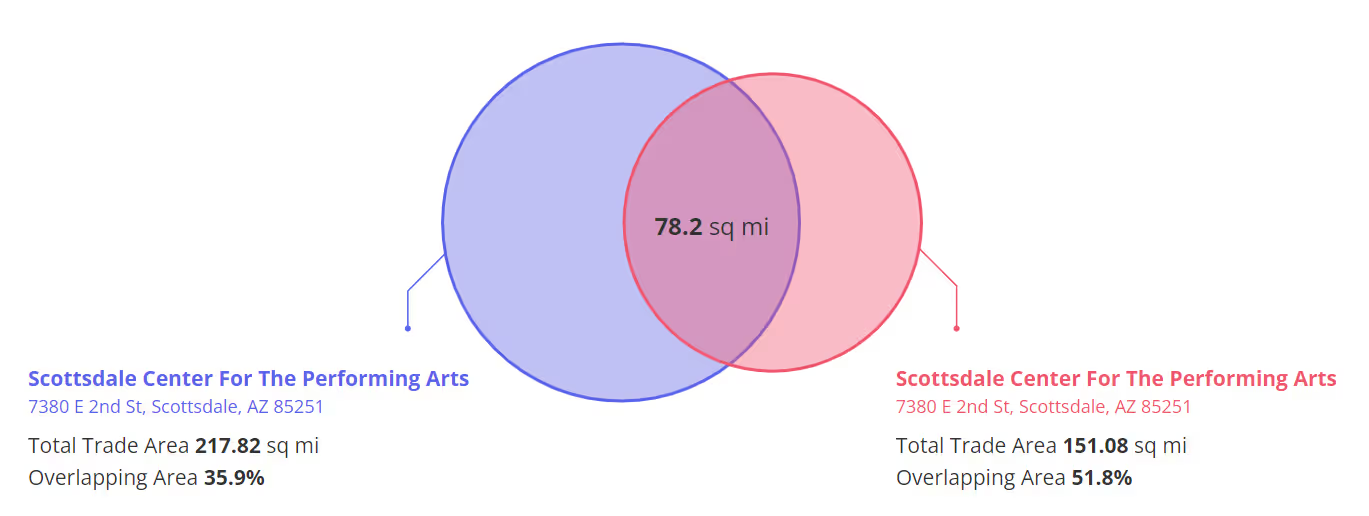
The most recent 12 months also attracted visits from a much larger trade area.
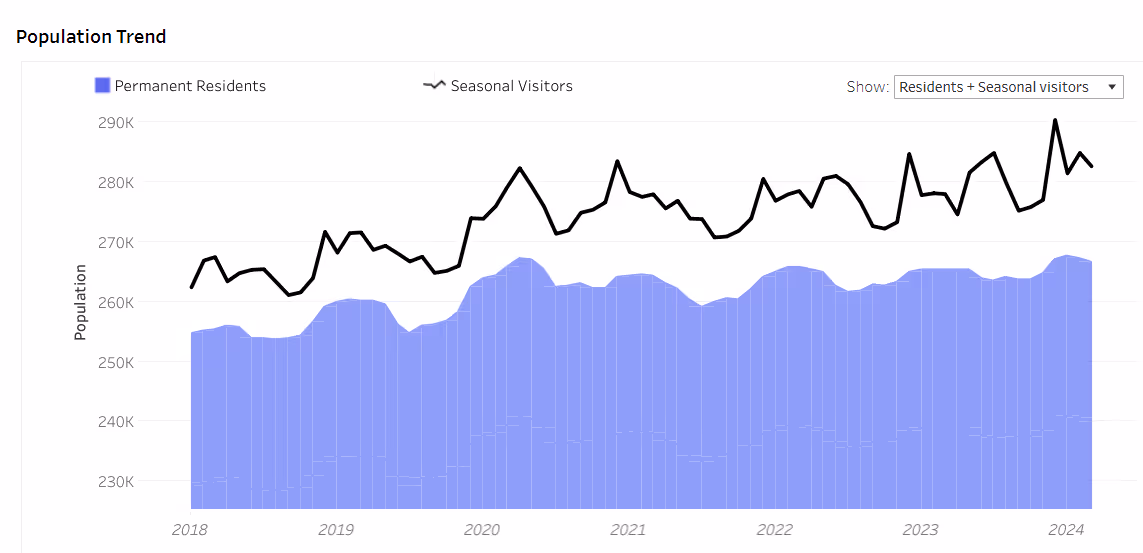
Migration may also be a factor in the increase of visits to the Scottsdale Performing Arts Center. Placer’s Migration Dashboard is noting an increase in both residents and seasonal visitors over the years.
Dive into the data to find out how the dining category is performing in 2025, which segments are coming out on top, and how dining consumer behavior has shifted in recent years.
June 26, 2025
10 minutes
Key Takeaways:
1. Overall dining traffic is mostly flat, but growth is concentrated in specific areas.
While nationwide dining visits were nearly unchanged in early 2025, western states like Utah, Idaho, and Nevada showed moderate growth, while states in the Midwest and South, along with Washington D.C., saw declines.
2. Fine dining and coffee chains are growing through expansion, not just busier locations.
These two segments were the only ones to see an increase in total visits, but their visits-per-location actually decreased, indicating that opening new stores is the primary driver of their growth.
3. Higher-income diners are driving the growth in resilient categories.
The segments that saw visit growth—fine dining and coffee—also attracted customers with the highest median household incomes, suggesting that affluent consumers are still spending on dining despite economic headwinds.
4. Remote work continues to reshape dining habits.
The share of suburban customers at fine dining establishments has increased since 2019, while it has decreased for coffee chains. This reflects a shift towards "destination" dining closer to home and away from commute-based coffee runs.
5. Limited-service restaurants own the weekdays; full-service restaurants win the weekend.
QSR, fast casual, and coffee chains see the majority of their traffic from Monday to Friday, whereas casual and fine dining see a significant spike in visits on weekends.
6. Each dining segment dominates a specific time of day.
Consumer visits are highly predictable by the hour: coffee leads in the early morning, fast casual peaks at lunch, casual dining takes the afternoon, fine dining owns the dinner slot, and QSR captures the late-night crowd.
Year-over-Year Dining Traffic Trends
Dining Visits Mostly Up in the West, Down in Most of Midwest and East
Overall dining visits held relatively steady in the first five months of 2025, with year-over-year (YoY) visits to the category down 0.5% for January to May 2025 compared to the same period in 2024. Most of the country saw slight declines (less than 2.0%), though some states and districts experienced larger drops: Washington, D.C, saw the largest visit gap (-3.6% YoY), followed by Kansas and North Dakota (-2.9%), Arkansas (-2.8%), Missouri and Kentucky (-2.6%), Oklahoma (-2.1%), and Louisiana (-2.0%).
Still, there were several pockets of moderate dining strength, specifically in the west of the United States. January to May 2025 dining visits in Utah, Idaho, and Nevada increased 1.8% to 2.4% YoY, while the coastal states saw traffic rise 0.6% (California) to 1.2% (Washington). Vermont also saw a slight increase in dining visits (+1.9%).
Coffee & Fine Dining See Strongest Overall Visit Growth
Diving into visit trends by dining segment shows that fine dining and coffee saw the strongest overall visit trends, with visits to the segments up 1.3% and 2.6% YoY, respectively, between January and May 2025. But visits per location trends were negative for both segments – a decline of 0.8% YoY for fine dining and 1.8% for coffee during the period – suggesting that much of the visit strength is due to expansions rather than more crowded restaurants and coffee shops.
In contrast, full-service casual dining saw overall visits decrease by 1.5%, while visits per location remained stable (+0.2%) YoY between January and May 2025. Several casual dining chains have rightsized in the past twelve months – including Red Lobster, TGI Fridays, and Outback Steakhouse – which impacted overall visit numbers. But the data seems to show that their rightsizing was effective, as the remaining locations successfully absorbed the traffic and maintained performance levels from the previous year. And the monthly data also provides much reason for optimism, with May traffic up both overall and on a visit per location basis – suggesting that the casual dining segment is well positioned for growth in the second half of 2025.
Meanwhile, QSR and fast casual chains saw similar minor visits per venue dips (-1.5% and -1.2%, respectively). At the same time, QSR also saw an overall visit dip (-0.8%) while traffic to fast casual chains increased slightly (+0.3%) – suggesting that the fast casual segment is expanding more aggressively than QSR. But the two segments decoupled somewhat in May, with overall traffic and visits per venue to fast casual chains up YoY while traffic remained flat and visits per venue fell slightly for QSR – perhaps due to the relatively greater affluence of fast casual's consumer base.
Dining Demographics
Visitor Income Levels Hold Steady in Most Segments
Analyzing the income levels of visitors to the various dining segments over time shows that each segment followed a slightly different trend – and the differences in visitor income may help explain some of the current traffic patterns.
The only three segments with YoY visit growth – casual dining, fine dining, and coffee – also had the highest captured market median household income (HHI). Although the median HHI in the captured market of upscale and fine dining chains fell after COVID, it has risen back steadily over time and now stands at $98.0K – slightly higher than the $97.1K median HHI between January to May 2019. This may explain the segment's resilience in the face of wider consumer headwinds. Meanwhile, the median HHI at fast casual and coffee chains has fallen slightly, perhaps due to aggressive expansions in the space – including Dave's Hot Chicken and Dutch Bros – which likely broadened the reach of the segments, driving visits up and trade area median HHI down.
Like fine dining, casual dining also saw its trade area median HHI increase slightly over time – but the segment has still been facing visit dips. This could mean that, even though consumers trading down to casual dining may have boosted the trade area median HHI for the segment, it still might not have been enough to make up for the customers lost to tighter budgets.
The QSR segment saw its trade area median HHI remain remarkably steady – and visits to the segment have also been quite consistent – staying between $70.6K and $70.9K between 2019 and 2025 – which may explain why the segment's visits remained relatively stable YoY.
Suburban Dining Patterns
Diving into the psychographic segmentation shows that, although the fine dining segment attracted visitors from the highest-income areas between January and May 2025, fast casual chains drew the highest share of visitors from suburban areas, followed by casual dining and coffee. QSR attracted the smallest share of suburban visitors, with just 30.5% of the category's captured market between January and May 2025 belonging to Spatial.ai: PersonaLive suburban segments.
But looking at the data since 2019 reveals small but significant changes in the shares of suburban audiences in some categories' captured markets. And although the percentage changes are slight, these represent hundreds of thousands of diners every year.
The data shows that shares of suburban segments in the captured markets of fine dining chains have increased, while their share in the captured market of coffee chains has decreased. The shares of suburban visitors to QSR, fast casual, and casual chains have remained relatively steady.
This may suggest that the COVID-19 pandemic and the subsequent rise of remote and hybrid work models are still impacting consumer dining habits, benefiting destination-worthy experiences in suburban locales such as fine dining chains while reducing the necessity of daily coffee runs that were often tied to commuting and office work. Meanwhile, the stability in QSR, fast casual, and casual dining segments could indicate that these categories continue to meet consistent suburban demand for convenience and everyday dining, largely unaffected by the redistribution seen in the fine dining and coffee sectors.
Dining Consumer Behavior Trends
Although QSR, fast casual, casual dining, fine dining, and coffee all fall under the wider dining umbrella, the data shows distinct consumer behavior patterns regarding visits to these five categories.
Limited Service Leads Weekday Visit Share, Full Service Rules the Weekend
Limited service segments, including QSR, fast casual, and coffee tend to see higher shares of visits on weekdays, while full service segments – casual dining and fine dining – receive higher shares of weekend visits. Diving deeper shows that QSR has the largest share of weekday visits, with 72.3% of traffic coming in between Monday and Friday, followed by fast casual (69.8% of visits on weekdays) and coffee (69.4% of visits on weekdays.) Looking at trends within the work week shows that QSR receives a slightly larger visit share between Monday and Thursday compared to the other limited service segments. Meanwhile, coffee seems to receive the smallest share of Friday visits – 16.3% compared to 17.0% for fast casual and 17.2% for QSR.
On the full-service side, casual dining and fine dining chains have relatively similar shares of weekend visits (39.0% and 38.8%, respectively), but fine dining also sees an uptick of visits on Fridays (with 19.1% of weekly visits) as consumers choose to start the weekend on a festive note.
Each Segment Owns a Different Daypart
Hourly visit patterns also show variability between the segments. Coffee is the unsurprising leader of early visits, with 14.6% of visits taking place before 8 AM and, almost two-thirds (64.9%) of visits taking place before 2 PM. Fast casual leads the lunch rush (29.4% of visits between 11 AM and 2 PM), casual dining chains receive the largest share of afternoon (2 PM to 5 PM) visits, and fine dining chains receive the largest share of dinner visits, with almost 70% of visits taking place between 5 PM and 11 PM. QSR leads the late night visit share – 4.1% of visits take place between 11 PM and 5 AM – followed by casual dining chains (3.2% late night and overnight visit share), likely due to the popularity of 24-hour diners.
This suggests that each dining segment effectively "owns" a different part of the day, from the morning coffee ritual and the quick lunch break to the leisurely evening meal and late-night cravings.
Shorter Visits in Most Segments
An analysis of average visit duration also reveals a small but lasting shift in post-pandemic dining behavior. Between January and May 2025, the average dwell time for nearly every dining segment was shorter than during the same period in 2019. This efficiency trend is evident across limited-service categories like QSR, fast casual, and coffee shops, suggesting a continued emphasis on speed and convenience.
The one notable exception to this trend is upscale and fine dining, where the average visit duration has actually increased compared to pre-COVID levels. This may suggest that, while visits to most segments have become more transactional, consumers are treating fine dining more as an extended, deliberate experience, reinforcing its position as a destination-worthy occasion.
Dive into the data to see how consumer response to major promotional events – from Black Friday and the back-to-school shopping rush to brand-crafted LTOs – varies by market.
June 19, 2025
Key Takeaways
1. The Midwest is the only region where Black Friday retail visits outpace Super Saturday.
But several major Midwestern markets, including Chicago and Detroit, actually see higher shopper turnout on Super Saturday.
2. Holiday season demographic shifts also vary across regions.
Nationwide, electronics stores see a slight uptick in median household income (HHI) in December – yet in certain markets, electronics retailers such as Best Buy see a drop in captured market median HHI during this period.
3. Back-to-school shopping starts earliest for clothing and office supplies retailers in the South Central region, likely tied to earlier school schedules.
But back-to-school visits surge higher for these retailers in the Northeast later in the season.
4. The share of college students among back-to-school shoppers varies by region.
In August 2024, “Collegians” made up the largest share of Target’s back-to-school shopping crowd in New England, and the smallest in the West.
5. Mother’s Day drives the biggest restaurant visit spikes in the Middle Atlantic Region, while Father’s Day sees its biggest boosts in the South Atlanticstates.
Mother’s Day diners also tend to travel farther to celebrate, suggesting an extra effort to treat mom.
6. Western states proved particularly responsive to McDonald’s recent Minecraft promotion.
During the week of A Minecraft Movie’s release, the promotion drove significantly higher visit spikes in the West than in the Eastern U.S.
Zooming in on Local Trends
Retailers rely on promotional events to fuel sales – from classics like Black Friday and back-to-school sales to unique limited-time offers (LTOs) and pop-culture collaborations. Yet consumer preferences and behavior can vary significantly by region, making it critical to tailor campaigns to local markets.
This report dives into the data to reveal how consumers in 2025 are responding to major retail promotions, exploring both broad regional trends and more localized market-level nuances. Where is Black Friday most popular, and which areas see a bigger turnout on Super Saturday? Where are restaurants most packed on Mother’s Day, and where on Father’s Day? Which region kicks off back-to-school shopping – and where are August shoppers most likely to be college students? And also – which part of the country went all out on McDonald’s recent Minecraft LTO?
Read on to find out.
The Holiday Season: A Regional Story
Promotions aimed at boosting foot traffic on key holiday season milestones like Black Friday and Super Saturday are central to retailers’ strategies across industries. The day after Thanksgiving and the Saturday before Christmas typically rank among in-store retail’s busiest days, last year generating foot traffic surges of 50.1% and 56.3%, respectively, compared to a 12-month daily average. And
But a closer look at regional data shows that these promotions land differently across the country. In the Midwest, Black Friday outperformed Super Saturday last year, fueling the nation’s biggest post-Thanksgiving retail visit spike – a testament to the milestone’s strong local appeal. Meanwhile, in the Western U.S. Black Friday trailed well behind Super Saturday, though both milestones drove smaller upticks than in other regions. And in New England and the South Central states, Super Saturday achieved its biggest impact, suggesting that last-minute holiday specials may resonate especially well in that area.
Plenty of Local Variety
Digging deeper into major Midwestern hubs shows that even within a single region, holiday promotions can produce widely different responses.
In St. Louis, Indianapolis, and Minneapolis, for example, consumers followed the broader Midwestern pattern, flocking to stores on Black Friday exhibiting less enthusiasm for Super Saturday deals. By contrast, Chicago and Detroit saw Super Saturday edge ahead, with Chicago’s Black Friday peak falling below the nationwide average of 50.1%. examples highlight the power of local preferences to shape holiday campaign results.
Differing Demographic Shifts Across Regions
Holiday promotions don’t just drive visit spikes; they also spark subtle but significant changes in the demographic profiles of brick-and-mortar shoppers, expanding many retailers’ audiences during peak periods. And these shifts, too, can vary widely across regions.
Outlet malls, department stores, and beauty & self-care chains, for instance, which typically attract higher-income consumers, tend to see slight declines in the median household incomes (HHI) of their visitor bases in December. This dip may be due to promotions drawing in more mid- and lower-income shoppers during the peak holiday season. Electronics stores and superstores, on the other hand, which generally serve a less affluent base, see modest upticks in median HHI in the lead-up to Christmas.
But once again, drilling further down into regional chain-level data reveals more nuanced regional patterns. Take Best Buy, a leading holiday season electronics destination. In some of the chain’s biggest, more affluent markets – including New York, Los Angeles, and Chicago – the big-box retailer sees small dips in median HHI during December. But in Atlanta and Houston – also relatively affluent, but slightly less so – December saw a minor HHI uptick, hinting at a stronger holiday rush from higher-income shoppers in those cities.
Back-to-School Bonanzas
Back-to-school promotions also play a pivotal role in the retail calendar, with superstores, apparel chains, office supply stores and others all vying for shopper attention. And though summer markdowns drive increased foot traffic nationwide, both the timing of these shifts and the composition of the back-to-school shopping crowd differ among regions.
A Southern Head Start
Analyzing weekly fluctuations in regional foot traffic to clothing and office supplies stores shows, for example, that back-to-school shopping picks up earliest in the South Central region, likely due to earlier school start dates.
But the biggest visit peaks occur in the Northeast – with clothing retailer foot traffic surging in New England in late August, and office supplies stores seeing an even bigger surge in the Middle Atlantic region in early September. Retailers and advertisers can plan their back-to-school deals around these differences, targeting promotions to local trends.
A New England Collegian Affair
Though K-12 families drive much of the back-to-school rush, college student shoppers also play a substantial role. And here, too, their participation varies by region.
For instance, the “Collegians” segment accounted for 2.2% of Target’s shopper base nationwide over the past year – rising to 3.0% in August 2024. But regionally, the share of “Collegians” soared as high as 4.0% in New England versus just 2.2% in the West. So while retailers in New England may choose to lean into the college vibe, those in Western states may place greater emphasis on families with children.
Mother’s Day and Father’s Day: Differing Dining Peaks
When it comes to dining, Mother’s Day and Father’s Day are the busiest days of the year for the full-service restaurant (FSR) category, as families treat their parents to a hassle-free meal out. And eateries nationwide capitalize on this trend by offering a variety of deals and promotions that add a little extra charm (and value) to the experience.
Atlantic Specials
Nationwide, Mother’s Day drives more FSR foot traffic than Father’s Day – except in parts of the Pacific Northwest, where Father’s Day traditions run especially deep. Still, the size of these holiday boosts varies substantially by region.
This year, for instance, Mother’s Day (May 11, 2025) drove the largest FSR surge in the Middle Atlantic, with the South Atlantic and Midwest not far behind. Father’s Day, by contrast, saw its biggest lift in the South Atlantic. Mother’s Day proved least resonant in the West, whereas Father’s Day had its smallest impact in New England.
Going the Extra Mile for Mom
Dining behavior also differs between the two occasions. Mother’s Day celebrants display a slight preference for morning FSR visits and a bigger one for afternoon visits, while Father’s Day crowds favor evenings – perhaps reflecting a preference for sports bars and later dinners with dad. Another interesting nuance: On Mother’s Day, a larger share of FSR visits originate from between 3 and 50 miles away compared to Father’s Day, suggesting that families go the extra mile – sometimes literally – to celebrate mom.
Self-Styled Celebrations: Driving Traffic with DIY Milestones
While established dates like Black Friday or Mother’s Day naturally spur promotions, brands can also craft their own moments with limited-time offers (LTOs). And much like holiday campaigns, these retailer-led events can produce varied outcomes across different regions.
Fast food restaurants, for example, have leaned heavily on limited-time offers (LTOs) and pop-culture tie-ins to fuel buzz in what remains a challenging overall market. And McDonald’s recent Minecraft promotion, launched on April 1, 2025 to coincide with the April 3 release of A Minecraft Move, shows just how impactful the practice can be.
Nationally, the Minecraft promotion (featuring offerings for both kids and adults) drove a 6.9% lift in visits during the movie’s opening week. But the impact of the promotion was far from uniform across the U.S. Many of McDonald’s Western markets – including Utah, Idaho, Nevada, California, Texas, Arizona, Colorado, and Oregon – recorded visit lifts above 10.0%. Meanwhile, Kentucky saw a 2.1% dip, and several other Eastern states registered modest gains below 3.0%. The McDonald’s example illustrates the power of regional tastes to shape the success of even the most creative pop-culture collabs.
Adopting a Regional Lens
Whether it’s properly timing holiday and back-to-school discounts, recognizing where Mother’s Day or Father’s Day will resonate more, or pinpointing markets that respond best to pop-culture tie-ins, the data reveals that effective promotions depend heavily on local nuances. And by analyzing regional and DMA-level trends, retailers and advertisers can craft compelling, relevant campaigns that heighten engagement where it matters most.
Discover how mall anchors are transforming in 2025 – and how a foot-traffic-focused approach to choosing key tenants can drive visits and shopper engagement.
May 29, 2025
8 minutes
Key Takeaways
1. Experiential and niche retailers can deliver anchor-level traffic. At Towne East Square Mall, the addition of a Scheels in 2023 significantly increased foot traffic and long-distance travelers, while Barnes & Noble at Coronado Center in Albuquerque has become a key driver of both foot traffic and higher-spend demographics.
2. Size isn’t everything – especially for dining venues. At Glendale Galleria and Northridge Fashion Center, smaller restaurants attracted more foot traffic than some traditional anchors.
3. Refocusing on tenants’ actual traffic contributions enables a flexible anchor approach. Balancing weekend draws like Scheels with weekday favorites such as Costco or Chick-fil-A can help maintain steady visitor flow throughout the week. Similarly, onsite fitness clubs can shift traffic to earlier in the day – an opportunity to adjust store hours and capture additional morning shoppers.
4. Temporary pop-ups can form an integral part of a visit-focused anchor strategy. The Barbie Dreamhouse Living Truck Tour generates mall visit spikes well above typical Saturday levels. Operators can integrate these events into their overall anchor strategies, offering preferential terms to high-performing pop-ups.
5. New tenants can boost traffic for existing stores in similar categories. After Aldi joined Green Acres Commons in February 2020, visits to an existing BJ’s Wholesale Club trended upwards. This synergy highlights how overlapping audiences can become a strength, creating a larger overall customer base.
The Retail Comeback Kid
Malls, it seems, are cool once again. After languishing in the wake of the pandemic, shopping centers across the country are thriving – reinventing themselves as prime “third places” where people can hang out, shop, and grab a bite to eat.
One key driver behind this resurgence is a shift in how malls view their anchor tenants. While traditional mainstays like Macy’s and JCPenney still play an important role, specialized offerings – from popular eateries to fitness centers and immersive retailtainment destinations – are increasingly taking center stage. These attractions maximize the experiential value that brick-and-mortar venues can deliver, driving visits and sales for the center as a whole.
Against this backdrop, this report leverages the latest location intelligence data to explore the types of tenants that can function as mall anchors in 2025. Should mall operators still focus on general merchandisers to draw crowds, or can dining chains and more niche retailers also do the job? How important is square footage in identifying the anchor-like tenants in a shopping center? And how can a visit-focused approach help mall operators select effective anchor or anchor-like tenants – whether to fill big-box spaces or to leverage the leasing perks traditionally reserved for major large-format chains?
Out-of-the-(Big)-Box Visit Drivers
One of the most important functions of a mall anchor is to ensure steady visitation – providing its smaller tenants with a constant flow of potential customers. And as the role of the mall continues to evolve, analyzing the actual foot traffic impacts of different types of businesses can help identify the kinds of non-traditional anchors best suited to fulfill that purpose.
The Power of a Well-Placed Scheels
Experiential venues, for example, are particularly well-poised to serve as powerful anchors in today’s retail environment – as illustrated by the visit surge experienced by Towne East Square Mall in Wichita, KS following the addition of a Scheels in July 2023.
By blending traditional retail with immersive experiences, Scheels has emerged as a true experiential destination. And this pull has also helped the mall draw more long-distance visitors willing to travel to enjoy Scheels’ offerings. In 2024, 41.9% of the mall’s customers traveled more than 50 miles to visit, compared to 35.8% back in 2018 when Sears occupied the same lot.
Scheels Anchor Brings Substantial Visit Boost to Towne East Square Mall in Wichita, KS, Attracting Visitors From Further Away
Visits to Towne East Square Mall Compared to Q1 2018 Baseline
Share of Visitors From 50+ Miles Away
Share
Embed:
The Barnes & Noble Effect
Traditionally, anchors aimed to please the widest possible audiences – with department stores, big-box chains, and grocery stores leading the way. But visitation data shows that niche concepts can also deliver anchor-level traffic if they’re compelling enough to attract dedicated fans.
The experience of the Barnes & Noble at Coronado Center in Albuquerque, NM is a case in point. After being written off as all but obsolete, Barnes & Noble has staged an impressive comeback in recent years, finding success through a more curated, localized approach to book selling. And despite not being a formal anchor, the Coronado Center Barnes & Noble accounted for 7.9% of visits to the mall in 2024 – outperforming both Macy’s and JCPenney.
Year-over-year data also shows foot traffic surging at the Coronado Center Barnes & Noble, lifting overall visitation to the mall. And demographic data reveals that the bookstore draws a more affluent audience than either the center as a whole or the two department stores – attracting a crowd with more spending power.
This example also illustrates how smaller tenants can sometimes draw larger crowds. Even though Barnes & Noble occupies a smaller onsite space than either Macy’s or JCPenney, it is proving a powerful visit driver out of proportion to its physical size.
Dining Chains Punching Above Their Size
Dining chains are also adept at punching above their square footage – often attracting crowds disproportionate to their size.
Despite its relatively small footprint, for example, the In-N-Out Burger at Glendale Galleria drew an impressive 8.6% of visits to the mall complex in 2024, outpacing some of the mall’s official anchors like DICK’s Sporting Goods, Macy’s, and JCPenney. Still, the onsite Target drew even larger crowds at 14.4% of visits.
A similar pattern emerged at Northridge Fashion Center, where Porto’s Bakery and Cafe captured a notable 15.6% of visits to the complex in 2024 – more than some of the center’s traditional department stores.
These examples underscore the potential for dining chains, which typically require less space, to serve as micro-anchors by consistently attracting outsized crowds – a key consideration for mall operators looking to sustain visitor traffic.
Choosing a Mall Anchor in 2025
Refocusing on tenants’ actual foot traffic contributions also opens the door to a more flexible and dynamic approach to anchor selection and management – one that considers each venue’s unique visitation patterns.
The Weekend/Weekday Divide
Seasonal factors, for example, can make certain anchors more powerful at specific times of the year, while different venues shine on particular days of the week.
At Jordan Creek Town Center in West Des Moines, Iowa, for instance, Scheels and Costco each delivered just under 20.0% of the complex’s overall visits in 2024. But the two retailers’ daily patterns differed significantly: Scheels saw bigger crowds on weekends, while Costco was the primary weekday destination.
Understanding differences like these can help operators optimize their tenant mix to maintain a balanced flow of shoppers throughout the week.
Another example of the impact of differing weekday traffic patterns is offered by the impact of mall-based Chick-fil-A locations on the distribution of mall visits throughout the week.
Despite its relatively small size, Chick-fil-A draws substantial traffic to malls. And after adding Chick-fil-A locations, both Northridge and Miller Hill Malls saw meaningful drops in the share of visits to the centers taking place on Sundays – even as the wider indoor mall segment saw slight upticks.
Recognizing this trend could prompt mall operators to compensate by adding more weekend-friendly traffic drivers – or to lean into this distinction by taking additional steps to bolster the mall’s role as a go-to weekday destination.
The Early-Morning Fitness Advantage
The power of different mall traffic magnets also varies throughout the day. Increasingly, shopping centers are turning to fitness centers as experiential anchors. And since many people work out early in the morning, these gyms are having a significant impact on the distribution of mall visits across dayparts.
The addition of gyms to Northshore Mall in Peabody, MA and Jackson Crossing in Jackson, MI, for instance, led to a significant rise in visits between 7:00 AM and noon. And though the rest of the stores in these malls typically open at 10:00 or 11:00 AM, this shift presents the centers with a significant opportunity.
By adjusting opening hours to accommodate these early-morning patrons, malls can capitalize on this added traffic, driving up visits and sales for relevant tenants – especially health-focused retailers such as juice bars and sporting goods stores.
Adding Temporary Pop-Ups Into the Mix
Adopting a broader, visit-focused view of anchoring also allows mall operators to apply some of the strategies typically reserved for anchors to non-conventional traffic-generating businesses, to ensure a consistent flow of traffic year-round.
Pop-up stores and events, for example, generally don’t follow the same seasonal trends as other retailers – instead, they generate short-term visit boosts during their runs, whenever in the year that may be. And a visit-focused anchor strategy can leverage some of the perks traditionally reserved for anchor tenants – such as preferential leasing terms – to complement traditional full-time anchors during slower retail periods.
The Barbie Dreamhouse Living Truck Tour is a prime example of a traffic-driving pop-up. By bringing exclusive merchandise to malls across the U.S., the truck generates plenty of buzz, drawing crowds eager to snatch up limited-edition items and immerse themselves in all things Barbie. As a result, malls hosting the tour often see significant visit spikes, with foot traffic surging well above typical Saturday levels. Well-timed pop-ups like these can help balance out traffic throughout the year, offsetting traditional slow periods.
Creating a Bigger Visit Pie
A visit-focused approach to anchor management can also help mall operators assess the potential impact of new tenants on existing stores operating in similar categories. For example, mall owners often worry that new tenants operating in similar categories might cannibalize existing businesses. But a visit-focused anchor approach reveals that a well-chosen addition can sometimes benefit current tenants – especially if they cater to similar audiences.
In February 2020, for instance, value supermarket Aldi opened at Green Acres Commons in Valley Stream, NY – a center that already hosted budget-friendly BJ’s Wholesale Club. While BJ’s visits were relatively flat in 2018 and 2019, they began to rise after Aldi’s opening (and following a pandemic-induced dip). Cross-shopping data also shows that Aldi customers were more likely to visit BJ’s than the average Green Acres patron last year.
This synergy may be due in part to the two retailers’ similar visitor bases: In 2024, the Aldi and BJ’s stores in Green Acres Common drew shoppers with comparable economic profiles. This suggests that overlapping audiences can become a strength if aligned brands attract new shoppers, who then explore multiple stores in the same center.
Visits to BJ's Wholesale Club Took Off After Addition of Aldi to Green Acres Commons – Perhaps Buoyed by Audience Similarity
Visits to Green Acres Commons BJ's Wholesale Club, Compared to Q1 2018 Baseline
Median HHI, 2024*
Cross-Shopping, 2024
*Median HHI based on STI: PopStats dataset combined with Placer.ai data for captured trade areas.
Looking ahead, effective mall anchors will be defined less by physical footprint and more by their capacity to maintain consistent, valuable foot traffic. While traditional department stores remain pivotal, smaller or niche brands can often rival – or surpass – large-format retailers. And by thinking out of the anchor box and choosing tenants that cultivate a balanced visitor flow and align with local preferences, operators can position their centers as true go-to destinations.


.svg)


.avif)


