Find out how restaurant operators can position their brands for long-term success in an increasingly competitive landscape.
R.J. Hottovy
Feb 21, 2025
5 minutes
2024 was a challenging year for the restaurant industry, marked by increased competition from other food retail channels, intensified value wars, and rising operational costs, all of which contributed to a surge in bankruptcies. The start of 2025 has been equally difficult.
Despite these challenges, our data continues to show strong consumer demand for dining out. However, the way consumers interact with restaurants is evolving more than ever before. Below, we highlight several key shifts in consumer behavior that restaurant operators, suppliers, and investors should consider in the year ahead.
How to Balance Convenience Versus Experience?
With Starbucks' renewed focus on its coffeehouse roots under CEO Brian Niccol, an important question emerges: have today’s restaurants become too complex? Starbucks originally built its brand as a “third place” away from home and work – an inviting space for customers to gather. However, this focus began shifting about a decade ago with the rollout of Mobile Order and Pay. As e-commerce surged in the early 2010s, consumers became accustomed to making purchases online or via mobile apps, making digital ordering a necessity for most retailers and restaurants. Yet, prioritizing convenience through mobile ordering and pickup created a disconnect with Starbucks’ experience-driven identity, leading to friction between its convenience-oriented and experience-focused customers.
This tension between experience and convenience has been a challenge for many restaurant operators in recent years. It explains why QSR chains have reduced store footprints while expanding drive-thru capacity, why fast-casual and casual-dining restaurants have increasingly adopted pickup and drive-thru windows, and why many chains now allocate dedicated space for delivery orders. Even Darden, long resistant to third-party delivery, ultimately embraced it to adapt to changing consumer behavior.
Visitation trends in 2024 reinforced the difficulty of balancing experience and convenience within the same restaurant model. Among chains with more than 100 locations, those with the highest year-over-year (YoY) growth in visits per location were largely drive-thru specialists, such as Raising Cane’s, In-N-Out Burger, 7 Brew Coffee, and PJ’s Coffee. Meanwhile, non-drive-thru leaders like CAVA and Chipotle thrived by focusing on customization, underscoring that consumers are willing to pay a premium for personalized experiences that align with their preferences.
The rise of convenience-based restaurants does not signal the end of experiential dining – far from it. Below, we’ve outlined monthly year-over-year (YoY) visit trends for major restaurant categories in 2024. While QSR value wars dominated industry headlines throughout the year, casual- and fine-dining chains actually outperformed the QSR segment in YoY visit growth.
Some of this success can be attributed to well-executed promotions, such as Chili’s "3 for Me" deal – which helped the chain finish just behind Raising Cane’s in visit-per-location growth for 2024 – and Buffalo Wild Wings’ "All You Can Eat Wings" promotion. However, the strong YoY performance of fine-dining chains further underscores that experience-driven dining remained highly in demand throughout the year.
We also see this trend reflected in dwell time across the restaurant industry. With the rise of drive-thru and takeout orders during and after the pandemic, combined with advancements in mobile ordering technology, it’s no surprise that dwell times for limited-service restaurants have remained below pre-pandemic levels (below). However, the opposite is happening in full-service restaurant categories, where dwell times are on par with or even exceeding pre-pandemic levels.
While many casual dining chains have seen an increase in takeout and delivery orders over the past few years, the growth of experiential dining concepts like Kura Sushi and GEN Korean BBQ, along with the continued expansion of eatertainment venues such as Topgolf, Puttshack, and Pinstripes—where dwell times often exceed 90 minutes—has helped maintain overall category dwell times. Meanwhile, the increase in dwell time for fine-dining establishments suggests that guests are making the most of their time when dining out, reinforcing the growing consumer preference for experience over convenience.
“Familiarity” and Its Impact on New Store Contribution
We've previously highlighted the importance of familiarity in consumer dining decisions, particularly in a challenging macroeconomic environment. With years of elevated inflation across food, rent, healthcare, and insurance, consumers have fewer discretionary dollars to spend. As a result, when they choose to dine out, they gravitate toward brands they know and trust.
In collaboration with the team at Bloomberg Second Measure, we analyzed data on the percentage of revenue generated from new customers at both full-service and limited-service restaurants. Our findings revealed a noticeable decline in new customer revenue during the second half of 2024, further reinforcing the idea that consumers are prioritizing familiarity when making dining choices.
This preference for familiar brands may be creating challenges for restaurant chains expanding into new markets. Traditionally, a new restaurant location in an unfamiliar market could expect to generate around 75% of the sales/visits seen in an established market—after an initial “honeymoon” phase when consumers try the brand for the first time. However, our data suggests that visit trends for restaurants entering new markets are now significantly lower than historical averages. Unsurprisingly, many operators have told us that their 2025 expansion plans will prioritize in-filling existing markets rather than expanding into new ones.
Portillo’s—the Chicago-based chain known for its Chicago-style hot dogs, Italian beef sandwiches, and char-grilled burgers—has experienced mixed visit trends when entering new markets. Below, we present visit per location trends for Portillo’s nationwide, in its home market of Chicago, and in several states where it has expanded in recent years. In its latest investor presentation, Portillo’s acknowledged that its average unit volumes are highest in its home market ($11.3 million in sales per location), compared to other Midwest markets ($6.0 million) and Sunbelt locations ($6.6 million). While these figures are still strong, they reflect the broader challenge that many restaurant brands face when expanding beyond their core markets.
Conclusion
As the restaurant industry navigates 2025, operators must strike a delicate balance between convenience and experience while adapting to shifting consumer preferences. The demand for dining out remains strong, but consumers are making more intentional choices, favoring trusted brands and prioritizing either speed and efficiency or immersive, experiential dining. At the same time, new market expansion presents growing challenges, with visit trends suggesting a preference for familiarity over novelty. As brands refine their strategies, those that successfully integrate innovation with operational excellence—whether through streamlined digital convenience, compelling promotions, or differentiated in-store experiences—will be best positioned for long-term success in an increasingly competitive landscape.
Find out what's been driving the continued success at Sprouts at Dutch Bros.
Bracha Arnold
Feb 20, 2025
3 minutes
Sprouts Farmers Market and Dutch Bros. have seen impressive foot traffic growth over the past few years. We analyzed their visitation metrics for 2024 to understand what’s driving their continued success.
Continued Visit Dominance
Both Sprouts and Dutch Bros. posted impressive visitation numbers throughout 2024, with visits for the full year elevated by 7.3% and 15.8%, respectively, compared to 2023. This momentum caps off several years of sustained growth – particularly for Dutch Bros. – which has expanded rapidly while maintaining consistent foot traffic increases. And though average visits per location at Dutch Bros. were slightly down YoY in 2024, the visit gaps were relatively modest – indicating that the chain is succeeding in expanding with minimal cannibalization to its existing venues.
Sprouts also expanded with dozens of new stores over the past year – and the chain’s foot traffic metrics suggest strong shopper interest in these openings. The health-forward grocer saw visits per location rise in the second half of the year, capping off Q4 2024 with a 5.0% YoY increase.
The two chains have kept their visit growth going into the new year. Weekly visits to both Sprouts and Dutch Bros. grew all weeks analyzed, a promising sign as 2025 gets underway.
New Smoothie Kings
Smoothies are having a major moment, fueled by the growing nationwide focus on health and wellness – an area where Sprouts has successfully positioned itself as a leader. Now, the chain is doubling down on its wellness-focused strategy by introducing smoothies at select locations.
Many Sprouts locations offer smoothies to go – but the chain has also been investing in in-store smoothie bars, allowing shoppers to enjoy a fresh, healthy drink while browsing or take one on the go. Visits to a Cerritos, California location jumped following the introduction of a smoothie bar in January 2025, with YoY monthly visits exceeding the Sprouts nationwide average for the first time in the analyzed period – perhaps thanks to excited reviews posted on social media.
By offering smoothies that are more affordable than some of the viral options trending online, Sprouts is solidifying itself as a go-to destination for shoppers seeking wellness-driven choices without breaking the bank.
Dutch Bros.’ Morning Brew
While Sprouts is expanding into new beverage categories, Dutch Bros is focusing on building out its food offerings. The chain has traditionally been strongest in the afternoon and evening, bucking the usual trends for caffeine-focused brands. To that end, Dutch Bros. has focused on attracting more morning visitors, both by expanding its mobile ordering capabilities and by testing a new food menu in select locations.
The data suggests that the company’s focus on the morning daypart may amplify changes in Dutch Bros. consumer behavior that are already underway. Between January 2024 and January 2025, the share of visits during morning hours saw a small but meaningful uptick. The share of visits during the 6:00 AM to 11:00 AM daypart grew from 28.4% to 29.5% of daily visits, while the share of evening visits (4:00 PM to 9:00 PM) decreased. While the brand still maintains a strong presence later in the day, this shift could be a sign that Dutch Bros is successfully nudging consumers toward earlier-day coffee runs.
Drink To That
Sprouts and Dutch Bros. are thriving by gearing their offerings to their customer bases. By leaning into health-forward beverages and early-morning visits, the two chains are driving visits and interest.
The off-price apparel space remains well-positioned as consumers continue to favor budget-friendly retailers. We dive into the latest location intelligence for category leaders Burlington, Marshalls, Ross Dress for Less, and T.J. Maxx – to explore how the segment closed out 2024 and began 2025.
Ezra Carmel
Feb 19, 2025
4 minutes
The off-price apparel space remains well-positioned as consumers continue to favor budget-friendly retailers. We dive into the latest location intelligence for the space – and category leaders Burlington, Marshalls, Ross Dress for Less, and T.J. Maxx – to explore how the segment closed out 2024 and started off in 2025.
Increased Visitation to Off-Price Leaders
The leaders of the off-price apparel space – Burlington, Marshalls, Ross Dress for Less, and T.J. Maxx – drove the success of the category last year. In 2024, Burlington’s visits increased (7.9%), as did visits to Marshalls (5.3%), Ross (0.7%) and T.J. Maxx (4.9%).
Zooming into H2 2024 reveals that Burlington, Marshalls, and T.J. Maxx saw consistent YoY visit growth. And although Ross Dress for Less saw mild visit gaps for some of the period, all four off-price apparel chains analyzed started the new year on a high note with January 2025 visits up across the board compared to the previous year.
Marmaxx, Ross, and Burlington expanded their real estate footprints in 2024 – likely contributing to the chains’ YoY visit increases. And all four retailers’ have plans to continue their expansion strategies in the coming years – putting them on a foot traffic growth trajectory for 2025.
Off-Price Tips the Scales
The foot traffic growth of Burlington, Marmaxx, and Ross plays a significant role in the success of the off-price category, which has steadily increased its share of total apparel visits.
In Q4 2024, the off-price apparel category claimed a majority of the combined off-price and our traditional apparel category visits (51.9%) for the first time since at least 2019. This demonstrates the segment’s strong holiday performance and continued resilience in the face of economic headwinds for both consumers and retailers.
Regional Paths to Success
Diving deeper into the foot traffic for Burlington, Ross, Marshalls, and T.J. Maxx highlights robust nationwide visits as well as several regional preferences among consumers.
Nationwide, Ross claimed the lion’s share of visits between the four chains in Q4 2024 (31.0%), followed by T.J. Maxx (28.0%), Marshalls (23.1%), and Burlington (17.9%).
Analysis of the chains’ share of visits by CBSA reveals that Ross claimed the greatest share of visits in a majority of the West and Southwest, as well as in many large metropolises. Meanwhile, T.J. Maxx appeared to be the most-visited brand in many CBSAs throughout the Eastern United States, while Marshalls appeared to be the preferred brand in the Mid-Atlantic.
And despite claiming 17.9% of combined visits to the four off-price apparel chains, Burlington received the largest share of visits in only two CBSAs – Midland, TX and Anchorage, AK, which could be due to the brand’s long-term smaller-format strategy. While a smaller-format store may have less physical real estate (and therefore visitor potential) than the typical Marmaxx and Ross location, it affords Burlington the flexibility to source locations with strong economics that can drive productivity for the brand in markets nationwide.
All four brands have a robust presence nationwide, yet regional preferences and variations in real estate footprints highlight the different paths to success in the off-price space.
Taking Off
The off-price apparel segment is thriving in 2025, with Burlington, Marshalls, Ross, and T.J. Maxx leading the charge. Consumers continue to prioritize value, fueling steady foot traffic growth and cementing off-price retailers as key players in the apparel space. Each brand is carving out its own regional strongholds while expanding its footprint, setting the stage for even greater success in the year ahead.
How did Walmart, Target, and wholesale clubs perform in 2024? What do early 2025 foot traffic trends tell us about superstores’ growth potential in the coming year? And what do visitation patterns at Target and Walmart reveal about the role each chain plays in the wider retail landscape?
Shira Petrack
Feb 18, 2025
3 minutes
How did Walmart, Target, and wholesale clubs perform in 2024? What do early 2025 foot traffic trends tell us about superstores’ growth potential in the coming year? And what do visitation patterns at Target and Walmart reveal about the role each chain plays in the wider retail landscape? We dove into the data to find out.
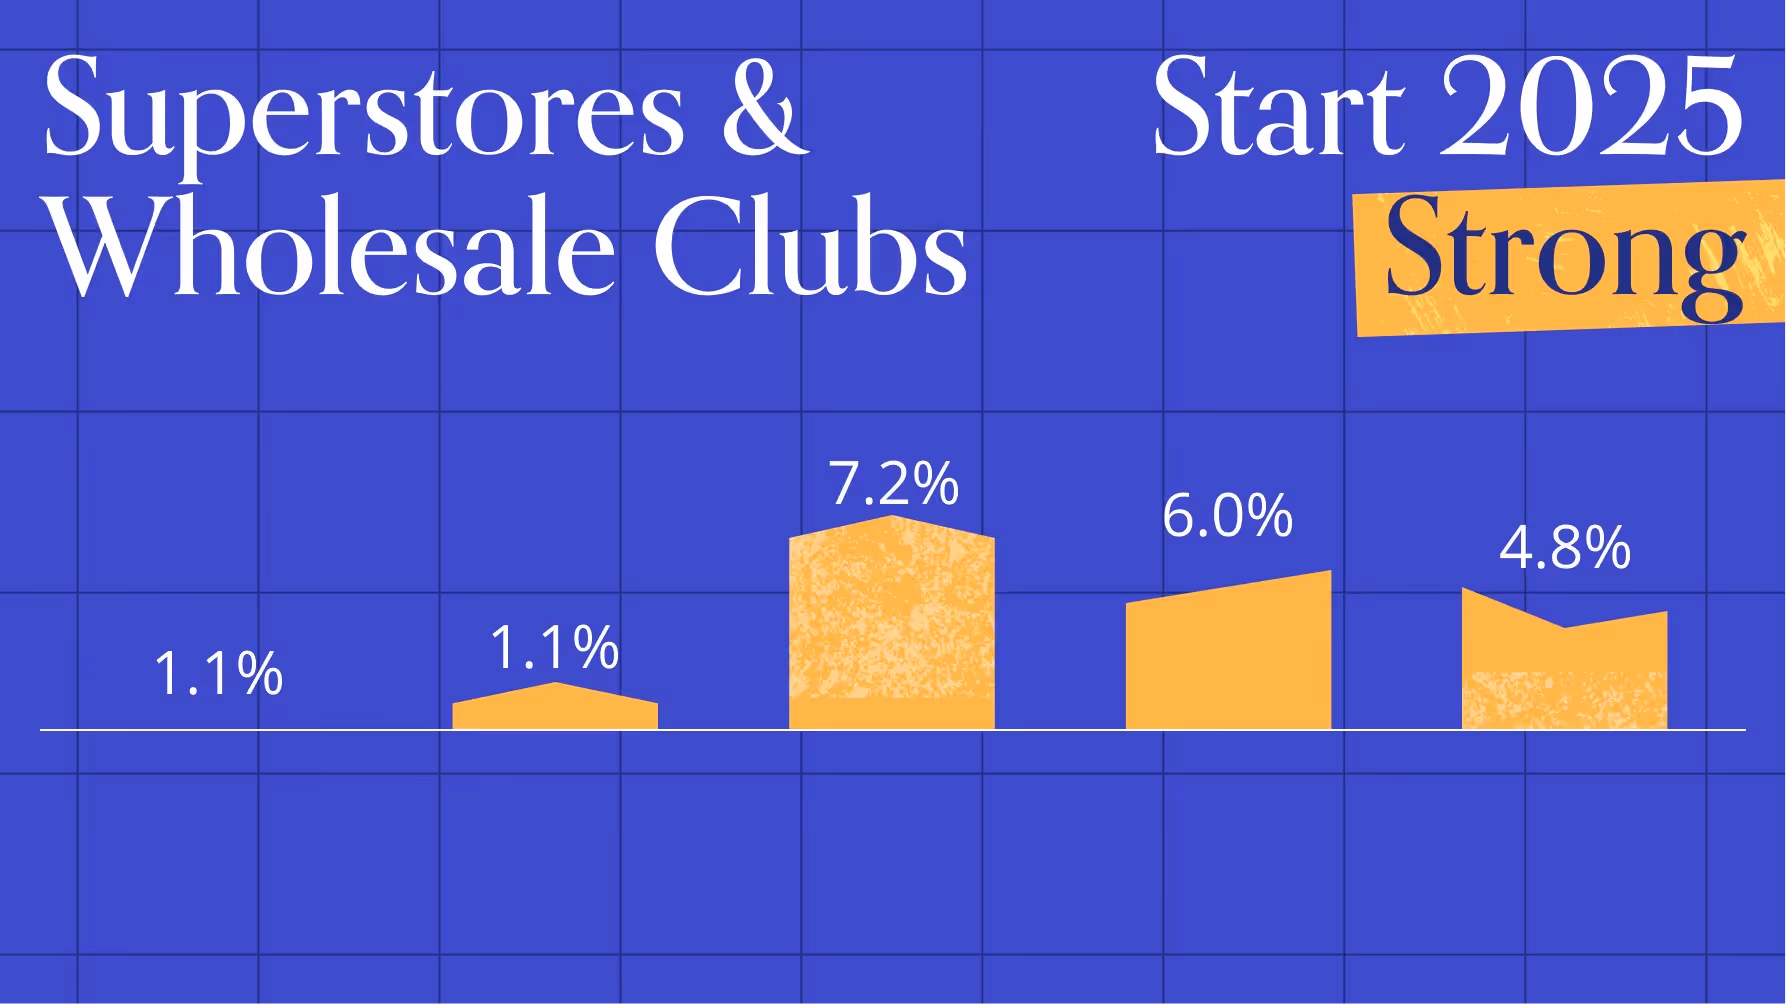
Superstores & Wholesale Clubs Start 2025 Strong
Wholesale clubs outperformed more traditional superstores in 2024, as Costco, BJ’s, and Sam’s Club saw 4.8% to 7.2% YoY increases in visits while Target and Walmart’s traffic remained relatively flat. And though wholesale clubs continued outperforming Target and Walmart in the new year as well, the two superstore leaders did see clear visit increases of 3.6% and 3.0%, respectively, in January 2025 – a promising sign for the retail giants’ growth in the year ahead.
How Do Audience and Shopping Behavior Differ at Target and Walmart?
Target and Walmart both operate national chains of one-stop shops that carry a variety of consumables and non-consumables, including groceries, apparel, toys, and electronics. But diving into the demographics of the two brand’s captured market reveals that each chain serves a slightly different audience.
Target tends to attract visitors from areas with higher HHI and larger households: The company’s captured market includes a larger share of both households with children and non-family (e.g. roommates) households than Walmart’s, perhaps due to Target’s relative appeal to both suburban and strongly urbanized segments. Meanwhile, Walmart seems to attract more repeat monthly visitors (who visit the chain at least twice a month), perhaps thanks to the chain’s extensive grocery offerings and to its popularity among rural and semirural segments who may not have a variety of retail options to frequent.
Walmart Shoppers Stay Longer, Target’s Visitors Come Later
The two chains’ visitor base also exhibit differences in in-store behavior. Walmart visitors do seem to linger a little longer in store, with 20.7% of the chain’s visits lasting longer than 45 minutes compared to Target’s 17.1% – maybe thanks to the mission-driven shopping behavior of some of its rural and semirural customer base. But despite the longer visits, Walmart still receives a larger share of weekday visits than Target – perhaps thanks to its larger share of single shoppers with fewer weekday commitments.
For more data-driven consumer insights, visit placer.ai.
How did home improvement leaders The Home Depot and Lowe’s perform in 2024? And what lies ahead for the chains in 2025? We dove into the data to find out.
Bracha Arnold
Feb 17, 2025
3 minutes
How did home improvement leaders The Home Depot and Lowe’s perform in 2024? And what lies ahead for the chains in 2025? We dove into the data to find out.
Gearing Up For Stability
A challenging retail environment continued weighing on the home improvement space in 2024 as high prices and tighter consumer budgets led many consumers to push off discretionary renovations and remodels. As a result, visits to The Home Depot and Lowe’s remained below 2023 levels throughout 2024. Still, the visit gaps were relatively minor – The Home Depot received 1.6% to 3.5% fewer quarterly visits and Lowe’s saw a 2.2% to 4.7% visit gap relative to 2023 – a testament to the enduring strength of these home improvement giants.
Promotions Drive Home Improvement Visits
Diving deeper into the daily visits data also reveals that, despite the challenges, the two retailers succeeded in driving significant visit boosts through promotions and holiday sales: Mother’s Day, Black Friday, and the Saturday of Memorial Day were the top three visited days for The Home Depot and Lowe’s in 2024. Lowe’s received its highest daily traffic boost on Mother’s Day – likely thanks to its free plant giveaway – while The Home Depot saw its largest visit surge over the traditionally busy Black Friday. Finally, Memorial Day sales drove the third largest visit peak for both chains.
The boost in consumer traffic during special events underscores the potential of seasonal promotions to drive engagement and foot traffic – even in times of wider retail headwinds and economic uncertainty.
Hobbyists May Be Taking Center Stage
Both The Home Depot and Lowe’s received fewer visitors in 2024 compared to 2023, but a closer look reveals that the YoY dips in repeat visitors (who visited at least twice a month) were larger than the declines in casual (once a month) shoppers. For example, in December 2024, the number of casual visitors to The Home Depot dipped 3.0% YoY while the number of repeat monthly visitors declined by 4.0% compared to 2023. YoY visitor trends to Lowe’s generally followed a similar trend.
This trend suggests that, with home sales at their lowest levels since 1995 and many consumers looking to avoid non-essential expenditures, demand for large-scale renovations may be slowing. As a result, contractors and homeowners undertaking major remodeling projects are likely visiting these stores less frequently.
But while these trends may be hampering home improvement visits in the short term, the current downturn could also be setting the stage for a future recovery – as a stabilizing economy could unleash significant pent-up demand.
What Comes Next For Home Improvement?
Visits to the country’s two largest home improvement retailers, while not yet returned to their pandemic-era highs, are beginning to stabilize. Will 2025 see a return to normal for the chains?
Visit Placer.ai to keep up with the latest data-driven retail insights.
With consumer interest in wellness showing no sign of slowing down, we dove into fitness foot traffic data to see how the segment performed in 2024 and understand what the new year holds for the category.
Shira Petrack
Feb 14, 2025
3 minutes
With consumer interest in wellness showing no sign of slowing down, we dove into fitness foot traffic data to see how the segment performed in 2024 and understand what the new year holds for the category.
Fitness Category Still Growing
The fitness category has yet to hit its peak. Following consistent year-over-year (YoY) growth in monthly visits throughout 2024, traffic to the category rose again in January 2025 with visits 2.3% higher than in January 2024 – a strong start for what is likely to be another standout year in the fitness space.
Traditional January Fitness Spike Continues in 2025
And while some may consider New Year’s resolutions to be an outdated, unhelpful institution, the data indicates that January still drives a significant fitness spike as Americans across the country commit to their wellness goals at the start of the year.
Fitness visits in January 2025 were 21.2% higher than in December 2024 – only a slightly lower spike than the month-over-month (MoM) January 2024 jump of 23.4% – indicating that New Year’s resolutions are still quite popular in 2025. At the same time, the slightly lower MoM growth in January may also reflect the relatively stable visitation trends throughout 2024 – a shift from the traditional patterns of fitness chains losing about 30% of their members each year.
Interest in Wellness Boosting Gyms Across the Board
Diving into individual fitness chains reveals that the category’s ongoing success is driving visit growth across the fitness segment – including at budget gyms such as Planet Fitness and Crunch Fitness, mid-range chains such as LA Fitness, and premium brands such as Life Time. And critically, both overall visitors and visit frequency were consistently elevated in H2 2024 and going into 2025, indicating that not only are more people going to the gym – they’re also generally going more frequently. It seems, then, that the wellness trend of the past few years is still gaining momentum.
Fitness Consumer Trends – Variation in Visit Frequency by Season & Brand Tier
While the increased interest in wellness seems to have brought a boost in industry-wide fitness visits, analyzing visit frequency by brand and quarter does reveal some differences – and some similarities – across different brand tiers.
All four brands analyzed – Planet Fitness, Crunch Fitness, LA Fitness, and Life Time – received the largest share of repeat visitors (at least twice a month) in Q1 2024, as New Year’s resolutions drove a boost in gym-going frequency. The share of repeat visitors then consistently fell throughout the year, and the chains (with the exception of Life Time) received the lowest share of repeat visits in Q4 as vacations and holidays likely interfered with people’s exercise schedule.
One might expect high value low price (HVLP) gyms to attract lower-usage members – since the modest fee may mean that members are not compelled to get the most bang for their buck – but looking at the data reveals that visit frequency did not necessarily correlate with membership pricing. While Planet Fitness and Crunch Fitness are both HVLP chains, their visit frequency patterns differed significantly: Planet Fitness seemed to attract a relatively high share of lower-usage members, while Crunch Fitness’ visit frequency exceeded that of higher-priced LA Fitness and was in fact was closer to that of premium chain Life Time.
For more data-driven consumer insights, visit placer.ai.
Discover how mall anchors are transforming in 2025 – and how a foot-traffic-focused approach to choosing key tenants can drive visits and shopper engagement.
May 29, 2025
8 minutes
Key Takeaways
1. Experiential and niche retailers can deliver anchor-level traffic. At Towne East Square Mall, the addition of a Scheels in 2023 significantly increased foot traffic and long-distance travelers, while Barnes & Noble at Coronado Center in Albuquerque has become a key driver of both foot traffic and higher-spend demographics.
2. Size isn’t everything – especially for dining venues. At Glendale Galleria and Northridge Fashion Center, smaller restaurants attracted more foot traffic than some traditional anchors.
3. Refocusing on tenants’ actual traffic contributions enables a flexible anchor approach. Balancing weekend draws like Scheels with weekday favorites such as Costco or Chick-fil-A can help maintain steady visitor flow throughout the week. Similarly, onsite fitness clubs can shift traffic to earlier in the day – an opportunity to adjust store hours and capture additional morning shoppers.
4. Temporary pop-ups can form an integral part of a visit-focused anchor strategy. The Barbie Dreamhouse Living Truck Tour generates mall visit spikes well above typical Saturday levels. Operators can integrate these events into their overall anchor strategies, offering preferential terms to high-performing pop-ups.
5. New tenants can boost traffic for existing stores in similar categories. After Aldi joined Green Acres Commons in February 2020, visits to an existing BJ’s Wholesale Club trended upwards. This synergy highlights how overlapping audiences can become a strength, creating a larger overall customer base.
The Retail Comeback Kid
Malls, it seems, are cool once again. After languishing in the wake of the pandemic, shopping centers across the country are thriving – reinventing themselves as prime “third places” where people can hang out, shop, and grab a bite to eat.
One key driver behind this resurgence is a shift in how malls view their anchor tenants. While traditional mainstays like Macy’s and JCPenney still play an important role, specialized offerings – from popular eateries to fitness centers and immersive retailtainment destinations – are increasingly taking center stage. These attractions maximize the experiential value that brick-and-mortar venues can deliver, driving visits and sales for the center as a whole.
Against this backdrop, this report leverages the latest location intelligence data to explore the types of tenants that can function as mall anchors in 2025. Should mall operators still focus on general merchandisers to draw crowds, or can dining chains and more niche retailers also do the job? How important is square footage in identifying the anchor-like tenants in a shopping center? And how can a visit-focused approach help mall operators select effective anchor or anchor-like tenants – whether to fill big-box spaces or to leverage the leasing perks traditionally reserved for major large-format chains?
Out-of-the-(Big)-Box Visit Drivers
One of the most important functions of a mall anchor is to ensure steady visitation – providing its smaller tenants with a constant flow of potential customers. And as the role of the mall continues to evolve, analyzing the actual foot traffic impacts of different types of businesses can help identify the kinds of non-traditional anchors best suited to fulfill that purpose.
The Power of a Well-Placed Scheels
Experiential venues, for example, are particularly well-poised to serve as powerful anchors in today’s retail environment – as illustrated by the visit surge experienced by Towne East Square Mall in Wichita, KS following the addition of a Scheels in July 2023.
By blending traditional retail with immersive experiences, Scheels has emerged as a true experiential destination. And this pull has also helped the mall draw more long-distance visitors willing to travel to enjoy Scheels’ offerings. In 2024, 41.9% of the mall’s customers traveled more than 50 miles to visit, compared to 35.8% back in 2018 when Sears occupied the same lot.
Scheels Anchor Brings Substantial Visit Boost to Towne East Square Mall in Wichita, KS, Attracting Visitors From Further Away
Visits to Towne East Square Mall Compared to Q1 2018 Baseline
Share of Visitors From 50+ Miles Away
Share
Embed:
The Barnes & Noble Effect
Traditionally, anchors aimed to please the widest possible audiences – with department stores, big-box chains, and grocery stores leading the way. But visitation data shows that niche concepts can also deliver anchor-level traffic if they’re compelling enough to attract dedicated fans.
The experience of the Barnes & Noble at Coronado Center in Albuquerque, NM is a case in point. After being written off as all but obsolete, Barnes & Noble has staged an impressive comeback in recent years, finding success through a more curated, localized approach to book selling. And despite not being a formal anchor, the Coronado Center Barnes & Noble accounted for 7.9% of visits to the mall in 2024 – outperforming both Macy’s and JCPenney.
Year-over-year data also shows foot traffic surging at the Coronado Center Barnes & Noble, lifting overall visitation to the mall. And demographic data reveals that the bookstore draws a more affluent audience than either the center as a whole or the two department stores – attracting a crowd with more spending power.
This example also illustrates how smaller tenants can sometimes draw larger crowds. Even though Barnes & Noble occupies a smaller onsite space than either Macy’s or JCPenney, it is proving a powerful visit driver out of proportion to its physical size.
Dining Chains Punching Above Their Size
Dining chains are also adept at punching above their square footage – often attracting crowds disproportionate to their size.
Despite its relatively small footprint, for example, the In-N-Out Burger at Glendale Galleria drew an impressive 8.6% of visits to the mall complex in 2024, outpacing some of the mall’s official anchors like DICK’s Sporting Goods, Macy’s, and JCPenney. Still, the onsite Target drew even larger crowds at 14.4% of visits.
A similar pattern emerged at Northridge Fashion Center, where Porto’s Bakery and Cafe captured a notable 15.6% of visits to the complex in 2024 – more than some of the center’s traditional department stores.
These examples underscore the potential for dining chains, which typically require less space, to serve as micro-anchors by consistently attracting outsized crowds – a key consideration for mall operators looking to sustain visitor traffic.
Choosing a Mall Anchor in 2025
Refocusing on tenants’ actual foot traffic contributions also opens the door to a more flexible and dynamic approach to anchor selection and management – one that considers each venue’s unique visitation patterns.
The Weekend/Weekday Divide
Seasonal factors, for example, can make certain anchors more powerful at specific times of the year, while different venues shine on particular days of the week.
At Jordan Creek Town Center in West Des Moines, Iowa, for instance, Scheels and Costco each delivered just under 20.0% of the complex’s overall visits in 2024. But the two retailers’ daily patterns differed significantly: Scheels saw bigger crowds on weekends, while Costco was the primary weekday destination.
Understanding differences like these can help operators optimize their tenant mix to maintain a balanced flow of shoppers throughout the week.
Another example of the impact of differing weekday traffic patterns is offered by the impact of mall-based Chick-fil-A locations on the distribution of mall visits throughout the week.
Despite its relatively small size, Chick-fil-A draws substantial traffic to malls. And after adding Chick-fil-A locations, both Northridge and Miller Hill Malls saw meaningful drops in the share of visits to the centers taking place on Sundays – even as the wider indoor mall segment saw slight upticks.
Recognizing this trend could prompt mall operators to compensate by adding more weekend-friendly traffic drivers – or to lean into this distinction by taking additional steps to bolster the mall’s role as a go-to weekday destination.
The Early-Morning Fitness Advantage
The power of different mall traffic magnets also varies throughout the day. Increasingly, shopping centers are turning to fitness centers as experiential anchors. And since many people work out early in the morning, these gyms are having a significant impact on the distribution of mall visits across dayparts.
The addition of gyms to Northshore Mall in Peabody, MA and Jackson Crossing in Jackson, MI, for instance, led to a significant rise in visits between 7:00 AM and noon. And though the rest of the stores in these malls typically open at 10:00 or 11:00 AM, this shift presents the centers with a significant opportunity.
By adjusting opening hours to accommodate these early-morning patrons, malls can capitalize on this added traffic, driving up visits and sales for relevant tenants – especially health-focused retailers such as juice bars and sporting goods stores.
Adding Temporary Pop-Ups Into the Mix
Adopting a broader, visit-focused view of anchoring also allows mall operators to apply some of the strategies typically reserved for anchors to non-conventional traffic-generating businesses, to ensure a consistent flow of traffic year-round.
Pop-up stores and events, for example, generally don’t follow the same seasonal trends as other retailers – instead, they generate short-term visit boosts during their runs, whenever in the year that may be. And a visit-focused anchor strategy can leverage some of the perks traditionally reserved for anchor tenants – such as preferential leasing terms – to complement traditional full-time anchors during slower retail periods.
The Barbie Dreamhouse Living Truck Tour is a prime example of a traffic-driving pop-up. By bringing exclusive merchandise to malls across the U.S., the truck generates plenty of buzz, drawing crowds eager to snatch up limited-edition items and immerse themselves in all things Barbie. As a result, malls hosting the tour often see significant visit spikes, with foot traffic surging well above typical Saturday levels. Well-timed pop-ups like these can help balance out traffic throughout the year, offsetting traditional slow periods.
Creating a Bigger Visit Pie
A visit-focused approach to anchor management can also help mall operators assess the potential impact of new tenants on existing stores operating in similar categories. For example, mall owners often worry that new tenants operating in similar categories might cannibalize existing businesses. But a visit-focused anchor approach reveals that a well-chosen addition can sometimes benefit current tenants – especially if they cater to similar audiences.
In February 2020, for instance, value supermarket Aldi opened at Green Acres Commons in Valley Stream, NY – a center that already hosted budget-friendly BJ’s Wholesale Club. While BJ’s visits were relatively flat in 2018 and 2019, they began to rise after Aldi’s opening (and following a pandemic-induced dip). Cross-shopping data also shows that Aldi customers were more likely to visit BJ’s than the average Green Acres patron last year.
This synergy may be due in part to the two retailers’ similar visitor bases: In 2024, the Aldi and BJ’s stores in Green Acres Common drew shoppers with comparable economic profiles. This suggests that overlapping audiences can become a strength if aligned brands attract new shoppers, who then explore multiple stores in the same center.
Visits to BJ's Wholesale Club Took Off After Addition of Aldi to Green Acres Commons – Perhaps Buoyed by Audience Similarity
Visits to Green Acres Commons BJ's Wholesale Club, Compared to Q1 2018 Baseline
Median HHI, 2024*
Cross-Shopping, 2024
*Median HHI based on STI: PopStats dataset combined with Placer.ai data for captured trade areas.
Looking ahead, effective mall anchors will be defined less by physical footprint and more by their capacity to maintain consistent, valuable foot traffic. While traditional department stores remain pivotal, smaller or niche brands can often rival – or surpass – large-format retailers. And by thinking out of the anchor box and choosing tenants that cultivate a balanced visitor flow and align with local preferences, operators can position their centers as true go-to destinations.
Dive into the data to see the trends shaping the grocery space in 2025 and uncover actionable insights for strategic decision-making in the competitive food-at-home market.
May 15, 2025
8 minutes
Key Takeaways:
1. Shoppers are taking more, shorter trips to grocery stores.Over the past 12 months, grocery stores have experienced nearly uniform YoY visit growth. And since COVID, the segment has steadily increased both overall visits and average visits per location – even as average dwell times have consistently declined.
2. Grocery stores are holding ground against fierce competition. Despite growing inroads by discount and dollar stores, wholesale clubs, and general mass retailers like Walmart and Target, grocery stores have maintained their share of the overall food-at-home visit pie over the past several years.
3. Grocery visit share is most pronounced on the coasts. In Q1 2025, grocery stores claimed the majority of food-at-home visits on the West Coast, in parts of the Northeast, Mid-Atlantic, and Mountain Regions, and in Florida and Michigan.
4. Fresh-format, value, and ethnic grocery visit shares are growing at the expense of traditional chains. And in Q1 2025, fresh-format and value grocers outperformed the other sub-segments with positive YoY visit and average visit-per-location growth.
5. Hispanic markets are on the rise. Though the broader ethnic grocery sub-segment was essentially flat YoY in Q1 2025, Hispanic-focused stores recorded increases in both visits and visits per location – and have been steadily growing visits since 2021.
6. Smaller formats for the win. In Q1 2025, smaller-format grocery store locations outpaced mid-sized and larger-format ones, underscoring the power of compact spaces to deliver significant foot traffic gains.
A Study in Resilience
Brick-and-mortar grocery stores face an uncertain market in 2025. Rising food-at-home prices (eggs, anyone?), declining consumer confidence, and increased competition from discounters, superstores, and online shopping channels all present the segment with significant headwinds. Yet even in the face of these challenges, the sector has demonstrated remarkable resilience – growing its foot traffic and holding onto visit share.
What strategies have helped the segment navigate today’s tough market? And how can industry stakeholders make the most of the opportunities in the current market? This report draws on the latest location intelligence to uncover the trends shaping grocery retail in early 2025 – highlighting insights to help key players make informed, data-driven decisions on store formats, product offerings, and more.
Growth in Aisle One
The grocery segment has experienced nearly uniform positive year-over-year (YoY) growth over the last 12 months. This sustained performance in the face of inflation and other headwinds highlights the underlying strength of the category.
Visits Up, Dwell Time Down
What is driving this growth? Since 2022, the grocery segment has seen consistent overall visit growth that has outpaced increases in visits per location – a sign that chain expansion has played a key role in the category’s success. But the average number of visits to each grocery store has also been on the rise, indicating that the segment continues to expand without cannibalizing existing store traffic.
At the same time, visitor dwell times have been steadily dropping since 2021. This shift appears to reflect a trend towards multiple, shorter trips by inflation-wary consumers eager to avoid large, costly carts or cherry pick deals across various retailers. Many shoppers may also be placing more bulk orders online and supplementing those deliveries with brief in-store stops for additional items as needed.
The bottom line: Shoppers are taking more grocery trips overall each year, but spending less time in-store during each visit. Operators can respond to this trend by optimizing layouts and promoting “grab-and-go” areas for an even more efficient quick-trip experience.
Still in Stock
Visit share data also shows that despite fierce competition from discount and dollar stores, wholesalers, and general mass retailers, the grocery segment has steadfastly preserved its share of the overall food-at-home visit pie.
Between Q1 2019 and Q1 2025, wholesale clubs and discount and dollar stores increased their share of total food-at-home visits, gains that have come primarily at the expense of Walmart and Target. Meanwhile, grocery outlets have held firm – despite some fluctuations over the years, their Q1 2019 visit share remained essentially unchanged in Q1 2025.
So even as consumers flock to alternative food purveyors in search of lower prices, grocery stores aren’t losing ground – and on a nationwide level, they remain the biggest player by far in the food-at-home shopping space.
A Coastal Advantage
Still, grocery store visit share varies significantly by region. On the West Coast, in parts of the Northeast, Mid-Atlantic, and Mountain regions, and in Florida and Michigan, grocery stores accounted for the majority of food-at-home visits in Q1 2025. Oregon (61.6%) and Washington (59.6%) led the pack, followed by Massachusetts (59.2%), Vermont (58.5%), and California (57.9%). Meanwhile, in West Virginia, Arkansas, South Dakota, Oklahoma, North Dakota, and Mississippi, less than 30% of food-at-home traffic went to grocery stores, with more shoppers in these regions turning to general mass retailers or discounters.
Grocery store operators in lower-grocery-share regions may choose to focus on price competitiveness and convenient store locations to capture more foot traffic from competitors in the space.
Fresh and Frugal on the Rise
Which types of grocery stores are thriving the most? The grocery segment is diverse, encompassing traditional grocery chains like Kroger, Safeway, and H-E-B; budget-oriented value chains such as Aldi, WinCo Foods, Grocery Outlet Bargain Market, and Market Basket; fresh-format specialty brands like Trader Joe’s, Whole Foods, and Sprouts Farmers Market; and numerous ethnic grocers.
Examining shifts in visit share among these various grocery store segments shows that traditional grocery still dominates, commanding over 70.0% of total grocery store foot traffic.
Still, over the past several years, traditional grocers have gradually ceded ground to other segments – especially value chains. Budget grocers saw a temporary surge in visits during the panic-buying days of early 2020 – and have been more gradually gaining visit share since Q1 2023. . Fresh-format banners, which lost ground in 2021 after a Q1 2020 bump, in the wake of COVID, have also been on the upswing and appear poised to capture additional visit share in the coming months and years. And though ethnic grocers still account for a relatively small portion of the overall market, they have slightly increased their visit share, reflecting heightened consumer interest in these specialized offerings.
The Discount and Premium Edge
Recent performance metrics point to a bifurcation in the grocery market similar to that observed in other retail categories. In Q1 2025, fresh-format and value retailers – which appeal, respectively, to the most and least affluent visitor bases – saw the greatest growth in both overall visits and average visits per location.
This trend highlights the power of both value and health-focused quality to motivate consumers in 2025. And grocery players that can meet these needs will be well-positioned for success in the months ahead.
WFH Fresh-Format Lunch Crunch
One factor fueling fresh-format’s success may be its role as a convenient, relatively affordable midday lunch destination for the remote work crowd.
In Q1 2025, consumers working from home accounted for 20.2% of fresh-format grocery stores’ captured market – a significantly higher share than any other analyzed grocery segment. These stores also tended to be busier midday than the other segments. Remote workers may be stopping by to grab a quick bite – and some may be choosing to do their grocery shopping during their lunch break when stores are less crowded.
This finding suggests an opportunity for grocery operators across all segments to develop or enhance in-store salad bars and quick-serve sections to tap into the lunch rush. Likewise, CPG companies may benefit from developing more ready-made, nutritious meal options that align with these midday dining habits.
Salsa Surge
Though the broader ethnic grocery category remained essentially flat in Q1 2025, Hispanic-focused grocers emerged as a sub-segment to watch. Both overall visits and average visits per location to these stores have been on the rise since 2021.
This robust demand presents an opportunity for CPG brands and grocers across segments to expand Hispanic-focused offerings, capturing a slice of this growing market.
Less is More
Finally, store size matters more than ever in 2025. During the first quarter of the year, smaller format grocery store locations (locations under 30K square feet, across different chains) outpaced larger stores with a 3.2% YoY jump in visits, showing that bigger isn’t always better in the grocery store space.
This pattern aligns with the decrease in dwell times noted above – shoppers may be making shorter trips to smaller, more convenient grocery store locations. These quick errands are ideal for picking up a few items to supplement online orders, shopping multiple deals, or sourcing specialty products unavailable at larger grocery destinations. And to lean into this trend, grocery operators might consider testing neighborhood “micro-store” concepts, focusing on curated selections, and offering convenient parking or pickup to match consumer preferences for targeted purchases and quicker trips.
Final Thoughts
Location intelligence reveals a growing, dynamic grocery landscape which is holding its ground in the face of increased competition. Shorter trips, busier lifestyles, and changing work routines are reshaping in-store experiences. And grocery players that refine their store formats, target both lunch and on-the-go shoppers, and adapt to shifting demographics can position themselves to thrive in this competitive sector. As the market continues to evolve, continuous attention to these changing patterns will be key to maintaining and expanding market share.
Dive into the data to explore recent visitation patterns and consumer trends in the fitness space - and uncover potential keys to success, rooted in location intelligence.
May 5, 2025
8 minutes
Key Takeaways
1. Elevated visitor frequency could mean that gym-goers are getting more value out of their memberships and are therefore more likely to stay signed up. Between January and March 2025, all of the gym chains analyzed had a higher share of frequent visitors (those who visited about once a week) than in the equivalent month of 2024.
2. Fitness chains at all price tiers need to be strategic about the value they offer and the amenities that can engage budget-conscious consumers. Between Q1 2022 and Q1 2025, the captured trade area median HHI increased for all fitness subsegments – value-priced, mid-range, and high-end – suggesting that consumers swapped pricier gym memberships for more affordable options.
3. Close attention should be paid to how long visitors spend at fitness chains in order to reduce crowding and bottlenecks. Between Q1 2022 and Q1 2025, the average visit length increased at value-priced, mid-range, and high-end gyms. Floorplan and equipment improvements could be considered, as well as having trainers available to help gym-goers streamline workouts.
4. Gyms can use hourly visit data to better serve their members or use promotions to stabilize facility usage throughout the day. In Q1 2025, high-end chains received a larger share of morning visits while value-priced and mid-range fitness chains received larger shares of evening visits.
Fitness Flexes Its Muscles
Like many industries in recent years, the fitness sector has experienced significant shifts in consumer behavior. From the rise in home workouts during the pandemic to the strain of hyper-inflation, foot traffic trends to gyms and health clubs have been as dynamic as the consumers they serve.
This report leverages location analytics to explore the consumer trends driving visitation in the fitness space and provides actionable insights for industry stakeholders.
Back in Shape: The COVID Recovery
The pandemic drove several shifts in the fitness space. Widespread gym closures led consumers to embrace home-based workouts, while demand for all things fitness increased due to an emphasis on overall health and wellness. This subsequently drove a renewed interest in gym-based workouts as restrictions lifted – even as some consumers remained committed to their home workout routines.
In Q1 2023, visits to fitness chains surpassed Q1 2019 levels for the first time since the onset of the pandemic, a sign that consumers had recommitted to out-of-home fitness. And in Q1 2024 and Q1 2025, fitness chains saw further growth, climbing to 12.8% and 15.5% above the Q1 2019 baseline, respectively.
Several factors have likely driven consumers’ return to gyms and health clubs, including the desire for both social connection and professional-grade facilities difficult to replicate at home. The steep increase in cost of living has likely also played a role, since consumers cutting back on discretionary spending can enjoy multiple outings and a range of recreational activities at the gym for one monthly fee.
Getting Gains: Strong Q1 ‘25
Zooming in on weekly visits to the fitness space in Q1 2025 reveals the industry’s exceptional strength and resilience in the early part of the year.
The fitness industry experienced YoY visit growth nearly every week of Q1 2025 (and 2.4% YoY visit growth overall) with only minor visit gaps the weeks of January 20th, 2025 and February 17th, 2025 – likely due to extreme weather that prevented many Americans from hitting the gym.
And the fitness industry’s weekly visit growth appeared to strengthen throughout the quarter, defying the typical waning of New Year's resolutions. This could indicate that gym visits haven't plateaued and that consumers are demonstrating greater commitment to their fitness routines compared to last year.
Increasing Reps: Visitor Frequency Up At Leading Chains
Diving into visitation patterns for leading fitness chains highlights how increased visitor frequency drove foot traffic growth in Q1 2025.
Fitness chains tend to receive the most visits during the first months of the year as consumers recommit to health and wellness in their post-holidays New Year’s resolutions. And not only do more people hit the gym – analyzing the data reveals that gym-goers also typically work out more frequently during this period. Zooming in on 2025 so far suggests that consumers are especially committed to their fitness routines this year: Leading gyms saw an increase in the proportion of frequent visitors (4+ times a month) in Q1 2025 compared to the already significant percentage of frequent visitors in the first quarter of 2024.
Elevated visitor frequency could mean that gym-goers are getting more value out of their memberships than last year, and are therefore more likely to stay signed up throughout the year.
At the same time, the data also reveals that – contrary to what may be expected – a fitness chain’s share of frequent visitors appears to be independent of the cost of membership associated with the club: Life Time, a high-end club, and EōS Fitness, a value-priced gym, had the highest shares of frequent visitors between January 2024 and March 2025. This suggests that factors other than cost, such as location convenience, class offerings, community, or individual motivation, might be more influential in driving frequent gym attendance.
Fitness Clubs at Different Price Points
Segmenting the fitness industry by membership price tiers – value-priced, mid-range, and high-end – can reveal further insights on current consumer behavior around out-of-home fitness.
Household Income Bulks Up
In Q1 2025, the captured market* median household income (HHI) was higher than the nationwide median HHI ($79.6K/year) across all price tiers – suggesting that even value-priced fitness chains are attracting a relatively affluent audience. This could indicate that gym memberships are somewhat of a luxury and that consumers from lower-income households gave up their gym memberships altogether as they tightened their purse strings.
Analyzing the historical data since Q1 2022 also reveals that the captured market median HHI has risen consistently over the past couple of years with the largest median HHI increase observed in the captured trade areas of high-end fitness chains. This suggests that middle-income households – that are more sensitive to the rising cost of living – likely swapped pricier gym memberships for more affordable options in recent years.
These metrics indicate that fitness chains at all price tiers need to think strategically about the value they offer and the amenities that can engage budget-conscious consumers who are carefully weighing every expenditure.
*Captured trade area is obtained by weighting the census block groups (CBGs) from which the chain draws its visitors according to their share of visits to the chain and thus reflects the population that visits the chain in practice.
Average Stay Increases
Fitness clubs of all types need to manage their capacity to ensure health and safety standards and a positive experience for members. And understanding the average amount of time visitors spend at the gym can help fitness chains at every price point keep their finger on the pulse of their facilities.
Between Q1 2022 and Q1 2025, the average visit length increased at value-priced, mid-range, and high-end gyms. Value-priced gyms experienced the largest increase in average visit length – from 72.4 minutes in Q1 2022 to 74.0 minutes in Q1 2025 – perhaps due to their relatively lower-income visitors spending more time enjoying club amenities after cutting back on other forms of recreation. Meanwhile, mid-range and high-end gyms experienced relatively modest increases in average visit length, which were higher to begin with – likely due to their ample class and spa offerings and overall inviting, upscale spaces.
Elevated average visit length could mean that visitors are well-engaged and less likely to cancel their memberships. But as overall gym visits are on the rise, fitness chains may want to pay close attention to how long visitors spend at the facility. Floorplan and equipment improvements could be considered in order to reduce bottlenecks, and having trainers available to instruct on equipment usage and workout technique could help gym-goers streamline workouts.
Workouts on a Schedule
Along with average visit length, understanding the daypart in which they receive the most visits is another way that fitness chains can improve efficiency and prevent overcrowding. And analysis of the hourly visits to fitness sub-segments revealed that some fitness segments receive more morning visits while others are more popular in the evenings.
In Q1 2025, high-end chains received a larger share of visits between 6 a.m. and 9 a.m. (19.7%) than value-priced and mid-range fitness chains (11.6% and 11.8%, respectively). Meanwhile, value-priced and mid-range fitness chains received larger shares of visits between 6 p.m. and 9 p.m. (21.9% and 22.2%) than high-end chains (16.5%).
Gyms can leverage this data to better serve members, for instance by scheduling more classes during peak hours. Value-priced and mid-range gyms, which saw a larger disparity between shares of morning and evening visits in Q1 2025, might also consider incentivizing off-peak usage through discounted morning memberships or early-bird snack bar deals.
Fitness Continues to Grow
The fitness space appears to be in good shape in 2025. Visits have made a full recovery from the pandemic era and still continue to grow, indicating strong consumer demand for out-of-home workouts. And using location intelligence to analyze the behavior and demographics of visitors to gyms at different price points can help identify opportunities for driving even greater success.


.svg)