The Coachella Valley Music and Arts Festival, held annually at the Empire Polo Club in Indio, CA, recently wrapped up its 24th run. We dove into the location intelligence data to understand how the audience has changed in recent years and understand how the shift is impacting spending patterns at the festival.
Shira Petrack
May 8, 2025
4 minutes
The Coachella Valley Music and Arts Festival, held annually at the Empire Polo Club in Indio, CA, recently wrapped up its 24th run. We dove into the location intelligence data to understand how the audience has changed in recent years and understand how the shift is impacting spending patterns at the festival.
Coachella Drives Visitors to Indio, CA
Indio, CA is home to the Empire Polo Club, a thousand-acre event facility known for hosting many large-scale events throughout the year which attract numerous out-of-towners. One of the venue’s oldest annual events is the Coachella Valley Music and Arts Festivals (often referred to just as “Coachella”) that takes place over two consecutive three-day weekends in April and drives large visit spikes to Indio during its run.
Coachella Audience Shifted In Recent Years
Like many other live cultural events, Coachella was cancelled in 2020 and 2021 due to the ongoing COVID pandemic. And comparing the recent audience segmentation data for Empire Polo Club visitors during recent Coachella weekends to pre-pandemic trends suggests that the festival’s audience shifted slightly following its post-pandemic return.
In recent years (2023, 2024, and 2025), the share of family segments in the Empire Polo Club’s captured market has generally been higher than it was pre-pandemic, while the share of single audience segments decreased. Specifically, Spatial.ai’s segments of Near-Urban Diverse Families, Wealthy Suburban Families, and Melting Pot Families grew, while the share of Young Professionals fell. The share of Educated Urbanites in the Empire Polo Club’s captured market showed more variance, though it was also lower over the last two years (2024 and 2025) than it was in 2019.
The audience shift could suggest that Coachella is becoming more family-friendly, with some parents choosing to make a family trip out of the festival weekend. At the same time, the increase in family-oriented segments may also indicate that the audience base has shifted younger and that the festival now attracts more Gen Z attendees, many of whom still live at home.
Shifts in Spending Patterns
The shift in audience also seems to have driven a change in spending patterns over Coachella weekend. Between 2019 and 2025, the data reveals a notable decrease in hotel & resort visits by Coachella attendees along with an increase in visits to major retail and dining categories, with the largest visit increase reserved for the most affordable segments.
Perhaps budget-conscious families and cash-strapped Gen-Zers living at home are foregoing the more expensive hotels and resorts in favor of more affordable accommodations such as Airbnbs or even camping on-site. To stretch their budgets even further, these attendees are favoring grocery stores, superstores, c-stores, and QSR as their preferred food options, driving significant visit increases to these categories.
At the same time, traffic to full-service restaurants and even apparel chains also grew somewhat in recent years – which could suggest a bifurcated spending pattern. While a significant portion of attendees prioritize affordability in lodging and everyday food, other segments with more disposable income are still willing to spend on sit-down dining and fashion purchases, perhaps viewing these as part of the overall festival experience.
Staying Relevant in 2025 and Beyond
Analyzing post-pandemic Coachella audiences reveals an increased presence of family segments, coupled with a notable gravitation towards budget-friendly spending – painting a picture of a potentially younger, more financially conscious attendee base. Simultaneously, the continued, albeit more moderate, growth in spending at full-service restaurants and apparel chains also indicates a persistent segment willing to invest in the broader festival experience. This dual trend underscores Coachella's success in balancing its appeal to both value-driven attendees and those seeking a more premium experience and suggests that the festival is continuing to maintain its relevance in 2025 – and beyond.
April 2025 data showed a resurgence in mall activity, with YoY visits up across all formats. Diving deeper into the data uncovers the why behind these visitation patterns.
Shira Petrack
May 7, 2025
4 minutes
April 2025 Visits Increased to All Mall Formats
Following a February slowdown, March 2025 mall data offered early signs of a rebound as indoor mall traffic increased and visit gaps at open-air shopping centers and outlet malls narrowed. Now, April data confirms the resurgence in mall activity, with YoY monthly visits up across all mall formats.
Some of the strength may be due to this year’s relatively late Easter, which fell in April (Easter 2024 took place in March) and may have led to a YoY increase in April 2025 as families utilized the holiday weekend for shopping and leisure. But diving deeper into the data suggests that the calendar shift is just one reason for this month’s strong visit numbers, which may also have been boosted by a pull-forward of consumer demand following the early April tariff announcement.
Easter Drives Visit Boost – And Dip
Looking at daily visits in April reveals that the Easter calendar shift had both a positive and negative impact on mall foot traffic. Visits were strong the week before Easter – particularly on Good Friday – as consumers bought gifts, shopped sales, and used their day off to visit mall-based dining and entertainment venues with friends and family. Outlet malls in particular received a significant boost with visits on April 18th (Good Friday) up 26.2% compared to the April 2025 Friday average – perhaps evidence of a more challenged consumer.
But visits to all three formats also dropped significantly on Easter Sunday, with visits to indoor malls, open-air shopping centers, and outlet malls down 59.4%, 33.3%, and 25.9%, respectively, compared to each format’s Sunday average in April 2025. So while Easter did drive a visit boost before the holiday, Sunday’s traffic drop may have balanced out any Easter-driven increase. Rather, the robust April performance likely reflects sustained consumer demand for mall experiences.
Weekly Data Shows Positive Mall Trends Beyond Easter
Weekly numbers also suggest that malls’ performance is not just due to an Easter bump. YoY weekly visits increased for all three formats during the last three full weeks of April, with indoor malls and open-air shopping centers receiving the largest boost the week after Easter – pointing to a broader trend of renewed consumer interest in mall-based activities.
The weekly numbers showing visit hikes following April 2nd also suggest that tariffs may already be impacting consumer behavior, with some shoppers likely beginning to stock up ahead of anticipated price increases and possible shortages.
More & Longer Mall Visits
Analyzing the average visit duration adds another layer of insights into malls’ April success.
Last month, the average visit duration increased for all three mall formats – so not only did malls receive more visits YoY, each visit also lasted longer, on average, than it did last year. This may suggest a larger combined basket size, with consumers spending more time in stores or visiting more mall-based retailers in a single trip. This highlights once again the resilience of the format and the ongoing consumer demand for mall-based retail, dining, and entertainment – and may offer another indication of the pull-forward of demand from certain consumers.
Malls’ Robust April Performance
April 2025 mall data reveals a significant upswing in mall traffic across all formats along with an increase in average visit duration, demonstrating a recovery that extends beyond the influence of the Easter calendar shift. These positive trends reveal malls’ continued role as key destinations for shopping and leisure – even in times of economic headwinds – and could be pointing to a pull-forward of consumer demand in anticipation of retail uncertainty.
Class B malls offer significant potential for investors and retailers to unlock value while meeting the needs of local communities. We took a look at how some of these malls - typically located in suburban or secondary markets - are being redeveloped to better serve today's consumer.
Barrie Scardina & Richard Latella
May 6, 2025
4 minutes
As new retail construction slows, the trend of repurposing underperforming malls is accelerating, offering exciting opportunities to transform these properties into vibrant mixed-use developments. By blending retail, lifestyle, entertainment, and essential services, these redevelopments can better serve the evolving needs of today’s consumers. Class B malls offer significant potential for investors and retailers to unlock value while meeting the needs of local communities.
Characteristics of Class-B Malls
According to Green Street, there are 250 Class-B malls in the U.S., making up 28% of all U.S. malls. These properties are typically located in suburban or secondary markets and often feature a mid-tier tenant mix of national and regional retailers within a traditional enclosed mall format. According to Green Street data, A-rated malls boast an impressive 95% occupancy rate, while B malls sit at 89%. Meanwhile, occupancy drops significantly to 72% for C-rated malls and below.
B Malls face a number of challenges in addition to their higher vacancy rates, including lower sales per square foot, less desirable locations, outdated designs, and competition from newer lifestyle centers that offer a more dynamic mix of retail, dining, and entertainment.
The Future of Class-B Malls
Class-B malls, despite their challenges, offer a compelling opportunity for adaptive reuse. Often priced below their original value, these properties are ideal for redevelopment into community-centric hubs, featuring a mix of residential, retail, and public spaces. Reimagining these spaces not only allows investors and developers to achieve significant returns, but also fosters positive economic growth in local communities. For retailers, these revitalized spaces offer the chance to thrive in environments with increasing foot traffic and elevated customer engagement.
Promising redevelopment ideas include:
Densification and Mixed-Use Developments: Incorporating residential components – like multifamily housing, age-restricted communities, or mixed-income units – can breathe new life into surrounding neighborhoods and create walkable communities while addressing critical housing needs. Adding office spaces, co-working hubs, and hospitality services further enhances the property’s versatility, catering to a wide range of needs.
Experiential Retail Hubs: Transforming B malls into experiential spaces can attract younger demographics and re-engage shoppers. This could include entertainment venues like escape rooms, virtual reality experiences, live music, or food and beverage experiences such as craft breweries or celebrity chef-driven food halls.
Healthcare & Community Spaces: Some B malls are being repurposed into vital community hubs, incorporating medical offices, educational institutions, and municipal services to meet the daily needs of consumers.
Last Mile Distribution and Data Centers: The rise of e-commerce and demand for data centers has led to the conversion of some B malls into last-mile distribution centers or tech hubs, especially in suburban areas with large footprints and access to transportation networks.
Anchor Repurposing: As anchor tenants such as Sears and JCPenney exit, repurposing these stores into larger-format retailers, fitness centers, or indoor sports complexes offers a chance to create new, engaging destinations for local communities.
Partial Redevelopment: Many B malls are hindered by outdated, closed-off designs. By opening spaces, adding green areas, outdoor-facing stores, and lifestyle features, developers can create more inviting environments that appeal to today’s consumers.
Revitalizing B Malls – The Case of Hawthorn Mall
Hawthorn Mall, a premier two-story super-regional shopping center in Vernon Hills, Illinois, is one B Mall currently undergoing a significant transformation – and early data suggests that the revitalization efforts are already bearing fruit.
Owned by Centennial Real Estate, Hawthorn is strategically positioned at the intersection of Lake County’s key thoroughfares, offering exceptional convenience and accessibility. The center is anchored by major brands like AMC, Dave & Buster’s, JCPenney, and Macy’s, with a diverse mix of more than 60 retailers and restaurants, including Anthropologie, FP Movement, H&M, Lovesac, PGA Tour Superstore, Perry’s Steakhouse & Grille, and Pure Barre. Now, in the midst of redevelopment, Hawthorn is evolving into a vibrant mixed-use community, integrating luxury residential, expanded retail and dining, and pedestrian-friendly spaces.
Although the Hawthorn Mall redevelopment is still under way, visit quality to the mall has already improved – with the median visit duration rising from 54 minutes between April 2022 and March 2023 to 61 minutes between April 2024 and March 2025. The median household income in Hawthorn’s captured market has increased as well, perhaps thanks to the addition of a luxury apartment complex on the mall’s property. Lastly, the share of evenings visits also grew, suggesting that Hawthorn's revamped dining and entertainment are making it an increasingly popular evening destination for locals.
Looking Ahead
Class-B malls represent a unique opportunity to meet both market demands and community needs through thoughtful redevelopment. While challenges such as securing financing, navigating zoning and regulatory hurdles, and managing costs exist, the potential rewards are significant. Successful redevelopment requires targeted tenant curation, strategic location, and a bold, forward-thinking vision. With expansive footprints, prime access, and adaptability, Class-B malls are perfectly positioned to evolve into dynamic, mixed-use centers – redefining retail experiences and meeting the needs of modern consumers and communities.
First Watch is continuing to add more stores to its fleet, and visits continue to grow as well.
Shira Petrack
May 5, 2025
1 minute
Traffic to First Watch continues to climb as the company forges on with its expansion. Visits to the chain were 7.3% higher year-over-year (YoY) in Q1 2025 as visits per location held essentially steady (-0.8% YoY) – revealing that demand for the breakfast, brunch, and lunch dining concept remains robust despite the consumer headwinds.
And according to the latest monthly data, First Watch may be in even better shape than its already strong Q1 2024 visit numbers suggest. In April 2025, overall visits to the chain grew 10.5% YoY while visits per location increased by 3.0% – indicating that the morning and afternoon-focused dining brand likely still has more room to grow.
Direct-to-consumer retailers Warby Parker and Allbirds have taken different approaches to their brick-and-mortar stores - Warby Parker has been expanding while Allbirds has shrunk its store fleet. How are the two retailers faring thus far into 2025? We took a closer look.
Bracha Arnold
May 5, 2025
3 minutes
While Warby Parker and Allbirds both originated as direct-to-consumer brands, they have since firmly established themselves as brick-and-mortar retailers. Warby Parker, known for its quirky and affordable approach to eyecare, has around 270 stores in the United States, while Allbirds, which recently underwent a significant rightsizing process, currently operates 24 stores across the country.
We took a look at the visit data for the two retailers to explore how they are faring thus far in 2025.
Optimal Optical Opportunities
Warby Parker continues to impress. The eyewear chain, which transitioned from an online-only model to physical stores in 2013, spent 2024 adding stores to its current fleet – and visit data highlights the positive impact of this expansion.
Q4 2024 and Q1 2025 visits to Warby Parker were 13.4% and 6.6% higher, respectively, than in Q4 2023 and Q1 2024. Average visits per location, too, showed growth in Q4 2024 (+4.9%), though they slowed slightly in Q1 2025. Still, Warby Parker’s ability to drive visit growth while keeping average visits per location stable suggests that its expansions are meeting with consistent demand.
Weekly visits from 2025 onward highlight the brands’ strong positioning, with YoY visit growth in most analyzed weeks. (The significant YoY visit decline during the weeks of March 31st and April 7th is likely due to the comparison with last year’s major eclipse-related promotion, during which the chain offered free solar eclipse glasses.)
Allbirds Aligns with Agility
Shoewear company Allbirds has been charting a new performance course over the last year. The chain, known for its sustainable approach to footwear, recently closed nearly a third of its U.S. fleet in an attempt to optimize its stateside operations. And this consolidation, which allows Allbirds to prioritize top-performing locations, has yielded promising results for the chain.
While YoY visits were down across all analyzed months – an anticipated outcome given the significant reduction in store count – average visits per location, a more relevant indicator of Allbirds’ performance, were up on a near-constant basis. In Q1 2025, visits declined by 35.8% YoY, but visits per location grew by 14.1%.
Monthly visits followed a similar pattern: while overall visits declined by 25.9% YoY in March 2025, visits per location were up by 23.8%. This positive trend continued into April 2025, with overall visits down by just 9.2% YoY and visits per location remaining elevated at 21.0%, suggesting a strengthened performance at the remaining Allbirds stores.
This focus on a more efficient store footprint seems to be paying off for Allbirds, allowing the chain to accurately target its most receptive audience while cutting out underperforming locations.
Direct-to-Consumer Confidence
Warby Parker and Allbirds are performing well, highlighting the importance of remaining agile and pivoting to meet evolving consumer challenges.
Will the two retailers continue to thrive? Visit Placer.ai to keep up with the latest data-driven retail news.
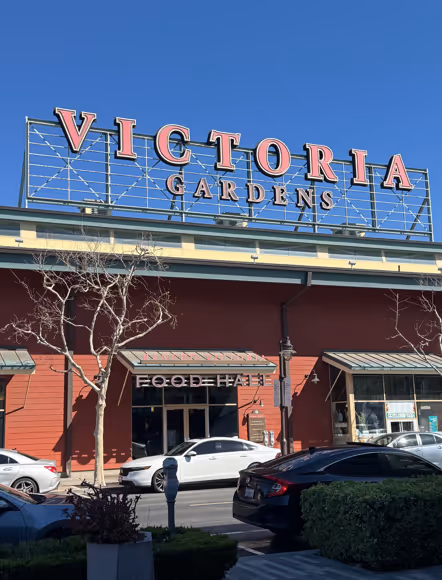
We analyzed traffic data for one of the most-visited open-air shopping centers in the nation, Victoria Gardens, to see what sets it apart and what continues to draw consumers to open-air centers.
Caroline Wu
May 2, 2025
3 minutes
Continued Draw of Open-Air Shopping Centers
Some moments in our lives remain ingrained in our heads. One such time period was March of 2020, when it felt like the world suddenly stood still as malls, street retail, and dining establishments closed, everyone masked up, and only essential retail and health services continued. After a while, limitations relaxed, but not without a subconscious preference for open-air shopping centers that appears to linger to this day. Granted, many open-air shopping centers are also newer or redeveloped, thus likely contributing to their popularity. However, there’s no doubt that they’ve rebounded at a higher rate compared to their indoor mall and even outlet mall counterparts.
We analyzed traffic data for one of the most-visited open-air shopping centers in the nation, Victoria Gardens, to see what sets it apart and what continues to draw consumers to open-air centers.
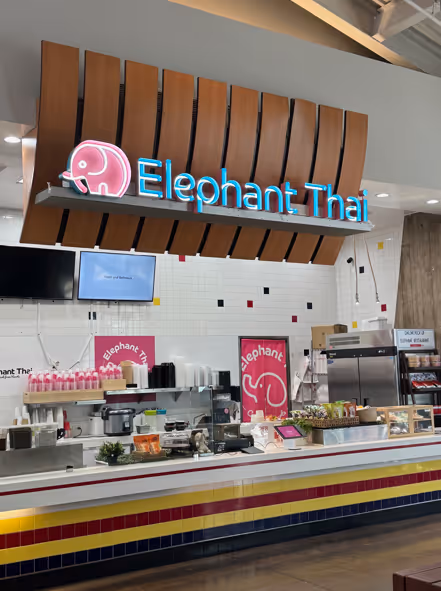
This open-air shopping center is over 1.1 million square feet and hosts over 160 retailers within its borders. In addition to marquee brands such as Apple, lululemon, AMC Theatres, and Cheesecake Factory, it also has regional favorites such as Seven Grams dumpling house and cult-favorite Duck Donuts. Boasting a 160 acre main street community, its walkable layout beckons while classics play in the background. Quite a few of the concepts at Victoria Gardens are on trend. For instance, the Food Hall features local eatery Elephant Thai, which is perfectly in keeping with the popularity of all things Thai these days with Season 3 of White Lotus being set in Koh Samui.
Photo by Caroline Wu
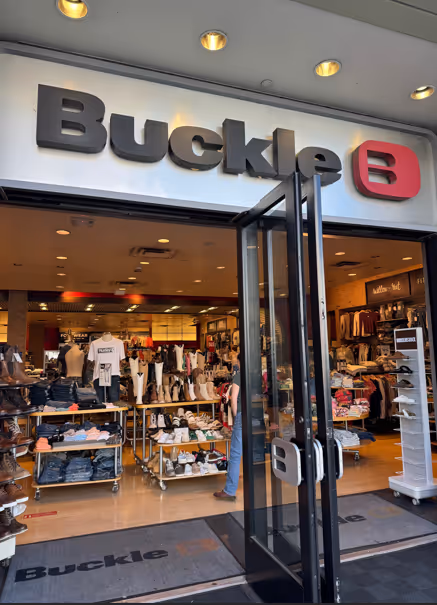
Another genre that one doesn’t often see in more urban mall locations are two retailers devoted to Western wear – Buckle and Tecovas.
Tecovas has a fascinating backstory with its founder, Paul Hedrick, partnering initially with bootmakers from Leon, Mexico, the “boot-making capital of the Americas” and selling his first pairs from the backseat of his SUV. With an average dwell time of 40 minutes between April 2024 and February 2025 and holiday spikes for Thanksgiving and Christmas, it’s clear that for many shoppers, a pair of Tecova boots are on their wishlist.
One of the more unique aspects of this mall is its Cultural Center on premise. With a performing arts theater, library, and interactive children’s museum right next to retail, dining, and a movie theater, it’s truly a one-stop shop for its community.
As shopping centers continue to evolve, with many adopting a Town Square approach, the appeal of open-air shopping centers – full of public spaces, greenery, walkable paths, and fresh air – will only continue to grow.
Discover how mall anchors are transforming in 2025 – and how a foot-traffic-focused approach to choosing key tenants can drive visits and shopper engagement.
May 29, 2025
8 minutes
Key Takeaways
1. Experiential and niche retailers can deliver anchor-level traffic. At Towne East Square Mall, the addition of a Scheels in 2023 significantly increased foot traffic and long-distance travelers, while Barnes & Noble at Coronado Center in Albuquerque has become a key driver of both foot traffic and higher-spend demographics.
2. Size isn’t everything – especially for dining venues. At Glendale Galleria and Northridge Fashion Center, smaller restaurants attracted more foot traffic than some traditional anchors.
3. Refocusing on tenants’ actual traffic contributions enables a flexible anchor approach. Balancing weekend draws like Scheels with weekday favorites such as Costco or Chick-fil-A can help maintain steady visitor flow throughout the week. Similarly, onsite fitness clubs can shift traffic to earlier in the day – an opportunity to adjust store hours and capture additional morning shoppers.
4. Temporary pop-ups can form an integral part of a visit-focused anchor strategy. The Barbie Dreamhouse Living Truck Tour generates mall visit spikes well above typical Saturday levels. Operators can integrate these events into their overall anchor strategies, offering preferential terms to high-performing pop-ups.
5. New tenants can boost traffic for existing stores in similar categories. After Aldi joined Green Acres Commons in February 2020, visits to an existing BJ’s Wholesale Club trended upwards. This synergy highlights how overlapping audiences can become a strength, creating a larger overall customer base.
The Retail Comeback Kid
Malls, it seems, are cool once again. After languishing in the wake of the pandemic, shopping centers across the country are thriving – reinventing themselves as prime “third places” where people can hang out, shop, and grab a bite to eat.
One key driver behind this resurgence is a shift in how malls view their anchor tenants. While traditional mainstays like Macy’s and JCPenney still play an important role, specialized offerings – from popular eateries to fitness centers and immersive retailtainment destinations – are increasingly taking center stage. These attractions maximize the experiential value that brick-and-mortar venues can deliver, driving visits and sales for the center as a whole.
Against this backdrop, this report leverages the latest location intelligence data to explore the types of tenants that can function as mall anchors in 2025. Should mall operators still focus on general merchandisers to draw crowds, or can dining chains and more niche retailers also do the job? How important is square footage in identifying the anchor-like tenants in a shopping center? And how can a visit-focused approach help mall operators select effective anchor or anchor-like tenants – whether to fill big-box spaces or to leverage the leasing perks traditionally reserved for major large-format chains?
Out-of-the-(Big)-Box Visit Drivers
One of the most important functions of a mall anchor is to ensure steady visitation – providing its smaller tenants with a constant flow of potential customers. And as the role of the mall continues to evolve, analyzing the actual foot traffic impacts of different types of businesses can help identify the kinds of non-traditional anchors best suited to fulfill that purpose.
The Power of a Well-Placed Scheels
Experiential venues, for example, are particularly well-poised to serve as powerful anchors in today’s retail environment – as illustrated by the visit surge experienced by Towne East Square Mall in Wichita, KS following the addition of a Scheels in July 2023.
By blending traditional retail with immersive experiences, Scheels has emerged as a true experiential destination. And this pull has also helped the mall draw more long-distance visitors willing to travel to enjoy Scheels’ offerings. In 2024, 41.9% of the mall’s customers traveled more than 50 miles to visit, compared to 35.8% back in 2018 when Sears occupied the same lot.
Scheels Anchor Brings Substantial Visit Boost to Towne East Square Mall in Wichita, KS, Attracting Visitors From Further Away
Visits to Towne East Square Mall Compared to Q1 2018 Baseline
Share of Visitors From 50+ Miles Away
Share
Embed:
The Barnes & Noble Effect
Traditionally, anchors aimed to please the widest possible audiences – with department stores, big-box chains, and grocery stores leading the way. But visitation data shows that niche concepts can also deliver anchor-level traffic if they’re compelling enough to attract dedicated fans.
The experience of the Barnes & Noble at Coronado Center in Albuquerque, NM is a case in point. After being written off as all but obsolete, Barnes & Noble has staged an impressive comeback in recent years, finding success through a more curated, localized approach to book selling. And despite not being a formal anchor, the Coronado Center Barnes & Noble accounted for 7.9% of visits to the mall in 2024 – outperforming both Macy’s and JCPenney.
Year-over-year data also shows foot traffic surging at the Coronado Center Barnes & Noble, lifting overall visitation to the mall. And demographic data reveals that the bookstore draws a more affluent audience than either the center as a whole or the two department stores – attracting a crowd with more spending power.
This example also illustrates how smaller tenants can sometimes draw larger crowds. Even though Barnes & Noble occupies a smaller onsite space than either Macy’s or JCPenney, it is proving a powerful visit driver out of proportion to its physical size.
Dining Chains Punching Above Their Size
Dining chains are also adept at punching above their square footage – often attracting crowds disproportionate to their size.
Despite its relatively small footprint, for example, the In-N-Out Burger at Glendale Galleria drew an impressive 8.6% of visits to the mall complex in 2024, outpacing some of the mall’s official anchors like DICK’s Sporting Goods, Macy’s, and JCPenney. Still, the onsite Target drew even larger crowds at 14.4% of visits.
A similar pattern emerged at Northridge Fashion Center, where Porto’s Bakery and Cafe captured a notable 15.6% of visits to the complex in 2024 – more than some of the center’s traditional department stores.
These examples underscore the potential for dining chains, which typically require less space, to serve as micro-anchors by consistently attracting outsized crowds – a key consideration for mall operators looking to sustain visitor traffic.
Choosing a Mall Anchor in 2025
Refocusing on tenants’ actual foot traffic contributions also opens the door to a more flexible and dynamic approach to anchor selection and management – one that considers each venue’s unique visitation patterns.
The Weekend/Weekday Divide
Seasonal factors, for example, can make certain anchors more powerful at specific times of the year, while different venues shine on particular days of the week.
At Jordan Creek Town Center in West Des Moines, Iowa, for instance, Scheels and Costco each delivered just under 20.0% of the complex’s overall visits in 2024. But the two retailers’ daily patterns differed significantly: Scheels saw bigger crowds on weekends, while Costco was the primary weekday destination.
Understanding differences like these can help operators optimize their tenant mix to maintain a balanced flow of shoppers throughout the week.
Another example of the impact of differing weekday traffic patterns is offered by the impact of mall-based Chick-fil-A locations on the distribution of mall visits throughout the week.
Despite its relatively small size, Chick-fil-A draws substantial traffic to malls. And after adding Chick-fil-A locations, both Northridge and Miller Hill Malls saw meaningful drops in the share of visits to the centers taking place on Sundays – even as the wider indoor mall segment saw slight upticks.
Recognizing this trend could prompt mall operators to compensate by adding more weekend-friendly traffic drivers – or to lean into this distinction by taking additional steps to bolster the mall’s role as a go-to weekday destination.
The Early-Morning Fitness Advantage
The power of different mall traffic magnets also varies throughout the day. Increasingly, shopping centers are turning to fitness centers as experiential anchors. And since many people work out early in the morning, these gyms are having a significant impact on the distribution of mall visits across dayparts.
The addition of gyms to Northshore Mall in Peabody, MA and Jackson Crossing in Jackson, MI, for instance, led to a significant rise in visits between 7:00 AM and noon. And though the rest of the stores in these malls typically open at 10:00 or 11:00 AM, this shift presents the centers with a significant opportunity.
By adjusting opening hours to accommodate these early-morning patrons, malls can capitalize on this added traffic, driving up visits and sales for relevant tenants – especially health-focused retailers such as juice bars and sporting goods stores.
Adding Temporary Pop-Ups Into the Mix
Adopting a broader, visit-focused view of anchoring also allows mall operators to apply some of the strategies typically reserved for anchors to non-conventional traffic-generating businesses, to ensure a consistent flow of traffic year-round.
Pop-up stores and events, for example, generally don’t follow the same seasonal trends as other retailers – instead, they generate short-term visit boosts during their runs, whenever in the year that may be. And a visit-focused anchor strategy can leverage some of the perks traditionally reserved for anchor tenants – such as preferential leasing terms – to complement traditional full-time anchors during slower retail periods.
The Barbie Dreamhouse Living Truck Tour is a prime example of a traffic-driving pop-up. By bringing exclusive merchandise to malls across the U.S., the truck generates plenty of buzz, drawing crowds eager to snatch up limited-edition items and immerse themselves in all things Barbie. As a result, malls hosting the tour often see significant visit spikes, with foot traffic surging well above typical Saturday levels. Well-timed pop-ups like these can help balance out traffic throughout the year, offsetting traditional slow periods.
Creating a Bigger Visit Pie
A visit-focused approach to anchor management can also help mall operators assess the potential impact of new tenants on existing stores operating in similar categories. For example, mall owners often worry that new tenants operating in similar categories might cannibalize existing businesses. But a visit-focused anchor approach reveals that a well-chosen addition can sometimes benefit current tenants – especially if they cater to similar audiences.
In February 2020, for instance, value supermarket Aldi opened at Green Acres Commons in Valley Stream, NY – a center that already hosted budget-friendly BJ’s Wholesale Club. While BJ’s visits were relatively flat in 2018 and 2019, they began to rise after Aldi’s opening (and following a pandemic-induced dip). Cross-shopping data also shows that Aldi customers were more likely to visit BJ’s than the average Green Acres patron last year.
This synergy may be due in part to the two retailers’ similar visitor bases: In 2024, the Aldi and BJ’s stores in Green Acres Common drew shoppers with comparable economic profiles. This suggests that overlapping audiences can become a strength if aligned brands attract new shoppers, who then explore multiple stores in the same center.
Visits to BJ's Wholesale Club Took Off After Addition of Aldi to Green Acres Commons – Perhaps Buoyed by Audience Similarity
Visits to Green Acres Commons BJ's Wholesale Club, Compared to Q1 2018 Baseline
Median HHI, 2024*
Cross-Shopping, 2024
*Median HHI based on STI: PopStats dataset combined with Placer.ai data for captured trade areas.
Looking ahead, effective mall anchors will be defined less by physical footprint and more by their capacity to maintain consistent, valuable foot traffic. While traditional department stores remain pivotal, smaller or niche brands can often rival – or surpass – large-format retailers. And by thinking out of the anchor box and choosing tenants that cultivate a balanced visitor flow and align with local preferences, operators can position their centers as true go-to destinations.
Dive into the data to see the trends shaping the grocery space in 2025 and uncover actionable insights for strategic decision-making in the competitive food-at-home market.
May 15, 2025
8 minutes
Key Takeaways:
1. Shoppers are taking more, shorter trips to grocery stores.Over the past 12 months, grocery stores have experienced nearly uniform YoY visit growth. And since COVID, the segment has steadily increased both overall visits and average visits per location – even as average dwell times have consistently declined.
2. Grocery stores are holding ground against fierce competition. Despite growing inroads by discount and dollar stores, wholesale clubs, and general mass retailers like Walmart and Target, grocery stores have maintained their share of the overall food-at-home visit pie over the past several years.
3. Grocery visit share is most pronounced on the coasts. In Q1 2025, grocery stores claimed the majority of food-at-home visits on the West Coast, in parts of the Northeast, Mid-Atlantic, and Mountain Regions, and in Florida and Michigan.
4. Fresh-format, value, and ethnic grocery visit shares are growing at the expense of traditional chains. And in Q1 2025, fresh-format and value grocers outperformed the other sub-segments with positive YoY visit and average visit-per-location growth.
5. Hispanic markets are on the rise. Though the broader ethnic grocery sub-segment was essentially flat YoY in Q1 2025, Hispanic-focused stores recorded increases in both visits and visits per location – and have been steadily growing visits since 2021.
6. Smaller formats for the win. In Q1 2025, smaller-format grocery store locations outpaced mid-sized and larger-format ones, underscoring the power of compact spaces to deliver significant foot traffic gains.
A Study in Resilience
Brick-and-mortar grocery stores face an uncertain market in 2025. Rising food-at-home prices (eggs, anyone?), declining consumer confidence, and increased competition from discounters, superstores, and online shopping channels all present the segment with significant headwinds. Yet even in the face of these challenges, the sector has demonstrated remarkable resilience – growing its foot traffic and holding onto visit share.
What strategies have helped the segment navigate today’s tough market? And how can industry stakeholders make the most of the opportunities in the current market? This report draws on the latest location intelligence to uncover the trends shaping grocery retail in early 2025 – highlighting insights to help key players make informed, data-driven decisions on store formats, product offerings, and more.
Growth in Aisle One
The grocery segment has experienced nearly uniform positive year-over-year (YoY) growth over the last 12 months. This sustained performance in the face of inflation and other headwinds highlights the underlying strength of the category.
Visits Up, Dwell Time Down
What is driving this growth? Since 2022, the grocery segment has seen consistent overall visit growth that has outpaced increases in visits per location – a sign that chain expansion has played a key role in the category’s success. But the average number of visits to each grocery store has also been on the rise, indicating that the segment continues to expand without cannibalizing existing store traffic.
At the same time, visitor dwell times have been steadily dropping since 2021. This shift appears to reflect a trend towards multiple, shorter trips by inflation-wary consumers eager to avoid large, costly carts or cherry pick deals across various retailers. Many shoppers may also be placing more bulk orders online and supplementing those deliveries with brief in-store stops for additional items as needed.
The bottom line: Shoppers are taking more grocery trips overall each year, but spending less time in-store during each visit. Operators can respond to this trend by optimizing layouts and promoting “grab-and-go” areas for an even more efficient quick-trip experience.
Still in Stock
Visit share data also shows that despite fierce competition from discount and dollar stores, wholesalers, and general mass retailers, the grocery segment has steadfastly preserved its share of the overall food-at-home visit pie.
Between Q1 2019 and Q1 2025, wholesale clubs and discount and dollar stores increased their share of total food-at-home visits, gains that have come primarily at the expense of Walmart and Target. Meanwhile, grocery outlets have held firm – despite some fluctuations over the years, their Q1 2019 visit share remained essentially unchanged in Q1 2025.
So even as consumers flock to alternative food purveyors in search of lower prices, grocery stores aren’t losing ground – and on a nationwide level, they remain the biggest player by far in the food-at-home shopping space.
A Coastal Advantage
Still, grocery store visit share varies significantly by region. On the West Coast, in parts of the Northeast, Mid-Atlantic, and Mountain regions, and in Florida and Michigan, grocery stores accounted for the majority of food-at-home visits in Q1 2025. Oregon (61.6%) and Washington (59.6%) led the pack, followed by Massachusetts (59.2%), Vermont (58.5%), and California (57.9%). Meanwhile, in West Virginia, Arkansas, South Dakota, Oklahoma, North Dakota, and Mississippi, less than 30% of food-at-home traffic went to grocery stores, with more shoppers in these regions turning to general mass retailers or discounters.
Grocery store operators in lower-grocery-share regions may choose to focus on price competitiveness and convenient store locations to capture more foot traffic from competitors in the space.
Fresh and Frugal on the Rise
Which types of grocery stores are thriving the most? The grocery segment is diverse, encompassing traditional grocery chains like Kroger, Safeway, and H-E-B; budget-oriented value chains such as Aldi, WinCo Foods, Grocery Outlet Bargain Market, and Market Basket; fresh-format specialty brands like Trader Joe’s, Whole Foods, and Sprouts Farmers Market; and numerous ethnic grocers.
Examining shifts in visit share among these various grocery store segments shows that traditional grocery still dominates, commanding over 70.0% of total grocery store foot traffic.
Still, over the past several years, traditional grocers have gradually ceded ground to other segments – especially value chains. Budget grocers saw a temporary surge in visits during the panic-buying days of early 2020 – and have been more gradually gaining visit share since Q1 2023. . Fresh-format banners, which lost ground in 2021 after a Q1 2020 bump, in the wake of COVID, have also been on the upswing and appear poised to capture additional visit share in the coming months and years. And though ethnic grocers still account for a relatively small portion of the overall market, they have slightly increased their visit share, reflecting heightened consumer interest in these specialized offerings.
The Discount and Premium Edge
Recent performance metrics point to a bifurcation in the grocery market similar to that observed in other retail categories. In Q1 2025, fresh-format and value retailers – which appeal, respectively, to the most and least affluent visitor bases – saw the greatest growth in both overall visits and average visits per location.
This trend highlights the power of both value and health-focused quality to motivate consumers in 2025. And grocery players that can meet these needs will be well-positioned for success in the months ahead.
WFH Fresh-Format Lunch Crunch
One factor fueling fresh-format’s success may be its role as a convenient, relatively affordable midday lunch destination for the remote work crowd.
In Q1 2025, consumers working from home accounted for 20.2% of fresh-format grocery stores’ captured market – a significantly higher share than any other analyzed grocery segment. These stores also tended to be busier midday than the other segments. Remote workers may be stopping by to grab a quick bite – and some may be choosing to do their grocery shopping during their lunch break when stores are less crowded.
This finding suggests an opportunity for grocery operators across all segments to develop or enhance in-store salad bars and quick-serve sections to tap into the lunch rush. Likewise, CPG companies may benefit from developing more ready-made, nutritious meal options that align with these midday dining habits.
Salsa Surge
Though the broader ethnic grocery category remained essentially flat in Q1 2025, Hispanic-focused grocers emerged as a sub-segment to watch. Both overall visits and average visits per location to these stores have been on the rise since 2021.
This robust demand presents an opportunity for CPG brands and grocers across segments to expand Hispanic-focused offerings, capturing a slice of this growing market.
Less is More
Finally, store size matters more than ever in 2025. During the first quarter of the year, smaller format grocery store locations (locations under 30K square feet, across different chains) outpaced larger stores with a 3.2% YoY jump in visits, showing that bigger isn’t always better in the grocery store space.
This pattern aligns with the decrease in dwell times noted above – shoppers may be making shorter trips to smaller, more convenient grocery store locations. These quick errands are ideal for picking up a few items to supplement online orders, shopping multiple deals, or sourcing specialty products unavailable at larger grocery destinations. And to lean into this trend, grocery operators might consider testing neighborhood “micro-store” concepts, focusing on curated selections, and offering convenient parking or pickup to match consumer preferences for targeted purchases and quicker trips.
Final Thoughts
Location intelligence reveals a growing, dynamic grocery landscape which is holding its ground in the face of increased competition. Shorter trips, busier lifestyles, and changing work routines are reshaping in-store experiences. And grocery players that refine their store formats, target both lunch and on-the-go shoppers, and adapt to shifting demographics can position themselves to thrive in this competitive sector. As the market continues to evolve, continuous attention to these changing patterns will be key to maintaining and expanding market share.
Dive into the data to explore recent visitation patterns and consumer trends in the fitness space - and uncover potential keys to success, rooted in location intelligence.
May 5, 2025
8 minutes
Key Takeaways
1. Elevated visitor frequency could mean that gym-goers are getting more value out of their memberships and are therefore more likely to stay signed up. Between January and March 2025, all of the gym chains analyzed had a higher share of frequent visitors (those who visited about once a week) than in the equivalent month of 2024.
2. Fitness chains at all price tiers need to be strategic about the value they offer and the amenities that can engage budget-conscious consumers. Between Q1 2022 and Q1 2025, the captured trade area median HHI increased for all fitness subsegments – value-priced, mid-range, and high-end – suggesting that consumers swapped pricier gym memberships for more affordable options.
3. Close attention should be paid to how long visitors spend at fitness chains in order to reduce crowding and bottlenecks. Between Q1 2022 and Q1 2025, the average visit length increased at value-priced, mid-range, and high-end gyms. Floorplan and equipment improvements could be considered, as well as having trainers available to help gym-goers streamline workouts.
4. Gyms can use hourly visit data to better serve their members or use promotions to stabilize facility usage throughout the day. In Q1 2025, high-end chains received a larger share of morning visits while value-priced and mid-range fitness chains received larger shares of evening visits.
Fitness Flexes Its Muscles
Like many industries in recent years, the fitness sector has experienced significant shifts in consumer behavior. From the rise in home workouts during the pandemic to the strain of hyper-inflation, foot traffic trends to gyms and health clubs have been as dynamic as the consumers they serve.
This report leverages location analytics to explore the consumer trends driving visitation in the fitness space and provides actionable insights for industry stakeholders.
Back in Shape: The COVID Recovery
The pandemic drove several shifts in the fitness space. Widespread gym closures led consumers to embrace home-based workouts, while demand for all things fitness increased due to an emphasis on overall health and wellness. This subsequently drove a renewed interest in gym-based workouts as restrictions lifted – even as some consumers remained committed to their home workout routines.
In Q1 2023, visits to fitness chains surpassed Q1 2019 levels for the first time since the onset of the pandemic, a sign that consumers had recommitted to out-of-home fitness. And in Q1 2024 and Q1 2025, fitness chains saw further growth, climbing to 12.8% and 15.5% above the Q1 2019 baseline, respectively.
Several factors have likely driven consumers’ return to gyms and health clubs, including the desire for both social connection and professional-grade facilities difficult to replicate at home. The steep increase in cost of living has likely also played a role, since consumers cutting back on discretionary spending can enjoy multiple outings and a range of recreational activities at the gym for one monthly fee.
Getting Gains: Strong Q1 ‘25
Zooming in on weekly visits to the fitness space in Q1 2025 reveals the industry’s exceptional strength and resilience in the early part of the year.
The fitness industry experienced YoY visit growth nearly every week of Q1 2025 (and 2.4% YoY visit growth overall) with only minor visit gaps the weeks of January 20th, 2025 and February 17th, 2025 – likely due to extreme weather that prevented many Americans from hitting the gym.
And the fitness industry’s weekly visit growth appeared to strengthen throughout the quarter, defying the typical waning of New Year's resolutions. This could indicate that gym visits haven't plateaued and that consumers are demonstrating greater commitment to their fitness routines compared to last year.
Increasing Reps: Visitor Frequency Up At Leading Chains
Diving into visitation patterns for leading fitness chains highlights how increased visitor frequency drove foot traffic growth in Q1 2025.
Fitness chains tend to receive the most visits during the first months of the year as consumers recommit to health and wellness in their post-holidays New Year’s resolutions. And not only do more people hit the gym – analyzing the data reveals that gym-goers also typically work out more frequently during this period. Zooming in on 2025 so far suggests that consumers are especially committed to their fitness routines this year: Leading gyms saw an increase in the proportion of frequent visitors (4+ times a month) in Q1 2025 compared to the already significant percentage of frequent visitors in the first quarter of 2024.
Elevated visitor frequency could mean that gym-goers are getting more value out of their memberships than last year, and are therefore more likely to stay signed up throughout the year.
At the same time, the data also reveals that – contrary to what may be expected – a fitness chain’s share of frequent visitors appears to be independent of the cost of membership associated with the club: Life Time, a high-end club, and EōS Fitness, a value-priced gym, had the highest shares of frequent visitors between January 2024 and March 2025. This suggests that factors other than cost, such as location convenience, class offerings, community, or individual motivation, might be more influential in driving frequent gym attendance.
Fitness Clubs at Different Price Points
Segmenting the fitness industry by membership price tiers – value-priced, mid-range, and high-end – can reveal further insights on current consumer behavior around out-of-home fitness.
Household Income Bulks Up
In Q1 2025, the captured market* median household income (HHI) was higher than the nationwide median HHI ($79.6K/year) across all price tiers – suggesting that even value-priced fitness chains are attracting a relatively affluent audience. This could indicate that gym memberships are somewhat of a luxury and that consumers from lower-income households gave up their gym memberships altogether as they tightened their purse strings.
Analyzing the historical data since Q1 2022 also reveals that the captured market median HHI has risen consistently over the past couple of years with the largest median HHI increase observed in the captured trade areas of high-end fitness chains. This suggests that middle-income households – that are more sensitive to the rising cost of living – likely swapped pricier gym memberships for more affordable options in recent years.
These metrics indicate that fitness chains at all price tiers need to think strategically about the value they offer and the amenities that can engage budget-conscious consumers who are carefully weighing every expenditure.
*Captured trade area is obtained by weighting the census block groups (CBGs) from which the chain draws its visitors according to their share of visits to the chain and thus reflects the population that visits the chain in practice.
Average Stay Increases
Fitness clubs of all types need to manage their capacity to ensure health and safety standards and a positive experience for members. And understanding the average amount of time visitors spend at the gym can help fitness chains at every price point keep their finger on the pulse of their facilities.
Between Q1 2022 and Q1 2025, the average visit length increased at value-priced, mid-range, and high-end gyms. Value-priced gyms experienced the largest increase in average visit length – from 72.4 minutes in Q1 2022 to 74.0 minutes in Q1 2025 – perhaps due to their relatively lower-income visitors spending more time enjoying club amenities after cutting back on other forms of recreation. Meanwhile, mid-range and high-end gyms experienced relatively modest increases in average visit length, which were higher to begin with – likely due to their ample class and spa offerings and overall inviting, upscale spaces.
Elevated average visit length could mean that visitors are well-engaged and less likely to cancel their memberships. But as overall gym visits are on the rise, fitness chains may want to pay close attention to how long visitors spend at the facility. Floorplan and equipment improvements could be considered in order to reduce bottlenecks, and having trainers available to instruct on equipment usage and workout technique could help gym-goers streamline workouts.
Workouts on a Schedule
Along with average visit length, understanding the daypart in which they receive the most visits is another way that fitness chains can improve efficiency and prevent overcrowding. And analysis of the hourly visits to fitness sub-segments revealed that some fitness segments receive more morning visits while others are more popular in the evenings.
In Q1 2025, high-end chains received a larger share of visits between 6 a.m. and 9 a.m. (19.7%) than value-priced and mid-range fitness chains (11.6% and 11.8%, respectively). Meanwhile, value-priced and mid-range fitness chains received larger shares of visits between 6 p.m. and 9 p.m. (21.9% and 22.2%) than high-end chains (16.5%).
Gyms can leverage this data to better serve members, for instance by scheduling more classes during peak hours. Value-priced and mid-range gyms, which saw a larger disparity between shares of morning and evening visits in Q1 2025, might also consider incentivizing off-peak usage through discounted morning memberships or early-bird snack bar deals.
Fitness Continues to Grow
The fitness space appears to be in good shape in 2025. Visits have made a full recovery from the pandemic era and still continue to grow, indicating strong consumer demand for out-of-home workouts. And using location intelligence to analyze the behavior and demographics of visitors to gyms at different price points can help identify opportunities for driving even greater success.


.svg)