It’s been nicknamed the “Superbowl for Dealmakers” and this year’s packed ICSC Las Vegas conference paved the way for tons of pipelines. All had comfy shoes on, phones ready to scan badges, and everyone was eager to learn and network.
Based on the buzz in the booths, it’s clear that dealmakers were happy to be able to meet face-to-face. High-demand retail locations are staying strong and able to command higher rents. However, there are also landlords in areas with less demand willing to negotiate and toss in reduced rent or concessions. With higher costs for construction and borrowing and limited supply in hot areas, both landlord and tenants are getting creative with solutions. Some are carving up vacant anchors for non-traditional tenants or experimenting with smaller footprints and more curated merchandise. Kroger is launching new concepts within the ethnic grocery space. Meanwhile others are taking advantage of large spaces to create experiential flagships, as we noted in the panel on “Shifting Store Formats” that Placer participated in, along with Kohl’s, CBRE, and Colliers. Other fascinating panels included understanding the impact of influencer marketing and innovations that are revolutionizing the shopping experience.
In a panel on “The Office - The Effect of Flexible Work Models on Foot Traffic,” a panel including Avison Young, CBRE, and Placer discussed how shoppers are shifting their times and locations for shopping, dining, fitness, and entertainment as a result of migration and varying remote and hybrid work schedules.
Over the course of the conference, one city kept popping up in conversation and that city was Miami. Whether it was cocktail party conversation, pub crawl chit chat, or booth banter, people kept lauding how this city barely missed a beat during COVID, new residents kept flocking in, its vibrant and cosmopolitan feel, and the opportunity for new concepts and store openings here. Let’s unpack some of the things happening in Miami.
Migration
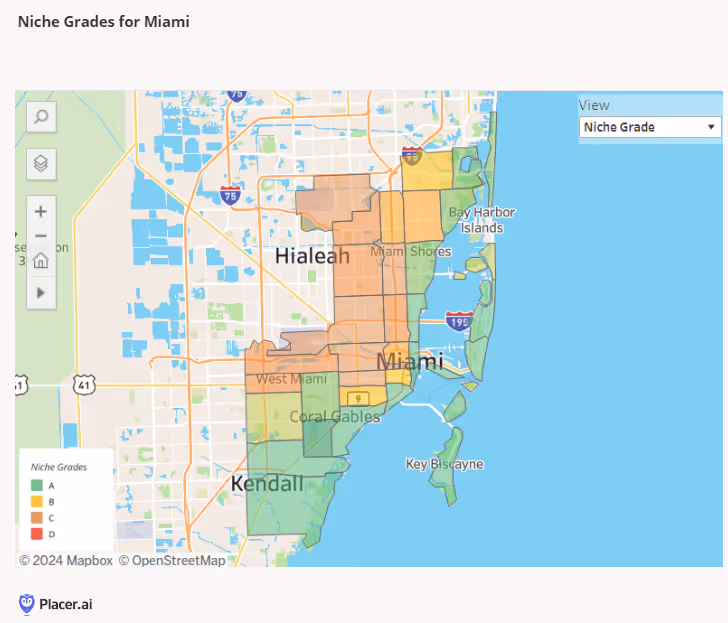
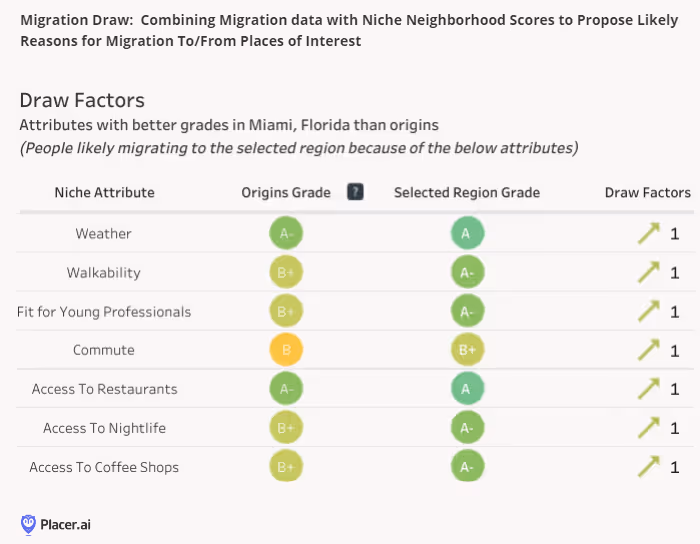
Using Placer’s Migration Dashboard and honing on our Migration Draw tool, we see that Miami’s coastal areas are extremely attractive to residents.
Some of the factors that most affect Miami’s desirability include weather, being pedestrian-friendly, and superior access to restaurants and nightlife.
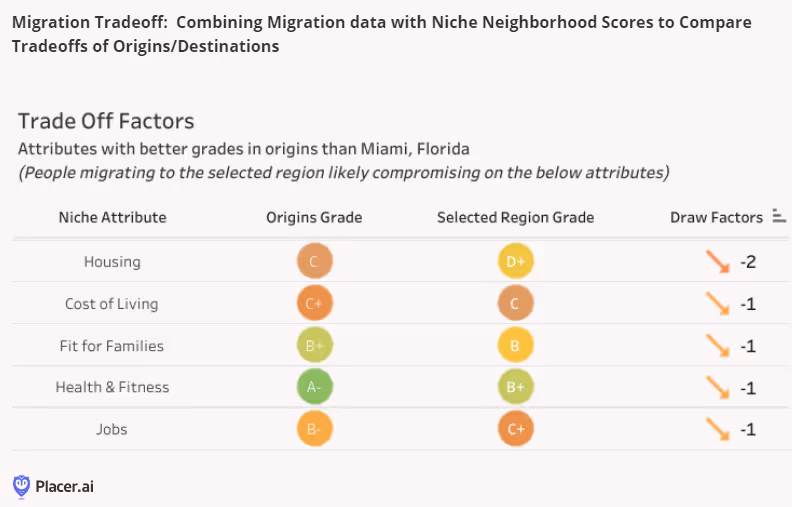
There are of course some trade-offs as well, such as higher housing costs and overall cost of living than many transplants’ original locales.
Nightlife
If you want to party in the city where the heat is on, Miami's the place for you. Taking a look at the time period of 6pm- midnight, nightlife visits in Miami outnumber those in East Williamsburg, Capitol Hill, or Deep Ellum.
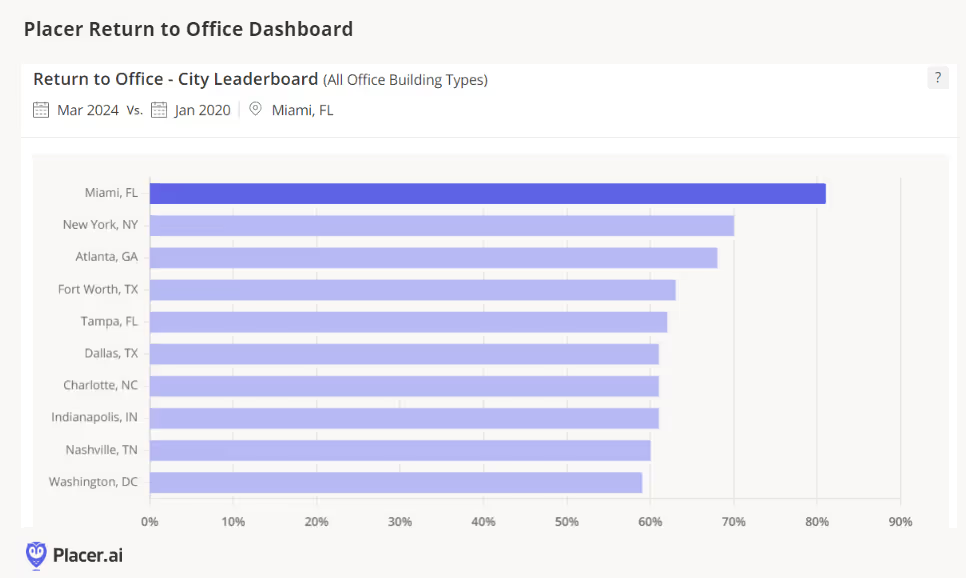
Return to Office
In an interesting twist, Miami also leads in having the highest rate of return-to-office. How do they manage to do that if they’ve been out partying? It’s likely a work hard/play harder mentality. Or, like many at ICSC mentioned, Miami never really closed down as much as other cities during Covid, hence there is less to recover from. Placer's Office Dashboard notes that Miami is in the lead with the highest recovery rate.
Shopping and Entertainment
For those who love all things retail, there are plenty of shopping centers and shopping areas to choose from. Brickell City Centre has seen some of the largest year-over-year increases. Meanwhile, Aventura’s April visits are up considerably compared to last year. The Miami Design District, which the Anchor has written about previously, has also been showing consistent year-over-year growth this year.
DICK'S Sporting Goods is one of the biggest names in the sportswear retail segment. We take a look at the brand, as well as its House of Sport banner, to see how 2024 is treating the chain so far.
Bracha Arnold
May 23, 2024
DICK’S Sporting Goods is one of the best-known names in the sportswear and sporting goods retail segment, with more than 700 stores across the country. The company, which also operates several smaller banners including its interactive House of Sport, has thrived in recent years, buoyed by a continued interest in health and wellness.
How is the chain faring into 2024? We took a look at the latest location intelligence to find out.
DICK’S Holds Onto Gains – Outperforming Apparel and Sportswear
DICK'S was a major pandemic-era winner, sustaining visit gains through 2021 and 2022 and into early 2023. And though YoY visits slowed as 2023 wore on, DICK’s ended last year in a strong position, reporting the largest sales quarter of its history in Q4 2023.
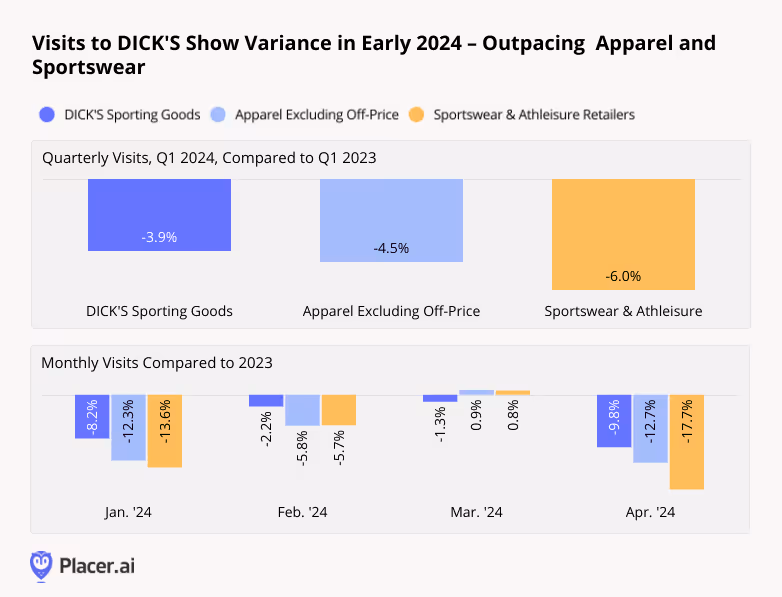
And in early 2024, DICK’s largely held on to its gains. Like many retailers, DICK’S saw YoY foot traffic fall in January, as unusually cold and stormy weather kept many shoppers at home. But in February and March, the chain’s YoY visit gap narrowed considerably, with foot traffic hovering just under 2023 levels – no small feat for a discretionary chain in an environment marked by stubbornly elevated prices and flagging consumer confidence.
During most analyzed months, DICK’S outperformed both traditional Apparel and Sportswear & Athleisure retailers. And though the chain saw monthly YoY foot traffic drop once again in April, an analysis of weekly data shows that it entered May on an upswing.
Weekly Visits Rally
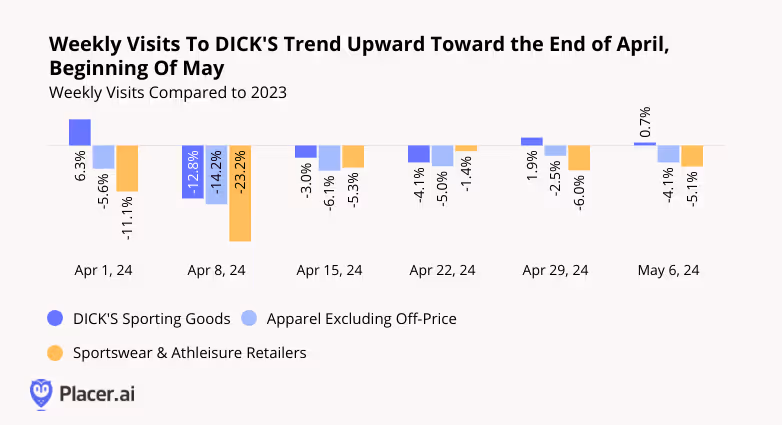
Indeed, zooming into weekly visits to DICK’S shows that only during the week of April 8th, 2024 did the chain experience a large visit gap. And visits to the sportswear company began to trend upward towards the end of April and beginning of May – with YoY visits growing by 1.9% during the week of April 29th, and by 0.7% in the week of May 6th. The company also outperformed the Apparel and Sportswear segments in all but one of the analyzed weeks – Sportswear retailers had a slightly stronger showing than DICK’S did for the week of April 22.
Visitors Linger at House Of Sport
Experiential retail has emerged as a significant success story in recent years, and DICK’S has enthusiastically embraced the trend. In 2021, the company introduced its House Of Sport concept, offering visitors the opportunity to browse athletic gear or try their hand at a climbing wall or a batting cage.
The concept quickly gained traction, expanding to fourteen locations, with several more slated to open in 2024 alone. And an analysis of visitation patterns at DICK’S House Of Sport locations shows why the model is such a powerful one.
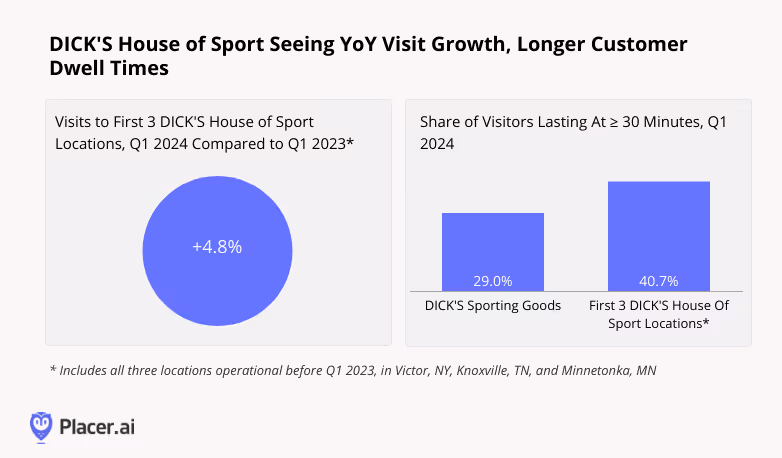
In Q1 2024, YoY visits to the three original House of Sport locations in Victor, NY, Minnetonka, MN, and Knoxville TN – the only ones operational at the start of 2023 – increased by 4.8%. So as DICK’S continues to expand its portfolio of House of Sport locations, existing ones are also drawing bigger crowds.
The original House of Sport locations also drew more extended visits in Q1 2024 than other DICK’s locations – with a remarkable 40.7% of visits lasting more than 30 minutes. With the success of House of Sport under its belt, DICK’S has begun further diversifying its fleet with a new store format that brings an interactive retail experience to the chain’s traditional store type.
Last Thoughts
DICK’S continues to outperform the wider Apparel and Sportswear retail segments, and its expanding House of Sport concept is meeting healthy and growing demand. As the company continues to lean into its experiential offerings, will the chain’s positive momentum accelerate further?
Visit placer.ai for the latest data-driven retail insights.
Dive into the data to see how leading auto parts chains are faring in early 2024 – and explore factors driving success in a thriving segment.
Samuel Roche
May 22, 2024
3 Minutes
As cars get more expensive, demand for repairs rises – and auto part chains are reaping the benefits. We analyzed the visit data for four leading auto part chains – AutoZone, O'Reilly Auto Parts, NAPA Auto Parts and Advance Auto Parts – and dove into O’Reilly Auto Parts’ recent growth to understand what may be driving success in this flourishing segment.
Could 2024 Be the Year of Auto Parts?
Auto parts chains are having a moment. With vehicle prices significantly higher than before COVID, many consumers would rather fix their cars than purchase new ones. At the same time, inflation has begun to subside, leaving people with more room in their budgets for non-essential maintenance and repairs.
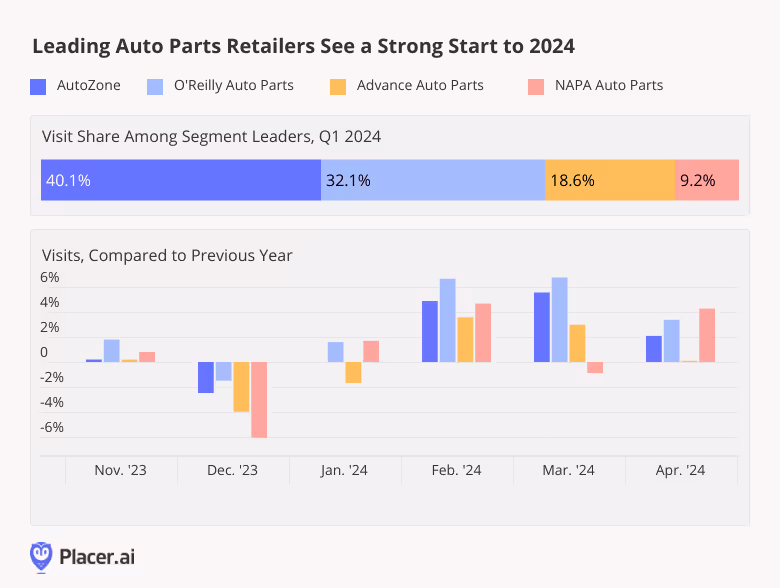
Following a drop in December 2023, YoY visits to AutoZone, O’Reilly Auto Parts, Advance Auto Parts, and NAPA Auto Parts began to pick up in January 2024 – despite unusually cold and stormy weather that left many consumers hunkered down at home. And between February and April, YoY visits to the four chains remained nearly uniformly elevated.
On a quarterly basis, O’Reilly Auto Parts saw the biggest YoY visit increase, despite lapping a strong 2023. The chain, which drew 32.1% of total visits to the four brands in Q1, saw quarterly YoY foot traffic increase by 5.1%. AutoZone, which received 40.1% of quarterly visits to the four chains, saw quarterly YoY visits increase by 3.5%. And Advance Auto Parts and NAPA Auto Parts both saw quarterly YoY visits increase by 1.7%.
O’Reilly’s Successful Loyalty Program
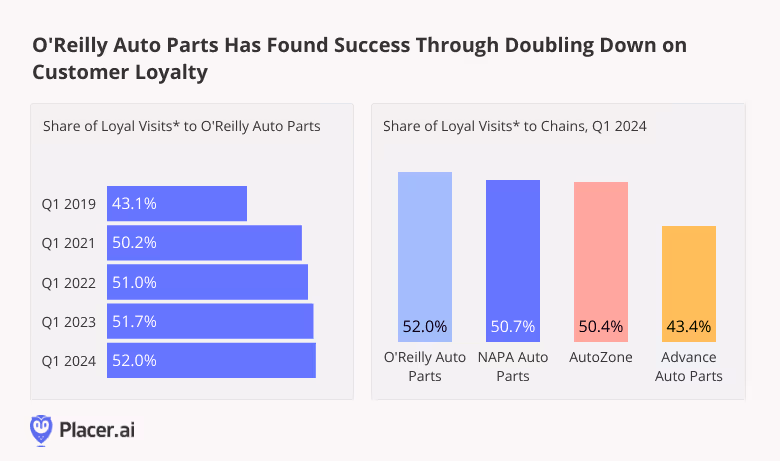
One strategy that has likely helped O’Reilly Auto Parts stay ahead of the pack is its much-touted loyalty program, recently ranked by Newsweek as one of the best in the nation.
Location intelligence shows that since COVID, O’Reilly Auto Parts has seen a steady increase in the loyalty of its customer base. And in April 2024, O’Reilly Auto Parts boasted the most loyal customer base of the four analyzed chains – with 52.0% of visits made by individuals that frequented the chain at least twice during the month. But other auto chains, including AutoZone, also enjoyed significant shares of visits by repeat customers – showing that there’s plenty of room at the top in the auto parts space.
Auto Parts Promising Year
The auto parts industry is poised for success in 2024, with leading chains like O'Reilly Auto Parts, AutoZone, Advance Auto Parts, and NAPA Auto Parts demonstrating resilience and growth. How will these chains continue to perform as the year wears on?
CAVA is growing rapidly, with plans to reach 1,000 locations by 2032. How is the fast-casual chain performing across its major markets? We take a closer look.
Shira Petrack
May 21, 2024
3 minutes
We looked at nationwide and regional visitation patterns for CAVA to understand how the fast-growing fast-casual chain is performing across its major markets.
CAVA’s Expansion Driving Visit Growth
CAVA – which operated a little over 300 locations by the end of 2023 – is growing rapidly, with plans to reach 1,000 locations by 2032. The chain has seen consistent year-over-year (YoY) visit growth in most of its major markets, with a 23.6% YoY overall increase in nationwide visits in Q1 2024 – in large part due to its ongoing expansion.
CAVA is headquartered in Washington, D.C., and currently, most of its venues are located in the mid-Atlantic and southeastern United States. But the chain also has a strong presence in Texas and California and operates restaurants in a handful of additional states. Recently, CAVA entered the Midwest with its first Chicago location – and has plans to extend its reach even further. So what do CAVA’s various markets have in common – and what sets them apart?
CAVA Attracts Affluent Diners Across Its Major Markets
Nationwide, the median household income (HHI) in CAVA’s captured market trade area is higher than the US median HHI – and diving into the regional markets indicates that this trend persists across regional markets.
In most states with a major CAVA presence – including Texas, Virginia, California, North Carolina, Georgia, and Maryland – the median HHI in CAVA’s trade area is 11% to 24% higher than the statewide median. Even in Florida, where the chain’s trade area HHI is closest to the statewide median, households in CAVA’s captured market are still slightly more affluent than in Florida as a whole.
Differences in Dining Habits
But while the chain seems to attract a similar demographic across states, diving into the hourly visitation patterns in CAVA’s various markets indicates that dining habits differ between regions.
In Texas, Georgia, Florida, and North Carolina, the share of 11:00 AM - 10:00 PM CAVA visits taking place during the lunchtime daypart (11:00 AM - 2:00 PM) ranges from 35.5% to 36.9% – at or above the nationwide average of 35.4%. But in Virginia and Maryland, and especially California, the lunchtime rush is more subdued. In these states, the afternoon and evening dayparts tend to be busier than in the other analyzed states – with California in particular seeing 35.7% of visits taking place between 6:00 PM and 10:00 PM.
CAVA’s Path to Nationwide Ubiquity
Identifying similarities and differences between the visitor bases in CAVA’s various markets can help the company identify ideal locations, optimize staffing needs, and tailor promotional efforts as it continues to enter new markets and open additional restaurants in existing ones.
For more data-driven dining insights, visit placer.ai/blog.
How did Mother’s Day impact retail and dining foot traffic this year? We dove into the data to find out.
Lila Margalit
May 20, 2024
3 minutes
How did Mother’s Day (May 12th, 2024) impact retail and dining foot traffic this year? We dove into the data to find out.
The Hallmark Holiday
Urban legends notwithstanding, Mother’s Day wasn’t actually created by the greeting card industry. But the occasion hasn’t become known as the “Hallmark holiday” for nothing. Every year in the run-up to Mother’s Day, shoppers descend on the chain to purchase everything from cards to candy.
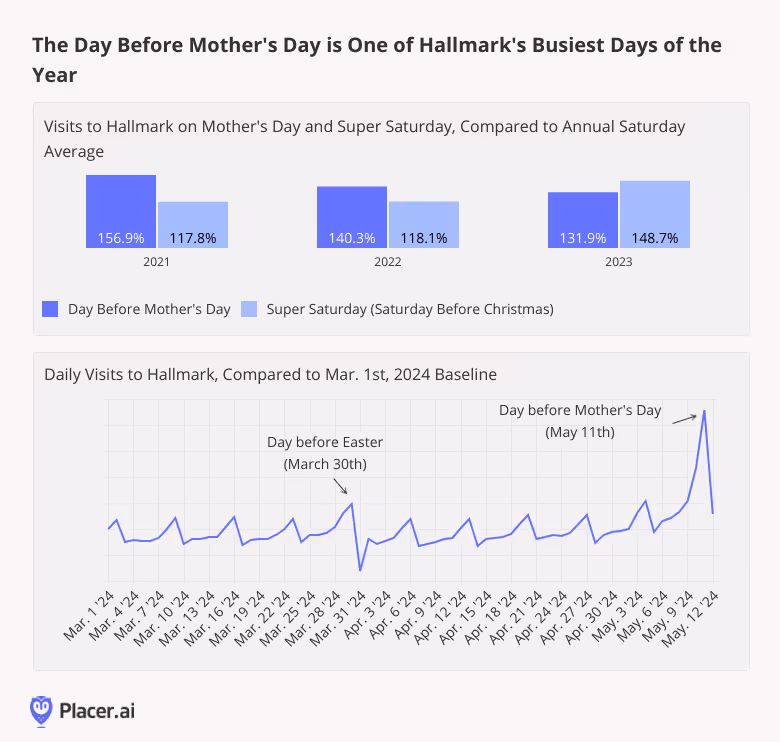
Most years, the day before Mother’s Day is Hallmark’s busiest day of the year, with Super Saturday (the Saturday before Christmas) a not-so-close second. In 2023, Mother’s Day was edged out by Super Saturday, which converged with Christmas Eve Eve to create a pre-holiday shopping bonanza for the ages.
And this year is shaping up to be no different: On May 11th, 2024 (the day before Mother’s Day), Hallmark experienced a major visit spike – leaving all other Saturdays, including the Saturday before Easter, in the dust.
A Variety of Retail Categories Benefit From Mother’s Day
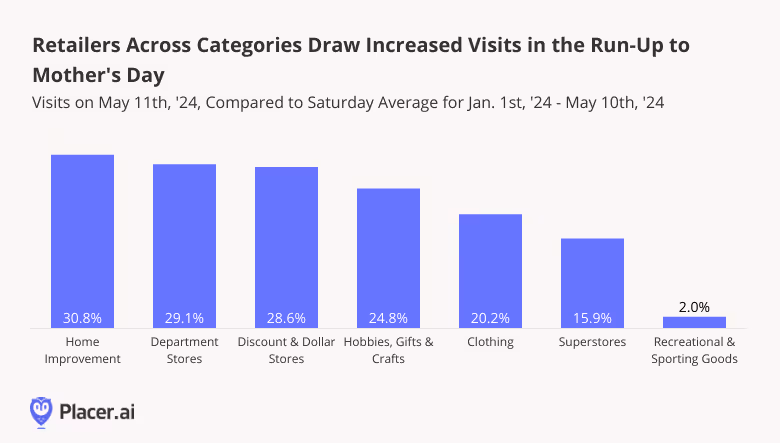
But greeting card retailers like Hallmark aren’t the only ones to benefit from Mother’s Day. A look at foot traffic to major industries on May 11th, 2024 shows that retailers across segments – from Home Improvement chains to Superstores – enjoy substantial visit boosts on the day before Mother’s Day. (Recreational & Sporting Goods, not so much).
For Home Improvement, Department Stores, Hobbies, Gifts & Crafts, and Clothing, May 11th, 2024 was the busiest day of the year so far, while for Discount & Dollar Stores and Superstores it was superseded only by March 30th – the day before Easter.
Going Out to Eat: Only the Best for Mom
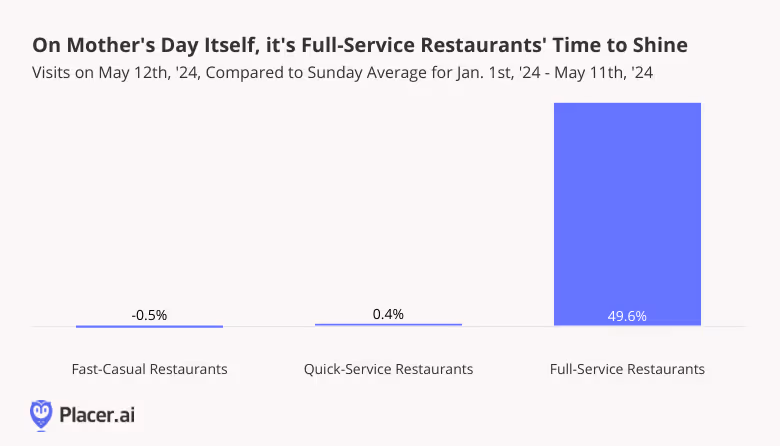
While the day before Mother’s Day is an important retail milestone, Mother’s Day itself is an occasion for treating mom to a nice meal out. And though grabbing a bite at a fast food joint or fast-casual fave is lots of fun – it decidedly isn’t the Mother’s Day vibe. A special occasion calls for a splurge, and Mother’s Day is Full-Service Restaurants’ time to shine.
On May 12th, 2024, Quick-Service and Fast-Casual Restaurants received about the same number of visits as on an average Sunday this year. But Full-Service Restaurants saw visits skyrocket – outperforming an average Sunday by 49.6%.
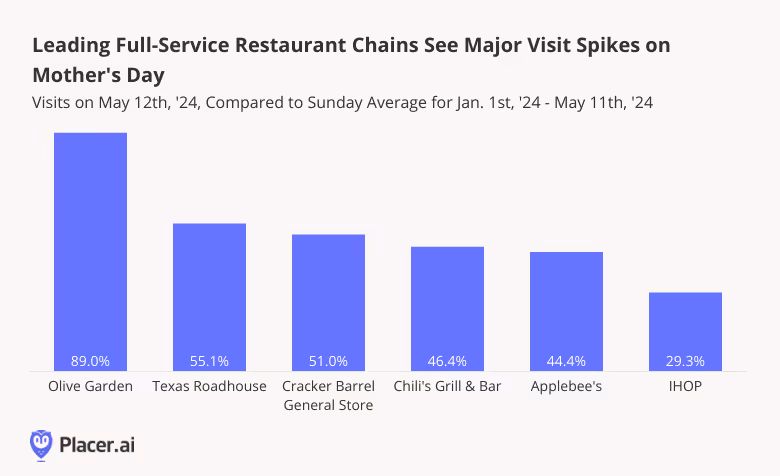
A Day for Olive Garden
And drilling down into the data for six of Mother’s Day’s busiest Full-Service Restaurant chains shows Olive Garden emerging as a major holiday winner – with 89.0% more visits on May 12th, 2024 than on an average Sunday this year. Olive Garden drew more visits this Mother’s Day than on any other day since the beginning of the year – with Valentine’s Day (February 14th, 2024) coming in a close second.
But the Italian-American cuisine giant certainly isn’t the only FSR to enjoy a substantial visit boost on the big day: Texas Roadhouse, Cracker Barrel General Store, Chili’s Grill & Bar, Applebee’s, and IHOP saw respective May 12th visit increases of 55.1%, 51.0%, 46.4%, 44.4%, and 29.3%, compared to an average Sunday.
Final Thoughts
Mother’s Day comes but once a year – and grateful offspring nationwide show their appreciation with gifts and celebratory meals, generating boons for businesses across categories.
With Father’s Day right around the corner, what kind of impact will Dad’s big day have on retail and restaurant visits? Will Recreational & Sporting Goods brands have their day in the sun?
For more data-driven retail and dining insights, follow placer.ai.
Monthly YoY mall visits declined in April – but weekly data paints a very different picture. Dive into location analytics to discover whether shopping center visits are still on an upswing, and how malls were impacted by Easter shopping trends.
Maytal Cohen
May 16, 2024
3 minutes
About the Mall Index: The Index analyzes data from 100 top-tier indoor malls, 100 open-air shopping centers (not including outlet malls) and 100 outlet malls across the country, in both urban and suburban areas. Placer.ai leverages a panel of tens of millions of devices and utilizes machine learning to make estimations for visits to locations across the country.
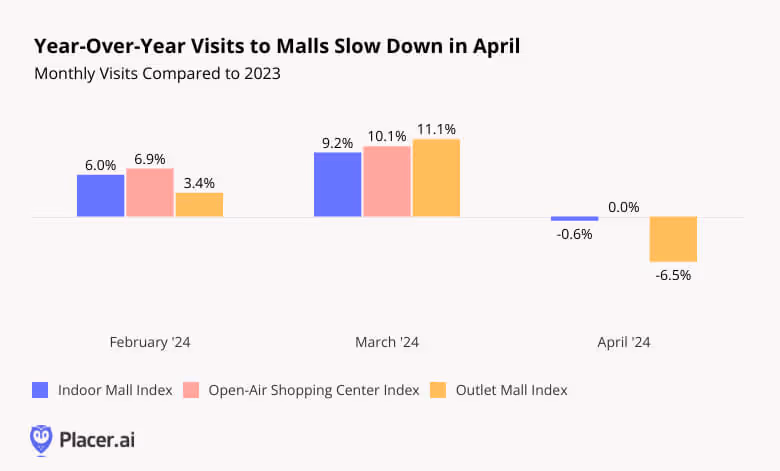
April Foot Traffic Trends: A Mall Visit Slowdown
In April 2024, YoY mall visits slowed following two months of positive visit growth. For Indoor Malls, the decline was marginal – and Open-Air Shopping Centers saw visits remain on par with last year’s levels. But Outlet Malls saw a significant drop of 6.5% in visits.
Although at first glance this slowdown may suggest a resurgence of the retail challenges that plagued much of 2022 and 2023, a deeper dive into weekly visit trends paints a much rosier picture.
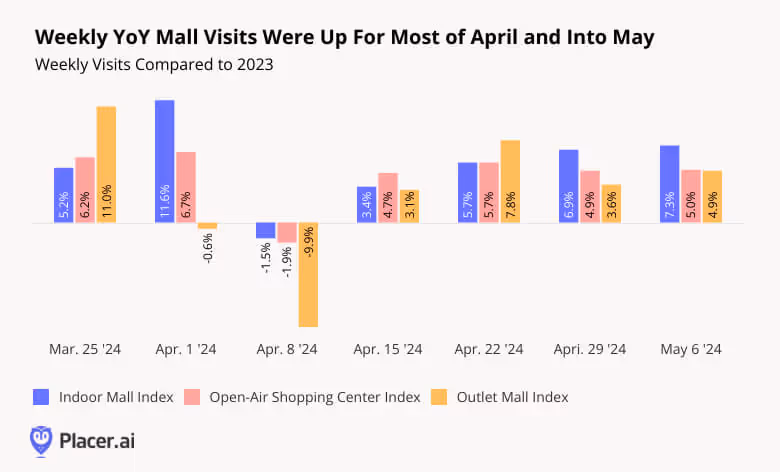
April Weekly Visits Show: Mall Foot Traffic Remains Strong
Indoor Malls and Open-Air Shopping Centers experienced robust YoY visit increases every week of April 2024 and into May, with the sole exception of the week of April 8th. This isolated drop appears to be due to a calendar discrepancy: In 2023, Easter fell on April 9th, while in 2024, the holiday fell on March 31st. So the week of April 8th, 2024 is being compared to the week immediately after the holiday (including Easter Monday) when malls likely experienced heightened activity due to gift returns and pent-up demand following holiday store closures. Though Easter Monday isn’t an official holiday in the U.S., many people likely take the day off – giving them more time to hit the stores.
Outlet Malls, which saw a steeper decline during the week of April 8th, appear to have been particularly impacted by the Easter calendar difference – shoppers may be especially likely to make the trek to an outlet mall on a holiday weekend, or on Easter Monday. But Outlet Malls also saw their positive momentum quickly recover.
The continued rise in weekly YoY mall visits signals continued retail strength into the spring of 2024.
Post-Easter Monday Visits Peak
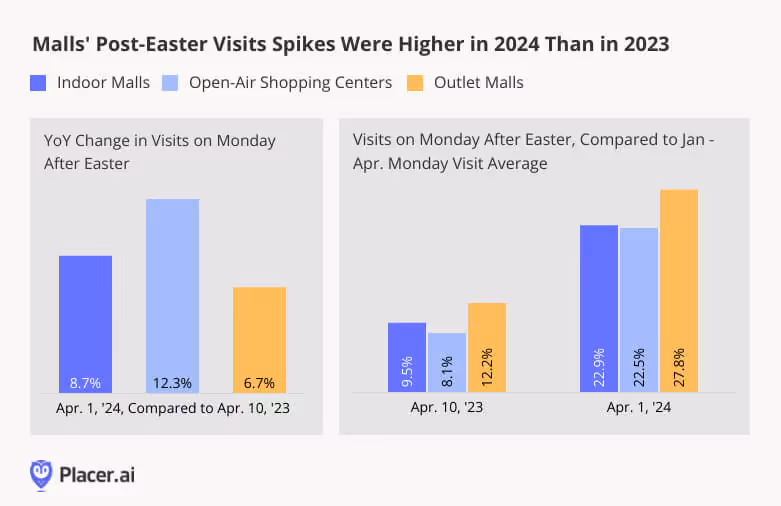
Holiday retail foot traffic is typically characterized by two main spikes: a pre-holiday visit spike evident in the days preceding the holiday, and a post-holiday uptick driven largely by gift returns and pent-up demand after stores reopen. The Monday after Easter follows this pattern – and comparing this year’s post-Easter visit spike to the one observed in 2023 provides further evidence of the category’s resilience.
On Monday, April 1st, 2024 – the day after Easter – Indoor Malls, Open-Air Shopping Centers, and Outlet Malls all drew significantly more visits than on an average Monday. And this year’s post-Easter visit spikes – ranging from 22.5% to 27.8% – were even more impressive than last year’s. Outlet Malls, which may be more likely to draw visitors on the day after Easter, saw the biggest post-Easter visit spikes.
All three mall types also saw more absolute visits this year on the day after Easter than they did in 2023 – with April 1st, 2024 foot traffic to Indoor Malls, Open-Air Shopping Centers, and Outlet Malls up 8.7%, 12.3%, and 6.7%, respectively, compared to April 10th, 2023.
Looking Ahead
Weekly YoY visit data and post-Easter foot traffic trends show that malls remain on an upward trajectory. As inflation continues to ease, malls may regain some leverage and can potentially attract crowds more readily than they did in 2023.
For more data-driven retail insights, visit our blog at placer.ai.
Dive into the data to find out how the dining category is performing in 2025, which segments are coming out on top, and how dining consumer behavior has shifted in recent years.
June 26, 2025
10 minutes
Key Takeaways:
1. Overall dining traffic is mostly flat, but growth is concentrated in specific areas.
While nationwide dining visits were nearly unchanged in early 2025, western states like Utah, Idaho, and Nevada showed moderate growth, while states in the Midwest and South, along with Washington D.C., saw declines.
2. Fine dining and coffee chains are growing through expansion, not just busier locations.
These two segments were the only ones to see an increase in total visits, but their visits-per-location actually decreased, indicating that opening new stores is the primary driver of their growth.
3. Higher-income diners are driving the growth in resilient categories.
The segments that saw visit growth—fine dining and coffee—also attracted customers with the highest median household incomes, suggesting that affluent consumers are still spending on dining despite economic headwinds.
4. Remote work continues to reshape dining habits.
The share of suburban customers at fine dining establishments has increased since 2019, while it has decreased for coffee chains. This reflects a shift towards "destination" dining closer to home and away from commute-based coffee runs.
5. Limited-service restaurants own the weekdays; full-service restaurants win the weekend.
QSR, fast casual, and coffee chains see the majority of their traffic from Monday to Friday, whereas casual and fine dining see a significant spike in visits on weekends.
6. Each dining segment dominates a specific time of day.
Consumer visits are highly predictable by the hour: coffee leads in the early morning, fast casual peaks at lunch, casual dining takes the afternoon, fine dining owns the dinner slot, and QSR captures the late-night crowd.
Year-over-Year Dining Traffic Trends
Dining Visits Mostly Up in the West, Down in Most of Midwest and East
Overall dining visits held relatively steady in the first five months of 2025, with year-over-year (YoY) visits to the category down 0.5% for January to May 2025 compared to the same period in 2024. Most of the country saw slight declines (less than 2.0%), though some states and districts experienced larger drops: Washington, D.C, saw the largest visit gap (-3.6% YoY), followed by Kansas and North Dakota (-2.9%), Arkansas (-2.8%), Missouri and Kentucky (-2.6%), Oklahoma (-2.1%), and Louisiana (-2.0%).
Still, there were several pockets of moderate dining strength, specifically in the west of the United States. January to May 2025 dining visits in Utah, Idaho, and Nevada increased 1.8% to 2.4% YoY, while the coastal states saw traffic rise 0.6% (California) to 1.2% (Washington). Vermont also saw a slight increase in dining visits (+1.9%).
Coffee & Fine Dining See Strongest Overall Visit Growth
Diving into visit trends by dining segment shows that fine dining and coffee saw the strongest overall visit trends, with visits to the segments up 1.3% and 2.6% YoY, respectively, between January and May 2025. But visits per location trends were negative for both segments – a decline of 0.8% YoY for fine dining and 1.8% for coffee during the period – suggesting that much of the visit strength is due to expansions rather than more crowded restaurants and coffee shops.
In contrast, full-service casual dining saw overall visits decrease by 1.5%, while visits per location remained stable (+0.2%) YoY between January and May 2025. Several casual dining chains have rightsized in the past twelve months – including Red Lobster, TGI Fridays, and Outback Steakhouse – which impacted overall visit numbers. But the data seems to show that their rightsizing was effective, as the remaining locations successfully absorbed the traffic and maintained performance levels from the previous year. And the monthly data also provides much reason for optimism, with May traffic up both overall and on a visit per location basis – suggesting that the casual dining segment is well positioned for growth in the second half of 2025.
Meanwhile, QSR and fast casual chains saw similar minor visits per venue dips (-1.5% and -1.2%, respectively). At the same time, QSR also saw an overall visit dip (-0.8%) while traffic to fast casual chains increased slightly (+0.3%) – suggesting that the fast casual segment is expanding more aggressively than QSR. But the two segments decoupled somewhat in May, with overall traffic and visits per venue to fast casual chains up YoY while traffic remained flat and visits per venue fell slightly for QSR – perhaps due to the relatively greater affluence of fast casual's consumer base.
Dining Demographics
Visitor Income Levels Hold Steady in Most Segments
Analyzing the income levels of visitors to the various dining segments over time shows that each segment followed a slightly different trend – and the differences in visitor income may help explain some of the current traffic patterns.
The only three segments with YoY visit growth – casual dining, fine dining, and coffee – also had the highest captured market median household income (HHI). Although the median HHI in the captured market of upscale and fine dining chains fell after COVID, it has risen back steadily over time and now stands at $98.0K – slightly higher than the $97.1K median HHI between January to May 2019. This may explain the segment's resilience in the face of wider consumer headwinds. Meanwhile, the median HHI at fast casual and coffee chains has fallen slightly, perhaps due to aggressive expansions in the space – including Dave's Hot Chicken and Dutch Bros – which likely broadened the reach of the segments, driving visits up and trade area median HHI down.
Like fine dining, casual dining also saw its trade area median HHI increase slightly over time – but the segment has still been facing visit dips. This could mean that, even though consumers trading down to casual dining may have boosted the trade area median HHI for the segment, it still might not have been enough to make up for the customers lost to tighter budgets.
The QSR segment saw its trade area median HHI remain remarkably steady – and visits to the segment have also been quite consistent – staying between $70.6K and $70.9K between 2019 and 2025 – which may explain why the segment's visits remained relatively stable YoY.
Suburban Dining Patterns
Diving into the psychographic segmentation shows that, although the fine dining segment attracted visitors from the highest-income areas between January and May 2025, fast casual chains drew the highest share of visitors from suburban areas, followed by casual dining and coffee. QSR attracted the smallest share of suburban visitors, with just 30.5% of the category's captured market between January and May 2025 belonging to Spatial.ai: PersonaLive suburban segments.
But looking at the data since 2019 reveals small but significant changes in the shares of suburban audiences in some categories' captured markets. And although the percentage changes are slight, these represent hundreds of thousands of diners every year.
The data shows that shares of suburban segments in the captured markets of fine dining chains have increased, while their share in the captured market of coffee chains has decreased. The shares of suburban visitors to QSR, fast casual, and casual chains have remained relatively steady.
This may suggest that the COVID-19 pandemic and the subsequent rise of remote and hybrid work models are still impacting consumer dining habits, benefiting destination-worthy experiences in suburban locales such as fine dining chains while reducing the necessity of daily coffee runs that were often tied to commuting and office work. Meanwhile, the stability in QSR, fast casual, and casual dining segments could indicate that these categories continue to meet consistent suburban demand for convenience and everyday dining, largely unaffected by the redistribution seen in the fine dining and coffee sectors.
Dining Consumer Behavior Trends
Although QSR, fast casual, casual dining, fine dining, and coffee all fall under the wider dining umbrella, the data shows distinct consumer behavior patterns regarding visits to these five categories.
Limited Service Leads Weekday Visit Share, Full Service Rules the Weekend
Limited service segments, including QSR, fast casual, and coffee tend to see higher shares of visits on weekdays, while full service segments – casual dining and fine dining – receive higher shares of weekend visits. Diving deeper shows that QSR has the largest share of weekday visits, with 72.3% of traffic coming in between Monday and Friday, followed by fast casual (69.8% of visits on weekdays) and coffee (69.4% of visits on weekdays.) Looking at trends within the work week shows that QSR receives a slightly larger visit share between Monday and Thursday compared to the other limited service segments. Meanwhile, coffee seems to receive the smallest share of Friday visits – 16.3% compared to 17.0% for fast casual and 17.2% for QSR.
On the full-service side, casual dining and fine dining chains have relatively similar shares of weekend visits (39.0% and 38.8%, respectively), but fine dining also sees an uptick of visits on Fridays (with 19.1% of weekly visits) as consumers choose to start the weekend on a festive note.
Each Segment Owns a Different Daypart
Hourly visit patterns also show variability between the segments. Coffee is the unsurprising leader of early visits, with 14.6% of visits taking place before 8 AM and, almost two-thirds (64.9%) of visits taking place before 2 PM. Fast casual leads the lunch rush (29.4% of visits between 11 AM and 2 PM), casual dining chains receive the largest share of afternoon (2 PM to 5 PM) visits, and fine dining chains receive the largest share of dinner visits, with almost 70% of visits taking place between 5 PM and 11 PM. QSR leads the late night visit share – 4.1% of visits take place between 11 PM and 5 AM – followed by casual dining chains (3.2% late night and overnight visit share), likely due to the popularity of 24-hour diners.
This suggests that each dining segment effectively "owns" a different part of the day, from the morning coffee ritual and the quick lunch break to the leisurely evening meal and late-night cravings.
Shorter Visits in Most Segments
An analysis of average visit duration also reveals a small but lasting shift in post-pandemic dining behavior. Between January and May 2025, the average dwell time for nearly every dining segment was shorter than during the same period in 2019. This efficiency trend is evident across limited-service categories like QSR, fast casual, and coffee shops, suggesting a continued emphasis on speed and convenience.
The one notable exception to this trend is upscale and fine dining, where the average visit duration has actually increased compared to pre-COVID levels. This may suggest that, while visits to most segments have become more transactional, consumers are treating fine dining more as an extended, deliberate experience, reinforcing its position as a destination-worthy occasion.
Dive into the data to see how consumer response to major promotional events – from Black Friday and the back-to-school shopping rush to brand-crafted LTOs – varies by market.
June 19, 2025
Key Takeaways
1. The Midwest is the only region where Black Friday retail visits outpace Super Saturday.
But several major Midwestern markets, including Chicago and Detroit, actually see higher shopper turnout on Super Saturday.
2. Holiday season demographic shifts also vary across regions.
Nationwide, electronics stores see a slight uptick in median household income (HHI) in December – yet in certain markets, electronics retailers such as Best Buy see a drop in captured market median HHI during this period.
3. Back-to-school shopping starts earliest for clothing and office supplies retailers in the South Central region, likely tied to earlier school schedules.
But back-to-school visits surge higher for these retailers in the Northeast later in the season.
4. The share of college students among back-to-school shoppers varies by region.
In August 2024, “Collegians” made up the largest share of Target’s back-to-school shopping crowd in New England, and the smallest in the West.
5. Mother’s Day drives the biggest restaurant visit spikes in the Middle Atlantic Region, while Father’s Day sees its biggest boosts in the South Atlanticstates.
Mother’s Day diners also tend to travel farther to celebrate, suggesting an extra effort to treat mom.
6. Western states proved particularly responsive to McDonald’s recent Minecraft promotion.
During the week of A Minecraft Movie’s release, the promotion drove significantly higher visit spikes in the West than in the Eastern U.S.
Zooming in on Local Trends
Retailers rely on promotional events to fuel sales – from classics like Black Friday and back-to-school sales to unique limited-time offers (LTOs) and pop-culture collaborations. Yet consumer preferences and behavior can vary significantly by region, making it critical to tailor campaigns to local markets.
This report dives into the data to reveal how consumers in 2025 are responding to major retail promotions, exploring both broad regional trends and more localized market-level nuances. Where is Black Friday most popular, and which areas see a bigger turnout on Super Saturday? Where are restaurants most packed on Mother’s Day, and where on Father’s Day? Which region kicks off back-to-school shopping – and where are August shoppers most likely to be college students? And also – which part of the country went all out on McDonald’s recent Minecraft LTO?
Read on to find out.
The Holiday Season: A Regional Story
Promotions aimed at boosting foot traffic on key holiday season milestones like Black Friday and Super Saturday are central to retailers’ strategies across industries. The day after Thanksgiving and the Saturday before Christmas typically rank among in-store retail’s busiest days, last year generating foot traffic surges of 50.1% and 56.3%, respectively, compared to a 12-month daily average. And
But a closer look at regional data shows that these promotions land differently across the country. In the Midwest, Black Friday outperformed Super Saturday last year, fueling the nation’s biggest post-Thanksgiving retail visit spike – a testament to the milestone’s strong local appeal. Meanwhile, in the Western U.S. Black Friday trailed well behind Super Saturday, though both milestones drove smaller upticks than in other regions. And in New England and the South Central states, Super Saturday achieved its biggest impact, suggesting that last-minute holiday specials may resonate especially well in that area.
Plenty of Local Variety
Digging deeper into major Midwestern hubs shows that even within a single region, holiday promotions can produce widely different responses.
In St. Louis, Indianapolis, and Minneapolis, for example, consumers followed the broader Midwestern pattern, flocking to stores on Black Friday exhibiting less enthusiasm for Super Saturday deals. By contrast, Chicago and Detroit saw Super Saturday edge ahead, with Chicago’s Black Friday peak falling below the nationwide average of 50.1%. examples highlight the power of local preferences to shape holiday campaign results.
Differing Demographic Shifts Across Regions
Holiday promotions don’t just drive visit spikes; they also spark subtle but significant changes in the demographic profiles of brick-and-mortar shoppers, expanding many retailers’ audiences during peak periods. And these shifts, too, can vary widely across regions.
Outlet malls, department stores, and beauty & self-care chains, for instance, which typically attract higher-income consumers, tend to see slight declines in the median household incomes (HHI) of their visitor bases in December. This dip may be due to promotions drawing in more mid- and lower-income shoppers during the peak holiday season. Electronics stores and superstores, on the other hand, which generally serve a less affluent base, see modest upticks in median HHI in the lead-up to Christmas.
But once again, drilling further down into regional chain-level data reveals more nuanced regional patterns. Take Best Buy, a leading holiday season electronics destination. In some of the chain’s biggest, more affluent markets – including New York, Los Angeles, and Chicago – the big-box retailer sees small dips in median HHI during December. But in Atlanta and Houston – also relatively affluent, but slightly less so – December saw a minor HHI uptick, hinting at a stronger holiday rush from higher-income shoppers in those cities.
Back-to-School Bonanzas
Back-to-school promotions also play a pivotal role in the retail calendar, with superstores, apparel chains, office supply stores and others all vying for shopper attention. And though summer markdowns drive increased foot traffic nationwide, both the timing of these shifts and the composition of the back-to-school shopping crowd differ among regions.
A Southern Head Start
Analyzing weekly fluctuations in regional foot traffic to clothing and office supplies stores shows, for example, that back-to-school shopping picks up earliest in the South Central region, likely due to earlier school start dates.
But the biggest visit peaks occur in the Northeast – with clothing retailer foot traffic surging in New England in late August, and office supplies stores seeing an even bigger surge in the Middle Atlantic region in early September. Retailers and advertisers can plan their back-to-school deals around these differences, targeting promotions to local trends.
A New England Collegian Affair
Though K-12 families drive much of the back-to-school rush, college student shoppers also play a substantial role. And here, too, their participation varies by region.
For instance, the “Collegians” segment accounted for 2.2% of Target’s shopper base nationwide over the past year – rising to 3.0% in August 2024. But regionally, the share of “Collegians” soared as high as 4.0% in New England versus just 2.2% in the West. So while retailers in New England may choose to lean into the college vibe, those in Western states may place greater emphasis on families with children.
Mother’s Day and Father’s Day: Differing Dining Peaks
When it comes to dining, Mother’s Day and Father’s Day are the busiest days of the year for the full-service restaurant (FSR) category, as families treat their parents to a hassle-free meal out. And eateries nationwide capitalize on this trend by offering a variety of deals and promotions that add a little extra charm (and value) to the experience.
Atlantic Specials
Nationwide, Mother’s Day drives more FSR foot traffic than Father’s Day – except in parts of the Pacific Northwest, where Father’s Day traditions run especially deep. Still, the size of these holiday boosts varies substantially by region.
This year, for instance, Mother’s Day (May 11, 2025) drove the largest FSR surge in the Middle Atlantic, with the South Atlantic and Midwest not far behind. Father’s Day, by contrast, saw its biggest lift in the South Atlantic. Mother’s Day proved least resonant in the West, whereas Father’s Day had its smallest impact in New England.
Going the Extra Mile for Mom
Dining behavior also differs between the two occasions. Mother’s Day celebrants display a slight preference for morning FSR visits and a bigger one for afternoon visits, while Father’s Day crowds favor evenings – perhaps reflecting a preference for sports bars and later dinners with dad. Another interesting nuance: On Mother’s Day, a larger share of FSR visits originate from between 3 and 50 miles away compared to Father’s Day, suggesting that families go the extra mile – sometimes literally – to celebrate mom.
Self-Styled Celebrations: Driving Traffic with DIY Milestones
While established dates like Black Friday or Mother’s Day naturally spur promotions, brands can also craft their own moments with limited-time offers (LTOs). And much like holiday campaigns, these retailer-led events can produce varied outcomes across different regions.
Fast food restaurants, for example, have leaned heavily on limited-time offers (LTOs) and pop-culture tie-ins to fuel buzz in what remains a challenging overall market. And McDonald’s recent Minecraft promotion, launched on April 1, 2025 to coincide with the April 3 release of A Minecraft Move, shows just how impactful the practice can be.
Nationally, the Minecraft promotion (featuring offerings for both kids and adults) drove a 6.9% lift in visits during the movie’s opening week. But the impact of the promotion was far from uniform across the U.S. Many of McDonald’s Western markets – including Utah, Idaho, Nevada, California, Texas, Arizona, Colorado, and Oregon – recorded visit lifts above 10.0%. Meanwhile, Kentucky saw a 2.1% dip, and several other Eastern states registered modest gains below 3.0%. The McDonald’s example illustrates the power of regional tastes to shape the success of even the most creative pop-culture collabs.
Adopting a Regional Lens
Whether it’s properly timing holiday and back-to-school discounts, recognizing where Mother’s Day or Father’s Day will resonate more, or pinpointing markets that respond best to pop-culture tie-ins, the data reveals that effective promotions depend heavily on local nuances. And by analyzing regional and DMA-level trends, retailers and advertisers can craft compelling, relevant campaigns that heighten engagement where it matters most.
Discover how mall anchors are transforming in 2025 – and how a foot-traffic-focused approach to choosing key tenants can drive visits and shopper engagement.
May 29, 2025
8 minutes
Key Takeaways
1. Experiential and niche retailers can deliver anchor-level traffic. At Towne East Square Mall, the addition of a Scheels in 2023 significantly increased foot traffic and long-distance travelers, while Barnes & Noble at Coronado Center in Albuquerque has become a key driver of both foot traffic and higher-spend demographics.
2. Size isn’t everything – especially for dining venues. At Glendale Galleria and Northridge Fashion Center, smaller restaurants attracted more foot traffic than some traditional anchors.
3. Refocusing on tenants’ actual traffic contributions enables a flexible anchor approach. Balancing weekend draws like Scheels with weekday favorites such as Costco or Chick-fil-A can help maintain steady visitor flow throughout the week. Similarly, onsite fitness clubs can shift traffic to earlier in the day – an opportunity to adjust store hours and capture additional morning shoppers.
4. Temporary pop-ups can form an integral part of a visit-focused anchor strategy. The Barbie Dreamhouse Living Truck Tour generates mall visit spikes well above typical Saturday levels. Operators can integrate these events into their overall anchor strategies, offering preferential terms to high-performing pop-ups.
5. New tenants can boost traffic for existing stores in similar categories. After Aldi joined Green Acres Commons in February 2020, visits to an existing BJ’s Wholesale Club trended upwards. This synergy highlights how overlapping audiences can become a strength, creating a larger overall customer base.
The Retail Comeback Kid
Malls, it seems, are cool once again. After languishing in the wake of the pandemic, shopping centers across the country are thriving – reinventing themselves as prime “third places” where people can hang out, shop, and grab a bite to eat.
One key driver behind this resurgence is a shift in how malls view their anchor tenants. While traditional mainstays like Macy’s and JCPenney still play an important role, specialized offerings – from popular eateries to fitness centers and immersive retailtainment destinations – are increasingly taking center stage. These attractions maximize the experiential value that brick-and-mortar venues can deliver, driving visits and sales for the center as a whole.
Against this backdrop, this report leverages the latest location intelligence data to explore the types of tenants that can function as mall anchors in 2025. Should mall operators still focus on general merchandisers to draw crowds, or can dining chains and more niche retailers also do the job? How important is square footage in identifying the anchor-like tenants in a shopping center? And how can a visit-focused approach help mall operators select effective anchor or anchor-like tenants – whether to fill big-box spaces or to leverage the leasing perks traditionally reserved for major large-format chains?
Out-of-the-(Big)-Box Visit Drivers
One of the most important functions of a mall anchor is to ensure steady visitation – providing its smaller tenants with a constant flow of potential customers. And as the role of the mall continues to evolve, analyzing the actual foot traffic impacts of different types of businesses can help identify the kinds of non-traditional anchors best suited to fulfill that purpose.
The Power of a Well-Placed Scheels
Experiential venues, for example, are particularly well-poised to serve as powerful anchors in today’s retail environment – as illustrated by the visit surge experienced by Towne East Square Mall in Wichita, KS following the addition of a Scheels in July 2023.
By blending traditional retail with immersive experiences, Scheels has emerged as a true experiential destination. And this pull has also helped the mall draw more long-distance visitors willing to travel to enjoy Scheels’ offerings. In 2024, 41.9% of the mall’s customers traveled more than 50 miles to visit, compared to 35.8% back in 2018 when Sears occupied the same lot.
Scheels Anchor Brings Substantial Visit Boost to Towne East Square Mall in Wichita, KS, Attracting Visitors From Further Away
Visits to Towne East Square Mall Compared to Q1 2018 Baseline
Share of Visitors From 50+ Miles Away
Share
Embed:
The Barnes & Noble Effect
Traditionally, anchors aimed to please the widest possible audiences – with department stores, big-box chains, and grocery stores leading the way. But visitation data shows that niche concepts can also deliver anchor-level traffic if they’re compelling enough to attract dedicated fans.
The experience of the Barnes & Noble at Coronado Center in Albuquerque, NM is a case in point. After being written off as all but obsolete, Barnes & Noble has staged an impressive comeback in recent years, finding success through a more curated, localized approach to book selling. And despite not being a formal anchor, the Coronado Center Barnes & Noble accounted for 7.9% of visits to the mall in 2024 – outperforming both Macy’s and JCPenney.
Year-over-year data also shows foot traffic surging at the Coronado Center Barnes & Noble, lifting overall visitation to the mall. And demographic data reveals that the bookstore draws a more affluent audience than either the center as a whole or the two department stores – attracting a crowd with more spending power.
This example also illustrates how smaller tenants can sometimes draw larger crowds. Even though Barnes & Noble occupies a smaller onsite space than either Macy’s or JCPenney, it is proving a powerful visit driver out of proportion to its physical size.
Dining Chains Punching Above Their Size
Dining chains are also adept at punching above their square footage – often attracting crowds disproportionate to their size.
Despite its relatively small footprint, for example, the In-N-Out Burger at Glendale Galleria drew an impressive 8.6% of visits to the mall complex in 2024, outpacing some of the mall’s official anchors like DICK’s Sporting Goods, Macy’s, and JCPenney. Still, the onsite Target drew even larger crowds at 14.4% of visits.
A similar pattern emerged at Northridge Fashion Center, where Porto’s Bakery and Cafe captured a notable 15.6% of visits to the complex in 2024 – more than some of the center’s traditional department stores.
These examples underscore the potential for dining chains, which typically require less space, to serve as micro-anchors by consistently attracting outsized crowds – a key consideration for mall operators looking to sustain visitor traffic.
Choosing a Mall Anchor in 2025
Refocusing on tenants’ actual foot traffic contributions also opens the door to a more flexible and dynamic approach to anchor selection and management – one that considers each venue’s unique visitation patterns.
The Weekend/Weekday Divide
Seasonal factors, for example, can make certain anchors more powerful at specific times of the year, while different venues shine on particular days of the week.
At Jordan Creek Town Center in West Des Moines, Iowa, for instance, Scheels and Costco each delivered just under 20.0% of the complex’s overall visits in 2024. But the two retailers’ daily patterns differed significantly: Scheels saw bigger crowds on weekends, while Costco was the primary weekday destination.
Understanding differences like these can help operators optimize their tenant mix to maintain a balanced flow of shoppers throughout the week.
Another example of the impact of differing weekday traffic patterns is offered by the impact of mall-based Chick-fil-A locations on the distribution of mall visits throughout the week.
Despite its relatively small size, Chick-fil-A draws substantial traffic to malls. And after adding Chick-fil-A locations, both Northridge and Miller Hill Malls saw meaningful drops in the share of visits to the centers taking place on Sundays – even as the wider indoor mall segment saw slight upticks.
Recognizing this trend could prompt mall operators to compensate by adding more weekend-friendly traffic drivers – or to lean into this distinction by taking additional steps to bolster the mall’s role as a go-to weekday destination.
The Early-Morning Fitness Advantage
The power of different mall traffic magnets also varies throughout the day. Increasingly, shopping centers are turning to fitness centers as experiential anchors. And since many people work out early in the morning, these gyms are having a significant impact on the distribution of mall visits across dayparts.
The addition of gyms to Northshore Mall in Peabody, MA and Jackson Crossing in Jackson, MI, for instance, led to a significant rise in visits between 7:00 AM and noon. And though the rest of the stores in these malls typically open at 10:00 or 11:00 AM, this shift presents the centers with a significant opportunity.
By adjusting opening hours to accommodate these early-morning patrons, malls can capitalize on this added traffic, driving up visits and sales for relevant tenants – especially health-focused retailers such as juice bars and sporting goods stores.
Adding Temporary Pop-Ups Into the Mix
Adopting a broader, visit-focused view of anchoring also allows mall operators to apply some of the strategies typically reserved for anchors to non-conventional traffic-generating businesses, to ensure a consistent flow of traffic year-round.
Pop-up stores and events, for example, generally don’t follow the same seasonal trends as other retailers – instead, they generate short-term visit boosts during their runs, whenever in the year that may be. And a visit-focused anchor strategy can leverage some of the perks traditionally reserved for anchor tenants – such as preferential leasing terms – to complement traditional full-time anchors during slower retail periods.
The Barbie Dreamhouse Living Truck Tour is a prime example of a traffic-driving pop-up. By bringing exclusive merchandise to malls across the U.S., the truck generates plenty of buzz, drawing crowds eager to snatch up limited-edition items and immerse themselves in all things Barbie. As a result, malls hosting the tour often see significant visit spikes, with foot traffic surging well above typical Saturday levels. Well-timed pop-ups like these can help balance out traffic throughout the year, offsetting traditional slow periods.
Creating a Bigger Visit Pie
A visit-focused approach to anchor management can also help mall operators assess the potential impact of new tenants on existing stores operating in similar categories. For example, mall owners often worry that new tenants operating in similar categories might cannibalize existing businesses. But a visit-focused anchor approach reveals that a well-chosen addition can sometimes benefit current tenants – especially if they cater to similar audiences.
In February 2020, for instance, value supermarket Aldi opened at Green Acres Commons in Valley Stream, NY – a center that already hosted budget-friendly BJ’s Wholesale Club. While BJ’s visits were relatively flat in 2018 and 2019, they began to rise after Aldi’s opening (and following a pandemic-induced dip). Cross-shopping data also shows that Aldi customers were more likely to visit BJ’s than the average Green Acres patron last year.
This synergy may be due in part to the two retailers’ similar visitor bases: In 2024, the Aldi and BJ’s stores in Green Acres Common drew shoppers with comparable economic profiles. This suggests that overlapping audiences can become a strength if aligned brands attract new shoppers, who then explore multiple stores in the same center.
Visits to BJ's Wholesale Club Took Off After Addition of Aldi to Green Acres Commons – Perhaps Buoyed by Audience Similarity
Visits to Green Acres Commons BJ's Wholesale Club, Compared to Q1 2018 Baseline
Median HHI, 2024*
Cross-Shopping, 2024
*Median HHI based on STI: PopStats dataset combined with Placer.ai data for captured trade areas.
Looking ahead, effective mall anchors will be defined less by physical footprint and more by their capacity to maintain consistent, valuable foot traffic. While traditional department stores remain pivotal, smaller or niche brands can often rival – or surpass – large-format retailers. And by thinking out of the anchor box and choosing tenants that cultivate a balanced visitor flow and align with local preferences, operators can position their centers as true go-to destinations.


.svg)


.avif)


