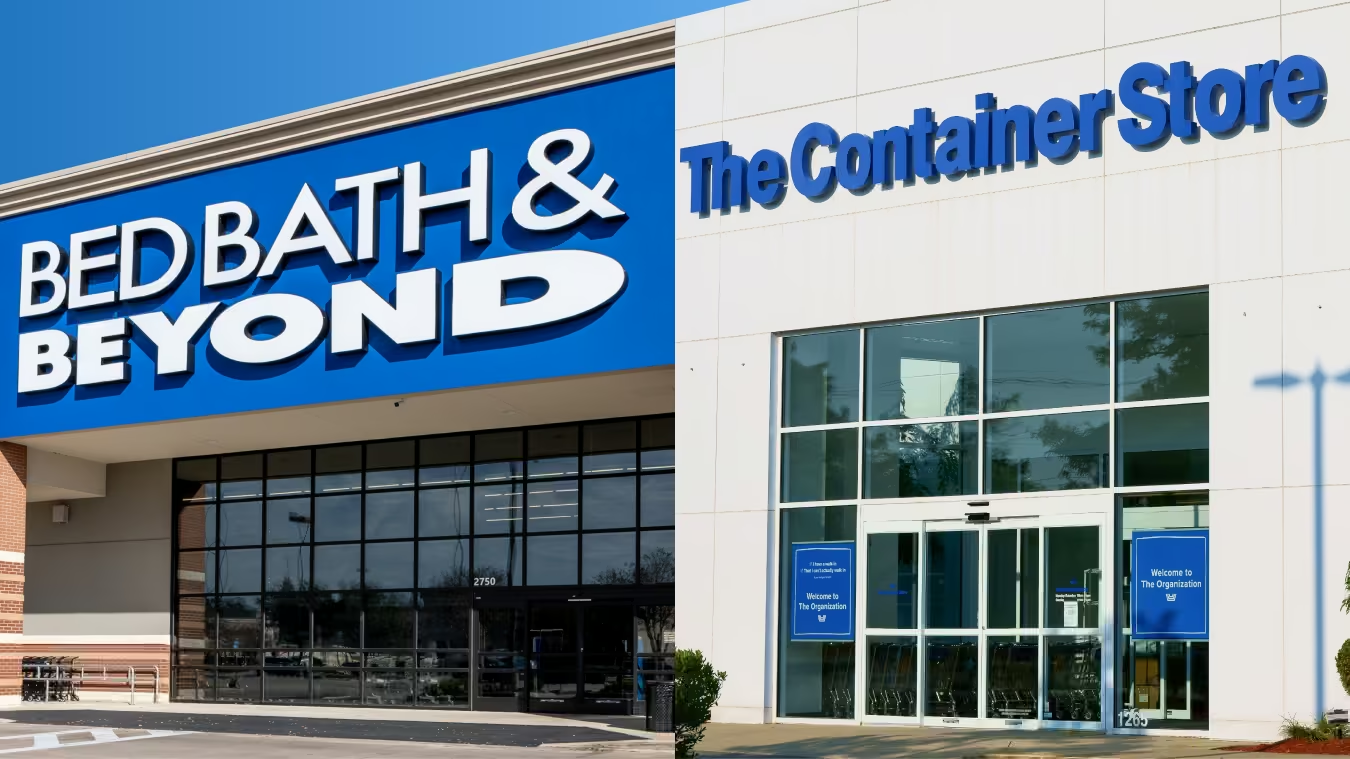
Bed Bath & Beyond is returning to stores through Kirkland's and The Container Store. Here's what foot traffic data reveals about its comeback strategy.
Shira Petrack
Jul 6, 2026
5 minutes
A Different Bed Bath & Beyond Returns
Bed Bath & Beyond returned to physical retail in August 2025, when the first store to carry the name since the chain's 2023 liquidation opened in Brentwood, Tennessee. The format signaled how much the strategy had changed. At roughly 15,000 square feet, in a former Kirkland's, the location is a fraction of the 25,000-to-50,000-square-foot stores the brand operated before bankruptcy, reflecting a deliberate move toward smaller, neighborhood-format stores.
The format shift is just one element of a broader restructuring. The name now belongs to Beyond Inc. – since renamed Bed Bath & Beyond Inc. – which is reviving the legacy brand through two distinct acquisitions. The company is acquiring Kirkland's, the home-decor chain, and converting select stores into small-format Bed Bath & Beyond Home locations, and has also agreed to acquire The Container Store and co-brand its stores as "The Container Store / Bed Bath & Beyond."
But in a category that increasingly rewards discounters and sharply differentiated retailers, is there still room for a brand like Bed Bath & Beyond, and in what form?
Before Bankruptcy, Bed Bath & Beyond Led the Offline Home Furnishing Space – But the Category Has Changed
It is easy to forget how dominant Bed Bath & Beyond once was. In 2019, already past its heyday, it still captured the single largest share of visits to home furnishing retailers in the country, acting as the broad, generalist default for the category.
A lot has changed since. Visits to brick-and-mortar home furnishing retailers fell roughly 27% from 2019 to 2025, and within that smaller pie the leaderboard reshuffled around Bed Bath & Beyond's absence. HomeGoods now sits at the front, reflecting where the category's momentum has gone – toward off-price and sharply differentiated retailers. At the same time, no single full-price, national retailer moved into the position Bed Bath & Beyond vacated, the broad home brand that shoppers across very different incomes and life stages defaulted to.
That open role is the opening a revived Bed Bath & Beyond is built around. The brand is betting that what failed was the format – a massive store carrying an exhaustive, full-price assortment behind a coupon, which is a format that off-price now beats on price and that specialists beat on focus. But the recognition itself, a name a wide range of shoppers still associate with outfitting a home, has remained strong, and the comeback may work if it claims the role without rebuilding the format. That is what the unusual structure is designed to do.
Bed Bath & Beyond, Former Home Furnishing Leader, Returns to a Changed Market
Share of Total Home Furnishing Visits by Chain — the 20 Largest Plus All Others — 2019 vs. 2025
2019
2025
Bed Bath & BeyondHomeGoodsIKEAAt HomeWorld MarketAshleyKirkland'sChristmas Tree ShopsThe Container StoreRooms To Go Furniture StoreBob's Discount FurniturePottery BarnCrate and BarrelOld Time PotteryConn's HomePlusLa-Z-BoyValue City FurnitureRaymour & Flanigan Furniture StoreHomesenseLiving SpacesRH (Restoration Hardware)Norwalk FurnitureFurniture RowOther
Circle area is proportional to each year's total visits, which fell about 27% from 2019 to 2025. Slices show each chain's share of all home furnishing visits; the 20 largest chains are shown individually and the remainder is grouped as "Other." Bed Bath & Beyond liquidated all its stores in 2023 (its small 2025 relaunch was too recent to register here); Christmas Tree Shops (2023) and Conn's HomePlus (2024) closed all locations and have not returned. Source: Placer.ai.
Share of total U.S. home furnishing visits by chain, 2019 vs. 2025.
Retailer
2019 visit share
2025 visit share
Bed Bath & Beyond
23.7%
0.0%
HomeGoods
19.3%
38.3%
IKEA
11.5%
11.2%
At Home
7.5%
10.5%
World Market
5.3%
7.2%
Ashley
4.4%
5.1%
Kirkland's
4.0%
3.0%
Christmas Tree Shops
3.7%
0.0%
The Container Store
1.8%
1.6%
Rooms To Go Furniture Store
1.7%
1.8%
Bob's Discount Furniture
1.4%
2.7%
Pottery Barn
1.1%
1.2%
Crate and Barrel
1.0%
1.4%
Old Time Pottery
1.0%
0.6%
Conn's HomePlus
1.0%
0.0%
La-Z-Boy
0.9%
1.0%
Value City Furniture
0.8%
0.9%
Raymour & Flanigan Furniture Store
0.7%
0.9%
Homesense
0.7%
2.9%
Living Spaces
0.7%
1.1%
RH (Restoration Hardware)
0.0%
0.8%
Norwalk Furniture
0.0%
0.6%
Furniture Row
0.0%
0.5%
Other
7.8%
6.8%
An Unconventional Path to an Offline Comeback
Rather than reopen its own stores, Bed Bath & Beyond is returning through two retailers it is absorbing, both of which have been losing visits year over year. The declines are not one shared problem but two different ones, and the logic of the comeback is that the Bed Bath & Beyond name addresses each.
The Container Store's difficulty is frequency, with a business organized around storage and home organization – a category shoppers turn to only in occasional project bursts, and affluent customers likely have few reasons to come back between closet overhauls and moves. Co-branding the stores as Bed Bath & Beyond is meant to widen that reason to visit, folding in the everyday kitchen, bath, and bedding categories the name is known for, and lifting trip frequency without pushing away the premium shopper the chain already has.
Meanwhile, Kirkland's is a broad home-and-decor generalist without a sharp identity, sitting in the same exposed middle that off-price and specialists have been pulling apart – its stores draw a mainstream suburban shopper but offer little specific reason to choose them. Converting them to Bed Bath & Beyond Home is meant to supply that reason, a more recognized name with broader pull than the Kirkland's banner generated on its own.
More Than a Sum of Their Parts
Beyond improving the assortment, Bed Bath & Beyond can also boost traffic to converted Kirkland stores and co-branded The Container Stores by bringing in an audience that each chain lacks.
The Container Store draws a narrow, premium audience organized around storage and home organization, while Kirkland's draws a broader, more middle-income suburban shopper for general home goods and decor. Analysing each chain's trade area composition as well as Bed Bath & Beyond's 2019 audience suggests that Bed Bath & Beyond can help each one reach the half of the market it currently misses: In its last pre-COVID year, Bed Bath & Beyond over-indexed both among the premium households The Container Store already draws and among the mainstream suburban families that have long anchored Kirkland's.
And for Bed Bath & Beyond, the arrangement supplies two store networks aimed at different shoppers, one more affluent, one more mainstream, reached through a single name both still recognize.
From Recognition to Retention
At the same time, the challenges should not be understated. A recognized name is the beginning of a value proposition rather than a substitute for one, and the proposition the brand carried into bankruptcy, an exhaustive assortment paired with a coupon, is the one that ultimately failed.
But two years after the chain closed, many consumers still think of Bed Bath & Beyond as a destination for home essentials, the kind of store associated with furnishing a first apartment, outfitting a dorm, or building a wedding registry. And familiarity has proven effective at generating first visits, as a range of revived retailers from Abercrombie to Polaroid suggests, but converting those visits into a habit is a separate question. Whether shoppers return will depend less on the name above the door than on what the reformatted stores actually offer.
When Red Lobster filed for bankruptcy in May 2024, much of the blame landed on a single menu item: a $20 Ultimate Endless Shrimp deal that proved far too popular for its own margins. The chain shuttered roughly 130 locations, was acquired by Fortress Investment Group, and brought in a new CEO to steady the brand.
So the decision to bring Endless Shrimp back in spring 2026 – this time as a limited-run promotion – wasn't an obvious one. We dove into the data to see how the relaunch is landing, and what it would take for Red Lobster's comeback to hold.
A Strong Traffic Rebound
In the weeks before the Endless Shrimp relaunch, the average number of visits to each Red Lobster location was running below year-ago levels – down by as much as 8.7% year over year (YoY) the week of April 13, and lagging the broader full-service restaurant segment.
Then came April 20. During the first full week of the Ultimate Endless Shrimp promotion, Red Lobster's per-location visits flipped sharply positive and have stayed there since, peaking at 24.3% YoY the week of April 27 and holding double-digit gains into early June – though the magnitude of the boost has gently eased over time. Notably, this outperformance came while full-service restaurant traffic remained roughly flat YoY.
Red Lobster’s Per-Location Visits Surge on Endless Shrimp — Even as It Closes Stores
YoY Change in Weekly Average Visits per Location, Red Lobster vs. Full-Service Restaurants, March–June 2026
Red LobsterFull-Service Restaurants
Share
Embed:
Beyond The Promotion
The traffic surge suggests that Red Lobster's brand equity remains strong. Even after bankruptcy, store closures, and years of operational challenges, the chain was able to generate a meaningful visitation lift by bringing back one of its most recognizable promotions.
But Endless Shrimp can only do so much – and the pressures facing the chain, from elevated seafood costs to a burdensome lease portfolio, will remain even after the promotion inevitably ends. As the company continues to rightsize and improve profitability, the key question is whether its investments in menu innovation and customer experience will be enough to garner lasting customer loyalty. Will Endless Shrimp have a better ending this time around?
cubeiQ's Zora Sentat on first-party data, retail media's untapped potential, and why human expertise still matters in an automated world.
Rebecca Bleier
Jul 1, 2026
2 minutes
Anchored Ep 7: The Data-Driven Customer Era
Zora Sentat has spent her career at the intersection of data, marketing, and commerce. As Chief Commercial Officer at cubeiQ, she's seen how businesses are – and aren't – making the most of what they know about their customers.
In the latest episode of Anchored, Zora joined Ethan Chernofsky to discuss the state of the data landscape, where retail media is falling short, and why human expertise still matters in an increasingly automated world.
Here are 5 key takeaways from the conversation:
First-party data is the foundation of the next competitive advantage. Businesses are starting to recognize that customer interactions generate proprietary behavioral data sets no third party can replicate. The next frontier is leveraging that data as a foundation for new revenue channels – including advertising strategies built around both endemic and non-endemic partners.
Customer centricity breaks down when information stays siloed. The biggest barrier to acting on customer data is asymmetry. When insights sit only with the marketing team, the rest of the business can't act on them. Democratizing that information across departments is what separates companies that talk about customer centricity from those that actually execute it.
Data quality is the real bottleneck for AI. AI can perform every core function across any application, but its outputs are only as good as the data feeding it. As AI adoption accelerates, the role of the data supplier becomes more critical – well-compiled, deterministic, and explainable data sets are what determine whether AI outputs are actually useful.
Retail media’s growth opportunity is still up for grabs. The category has been discussed long enough that expectations have outpaced execution. The untapped opportunity lies with non-endemic advertisers – brands with no products on the shelf but strong reasons to reach a retailer's audience. Until networks expand beyond their own supplier base, a significant portion of available budgets will continue to go elsewhere.
Human expertise remains a genuine differentiator as agentic platforms proliferate. The push toward self-serve and automated campaign management has created an opening for service-led businesses to stand out. Clients in complex, nuanced industries still want someone who truly understands their business – and that depth of institutional knowledge is difficult to replicate with automation alone.
Memorial Day weekend is the unofficial start of summer – and this year it arrived amid mounting cost pressures. Gas prices were at their highest Memorial Day level since 2022, while domestic airfare had risen more than 20% year over year – although travelers who booked early were often able to secure better deals.
That makes the holiday weekend a useful bellwether for the summer season ahead. Which corners of the travel economy are thriving, and where are consumers pulling back as budgets tighten? We dove into the data to find out.
Fewer Stops at the Pump
Visits to gas stations and convenience stores - a reasonable proxy for how much Americans are driving – fell 7.0% YoY over the four-day Memorial Day weekend, measured from Friday through Monday. The decline pushed visits below their 2021 level for the first time since the pandemic-era baseline.
The drop is even more striking when viewed against the holiday's typical pattern. Over the past four years, Memorial Day weekend has consistently generated roughly 2% to 3% more traffic than a typical weekend, measured against the average of the preceding six Friday-to-Monday periods. This year, that premium disappeared. Instead, visits ran 3.1% below the recent norm, marking the first time in at least four years that the unofficial start of summer drew fewer fuel-and-snack stops than an ordinary weekend.
This suggests that forecasts of record-setting Memorial Day travel may have overstated the strength of road-trip demand as fuel costs surged. But another possible explanation is that Americans still traveled, just not as far – an interpretation supported by the decline in travel distances across most hotel tiers (see below). Surging fuel costs may also have nudged some travelers who had planned to drive toward air travel instead.
Americans Eased Off the Gas on Memorial Day Weekend
Nationwide Gas Station Visits, Memorial Day Weekend 2026 (Fri–Mon)
Year over Yearvs. 2025▼7.0%
vs. 2021 BaselineFirst year in series▼5.1%
vs. Previous WeekendsAvg. of prior six Fri–Mon▼3.1%
🚗
Memorial Day weekend failed to lift gas-station traffic, with visits falling below even 2021’s pandemic-era levels.
Memorial Day Weekend Indexed to 2021
Memorial Day Weekend vs. Avg of Prior Six Friday-Mondays
Share
Embed:
Air Travel Holds Steadier
And indeed, airport visits by domestic travelers in the lead up to the holiday were comparatively resilient, slipping just 0.5% YoY on the Thursday and Friday before Memorial Day.
Compared to airports' prior six-week baseline, demand heading into the holiday weekend actually increased. Airport visits during the Thursday-Friday travel rush ran 9.7% above the average of the previous six weeks, up from 8.2% in 2025 and 7.1% in 2024. That resilience was likely driven, at least in part, by travelers who secured lower fares by booking well in advance. And because air travelers tend to skew more affluent than road trippers, those who did book later may have been more willing to absorb higher travel costs despite the sticker shock.
Airport Traffic Held Flat YoY, but Pre-Holiday Surge vs. Prior Weeks Kept Growing
Major Airport Visits During Lead-Up to Memorial Day Weekend (Thu–Fri)
Year-over-Year Change
2024▲10.0%
2025▼0.8%
2026▼0.5%
Lift vs. Prior Six Thursday–Fridays
✈
Although airport traffic remained flat YoY, the pre-holiday surge was more pronounced against a backdrop of softer recent demand, with visits running 9.7% above the prior six Thursday–Friday average.
Share
Embed:
A K-Shaped Check-In
Hotels, meanwhile, saw declines in domestic traveler visitation across all tiers as some travelers likely looked for ways to reduce lodging costs, whether by staying with friends and family, choosing lower-cost accommodations, or taking shorter trips.
But the pullback was far from uniform. Economy hotels took the hardest hit, with visits down 7.2% YoY – the steepest decline of any segment. Midscale, upper-midscale, and upscale properties landed in the middle, posting declines between 4.3% and 5.0%. At the top end of the market, the softness was more limited: Upper-upscale hotels slipped just 2.2%, while luxury hotels declined 2.7%.
The same K-shaped pattern showed up in how far guests were willing to travel. The share of hotel visitors coming from more than 100 miles away declined across nearly every tier – most sharply at the lower end of the market. Only luxury hotels saw their share of long-distance guests actually increase by 1.2 percentage points – showing that affluent domestic travelers were still traveling the distance.
Luxury and Upper Upscale Hotels Proved Most Resilient Amid Industry-Wide Traffic Declines
Memorial Day Weekend (Fri–Mon): May 22–25 ’26 vs. May 23–26 ’25, U.S.
Hotel Visits, Year-over-Year Change
Economy▼7.2%
Midscale▼5.0%
Upper Midscale▼4.4%
Upscale▼4.3%
Upper Upscale▼2.2%
Luxury▼2.7%
Visits slipped across every hotel class, but the high end held up best – and luxury was the only segment to draw a larger share of guests from 100+ miles away.
Percentage Point Change* in Share of Visitors From 100+ Miles Away, 2026 vs. 2025
*A percentage-point change is the difference between the two years’ shares – e.g., Luxury rising from 51.3% to 52.5% is a 1.2-point gain.
Share
Embed:
A K-Shaped Summer Ahead?
The unofficial start of summer revealed a widening split in how Americans allocate their travel spending. Driving-related stops and budget hotels bore the brunt of the pullback, while air travel and higher-end lodging continued to hold steady.
Whether this divide narrows or widens will depend largely on the path of gas prices and consumer confidence. As fuel costs ease, will budget-conscious travelers return to the road in greater numbers? Will air travel rebound, and will hotel visitation follow?
For more data-driven consumer and travel insights, visit Placer.ai/anchor.
In recent years, Best Buy has faced significant challenges – from intensifying e-commerce competition to a slower housing market weighing on major categories like appliances.
But the retailer hasn't been resting on its laurels, rolling out a range of initiatives aimed at unlocking value from its physical and digital assets, including an expanded online Marketplace to enhanced retail media offerings and a strategic partnership with IKEA.
So how are these efforts playing out on the ground? We dove into the data to explore the rationale behind these initiatives and see what foot traffic data can tell us about their impact and future potential.
IKEA Shop-in-Shop Drives Visits
One of the more visible ways Best Buy is making new use of its physical footprint is through its shop-in-shop partnership with IKEA, which launched in fall 2025 across 10 stores in Florida and Texas.
The concept, designed to give customers an integrated way to upgrade their homes, pairs IKEA furnishings with Best Buy's kitchen and laundry offerings. By helping shoppers visualize complete home projects, the shop-in-shop creates natural cross-selling opportunities across complementary categories while providing an additional reason to visit segments that have faced persistent headwinds.
And foot traffic data suggests that the bet may be paying off. Through the first four months of 2026, Best Buy stores with IKEA shop-in-shops outperformed the national Best Buy fleet – as well as the chain's Texas and Florida benchmarks – every single month. And with Best Buy now opening consultation spaces inside IKEA stores in Frisco, Texas, and Tampa, Florida, the partnership between the two brands appears poised to deepen further.
Turning Pickup Runs Into Premium Ad Inventory
Best Buy is also unlocking additional value from its store fleet through an expanded physical retail media network. Beyond traditional in-store advertising placements, the company monetizes its growing volume of pickup visits through Curbside Cinema displays, giving brands access to shoppers during a brief but highly attentive moment when there are few competing distractions for their attention.
And the visit data shows just how significant that opportunity is. In Q1 2026, more than 20% of Best Buy visits lasted under ten minutes – well above the 14.2% logged across discretionary chains. By serving short, brand-safe content during those windows, Best Buy is turning idle waiting time into measurable ad impressions, monetizing a moment most retailers let slip by unused.
Reaching Sports Fans In-Store
Best Buy is also experimenting with increasingly sophisticated in-store advertising activations. The retailer recently partnered with a sports streaming platform on an immersive store takeover, using exterior signage, digital displays, and branded experiences to engage shoppers at multiple touchpoints. The campaign built on a broader recognition that Best Buy's customer base skews heavily toward sports enthusiasts - with the retailer reporting that its shoppers are 26% more likely than average to be sports fans. And this affinity has helped drive partnerships with organizations such as the NFL while creating new opportunities for Best Buy Ads.
Placer data from four of Best Buy's most-visited locations in Q1 2026 shows that while sports fandom is a consistent thread across markets, the specific interests vary considerably. Brooklyn's Bay Parkway location, for example, draws especially high concentrations of NHL and baseball fans, while Holyoke, Massachusetts skews more heavily toward NFL enthusiasts. Each market has its own distinct mix. And in a retail media landscape where targeting precision is the primary selling point, these market-level differences are another opportunity Best Buy is well positioned to capture.
More Than a Place to Shop
As Best Buy seeks to become more than just a retailer, its stores are increasingly serving multiple functions at once – driving merchandise sales, supporting advertising initiatives, and helping brands connect with consumers. Given the early signs of traction behind these strategies, it may come as little surprise that incoming CEO Jason Bonfig plans to build on them as he pushes Best Buy further toward becoming "a retailer, media, advertising, and technology company."
The U.S. matches of the FIFA World Cup kicked off at Los Angeles Stadium (aka SoFi Stadium) in Inglewood, CA, on June 12, 2026 with the highly-anticipated USA vs. Paraguay matchup and a star-studded opening ceremony.
Across the Los Angeles area, watch parties and fan activations drew supporters eager to take part in the matchday atmosphere. Among them was the City of Inglewood's “The Wood Cup”, a street festival just a short walk from the stadium itself, which Inglewood Mayor James Butts called “a free alternative to attending the very expensive World Cup soccer match in person”.
With just a few city blocks separating the two events, we examined how their audiences of U.S-based fans differed and how this multi-layered engagement translated into broader economic benefits for the surrounding community.
The Opening Match Drew an Affluent Audience
Audience segmentation reveals that visitors to The World Cup U.S. opener skewed more affluent than visitors to The Wood Cup festival – a finding that aligns with the premium cost of attending a globally significant sporting event. According to Spatial.ai’s PersonaLive dataset, Ultra Wealthy Families represented the largest audience segment at the stadium, accounting for nearly 30% of visitors – a share on par with recent Super Bowls. As the tournament progresses to later-stage matches with even greater demand, this trend could become even more pronounced.
Meanwhile, The Wood Cup street festival attracted a more diverse and less wealthy visitor base. Near-Urban Diverse Families made up the largest share of attendees by a wide margin, while City Hopefuls – lower-income urban households – also accounted for a significant portion of festival visitors.
The Nearby Street Festival Was Dominated by Locals
Diving deeper into visitor travel patterns provides further insight into the stadium versus street festival audiences. Location intelligence shows that many stadium visitors came from throughout Southern California and beyond, while the street festival appears to have functioned as a primarily local gathering. The stadium saw a significantly larger share of visitors traveling more than 10 miles, with more than a third traveling over 250 miles, underscoring the event's broader regional draw and national appeal. On the other hand, nearly 70% of street festival attendees traveled less than 10 miles, highlighting the neighborhood orientation of the event.
This contrast reinforces the role of fan activations alongside major sporting events. While the stadium attracted affluent visitors who traveled significant distances, the street festival engaged a highly local audience unlikely to attend the match itself – playing an important role in broadening participation and capitalizing on World Cup excitement across the host city.
Matchday Festivities Delivered a Major Boost to Nearby Dining
One of the clearest ways that broad participation in a major sporting event benefits host communities is by driving traffic to nearby businesses from travelers and locals alike.
On the day of the 2026 World Cup U.S. opener, several restaurants near Los Angeles Stadium and The Wood Cup festival experienced visit boosts far exceeding typical levels. The Pollo Campero location on W. Century Boulevard experienced the largest foot traffic increase among the restaurants analyzed, with visits spiking 264.0% compared to the average Friday – a surge that may have been aided by the chain's World Cup-themed "Pollito Campeón" campaign. Other nearby establishments also posted significant gains, including Sizzler (+185.9%), Carl's Jr. (+128.9%), and El Pollo Loco (+105.3%).
These foot traffic gains illustrate the ripple effects of major sporting events and adjacent fan activations beyond the stadium and festival grounds.
A Blueprint for Host City Engagement
The World Cup’s opening match in the U.S. transformed Los Angeles into a hub of activity both inside and outside the stadium, creating pathways for fans of all types to participate in the event and driving significant traffic to nearby businesses. With additional fan zones planned across multiple host cities – and demand rising as the stakes increase – The World Cup’s impact could continue to grow.
Dive into the data to see how consumer response to major promotional events – from Black Friday and the back-to-school shopping rush to brand-crafted LTOs – varies by market.
June 19, 2025
Key Takeaways
1. The Midwest is the only region where Black Friday retail visits outpace Super Saturday.
But several major Midwestern markets, including Chicago and Detroit, actually see higher shopper turnout on Super Saturday.
2. Holiday season demographic shifts also vary across regions.
Nationwide, electronics stores see a slight uptick in median household income (HHI) in December – yet in certain markets, electronics retailers such as Best Buy see a drop in captured market median HHI during this period.
3. Back-to-school shopping starts earliest for clothing and office supplies retailers in the South Central region, likely tied to earlier school schedules.
But back-to-school visits surge higher for these retailers in the Northeast later in the season.
4. The share of college students among back-to-school shoppers varies by region.
In August 2024, “Collegians” made up the largest share of Target’s back-to-school shopping crowd in New England, and the smallest in the West.
5. Mother’s Day drives the biggest restaurant visit spikes in the Middle Atlantic Region, while Father’s Day sees its biggest boosts in the South Atlanticstates.
Mother’s Day diners also tend to travel farther to celebrate, suggesting an extra effort to treat mom.
6. Western states proved particularly responsive to McDonald’s recent Minecraft promotion.
During the week of A Minecraft Movie’s release, the promotion drove significantly higher visit spikes in the West than in the Eastern U.S.
Zooming in on Local Trends
Retailers rely on promotional events to fuel sales – from classics like Black Friday and back-to-school sales to unique limited-time offers (LTOs) and pop-culture collaborations. Yet consumer preferences and behavior can vary significantly by region, making it critical to tailor campaigns to local markets.
This report dives into the data to reveal how consumers in 2025 are responding to major retail promotions, exploring both broad regional trends and more localized market-level nuances. Where is Black Friday most popular, and which areas see a bigger turnout on Super Saturday? Where are restaurants most packed on Mother’s Day, and where on Father’s Day? Which region kicks off back-to-school shopping – and where are August shoppers most likely to be college students? And also – which part of the country went all out on McDonald’s recent Minecraft LTO?
Read on to find out.
The Holiday Season: A Regional Story
Promotions aimed at boosting foot traffic on key holiday season milestones like Black Friday and Super Saturday are central to retailers’ strategies across industries. The day after Thanksgiving and the Saturday before Christmas typically rank among in-store retail’s busiest days, last year generating foot traffic surges of 50.1% and 56.3%, respectively, compared to a 12-month daily average. And
But a closer look at regional data shows that these promotions land differently across the country. In the Midwest, Black Friday outperformed Super Saturday last year, fueling the nation’s biggest post-Thanksgiving retail visit spike – a testament to the milestone’s strong local appeal. Meanwhile, in the Western U.S. Black Friday trailed well behind Super Saturday, though both milestones drove smaller upticks than in other regions. And in New England and the South Central states, Super Saturday achieved its biggest impact, suggesting that last-minute holiday specials may resonate especially well in that area.
Plenty of Local Variety
Digging deeper into major Midwestern hubs shows that even within a single region, holiday promotions can produce widely different responses.
In St. Louis, Indianapolis, and Minneapolis, for example, consumers followed the broader Midwestern pattern, flocking to stores on Black Friday exhibiting less enthusiasm for Super Saturday deals. By contrast, Chicago and Detroit saw Super Saturday edge ahead, with Chicago’s Black Friday peak falling below the nationwide average of 50.1%. examples highlight the power of local preferences to shape holiday campaign results.
Differing Demographic Shifts Across Regions
Holiday promotions don’t just drive visit spikes; they also spark subtle but significant changes in the demographic profiles of brick-and-mortar shoppers, expanding many retailers’ audiences during peak periods. And these shifts, too, can vary widely across regions.
Outlet malls, department stores, and beauty & self-care chains, for instance, which typically attract higher-income consumers, tend to see slight declines in the median household incomes (HHI) of their visitor bases in December. This dip may be due to promotions drawing in more mid- and lower-income shoppers during the peak holiday season. Electronics stores and superstores, on the other hand, which generally serve a less affluent base, see modest upticks in median HHI in the lead-up to Christmas.
But once again, drilling further down into regional chain-level data reveals more nuanced regional patterns. Take Best Buy, a leading holiday season electronics destination. In some of the chain’s biggest, more affluent markets – including New York, Los Angeles, and Chicago – the big-box retailer sees small dips in median HHI during December. But in Atlanta and Houston – also relatively affluent, but slightly less so – December saw a minor HHI uptick, hinting at a stronger holiday rush from higher-income shoppers in those cities.
Back-to-School Bonanzas
Back-to-school promotions also play a pivotal role in the retail calendar, with superstores, apparel chains, office supply stores and others all vying for shopper attention. And though summer markdowns drive increased foot traffic nationwide, both the timing of these shifts and the composition of the back-to-school shopping crowd differ among regions.
A Southern Head Start
Analyzing weekly fluctuations in regional foot traffic to clothing and office supplies stores shows, for example, that back-to-school shopping picks up earliest in the South Central region, likely due to earlier school start dates.
But the biggest visit peaks occur in the Northeast – with clothing retailer foot traffic surging in New England in late August, and office supplies stores seeing an even bigger surge in the Middle Atlantic region in early September. Retailers and advertisers can plan their back-to-school deals around these differences, targeting promotions to local trends.
A New England Collegian Affair
Though K-12 families drive much of the back-to-school rush, college student shoppers also play a substantial role. And here, too, their participation varies by region.
For instance, the “Collegians” segment accounted for 2.2% of Target’s shopper base nationwide over the past year – rising to 3.0% in August 2024. But regionally, the share of “Collegians” soared as high as 4.0% in New England versus just 2.2% in the West. So while retailers in New England may choose to lean into the college vibe, those in Western states may place greater emphasis on families with children.
Mother’s Day and Father’s Day: Differing Dining Peaks
When it comes to dining, Mother’s Day and Father’s Day are the busiest days of the year for the full-service restaurant (FSR) category, as families treat their parents to a hassle-free meal out. And eateries nationwide capitalize on this trend by offering a variety of deals and promotions that add a little extra charm (and value) to the experience.
Atlantic Specials
Nationwide, Mother’s Day drives more FSR foot traffic than Father’s Day – except in parts of the Pacific Northwest, where Father’s Day traditions run especially deep. Still, the size of these holiday boosts varies substantially by region.
This year, for instance, Mother’s Day (May 11, 2025) drove the largest FSR surge in the Middle Atlantic, with the South Atlantic and Midwest not far behind. Father’s Day, by contrast, saw its biggest lift in the South Atlantic. Mother’s Day proved least resonant in the West, whereas Father’s Day had its smallest impact in New England.
Going the Extra Mile for Mom
Dining behavior also differs between the two occasions. Mother’s Day celebrants display a slight preference for morning FSR visits and a bigger one for afternoon visits, while Father’s Day crowds favor evenings – perhaps reflecting a preference for sports bars and later dinners with dad. Another interesting nuance: On Mother’s Day, a larger share of FSR visits originate from between 3 and 50 miles away compared to Father’s Day, suggesting that families go the extra mile – sometimes literally – to celebrate mom.
Self-Styled Celebrations: Driving Traffic with DIY Milestones
While established dates like Black Friday or Mother’s Day naturally spur promotions, brands can also craft their own moments with limited-time offers (LTOs). And much like holiday campaigns, these retailer-led events can produce varied outcomes across different regions.
Fast food restaurants, for example, have leaned heavily on limited-time offers (LTOs) and pop-culture tie-ins to fuel buzz in what remains a challenging overall market. And McDonald’s recent Minecraft promotion, launched on April 1, 2025 to coincide with the April 3 release of A Minecraft Move, shows just how impactful the practice can be.
Nationally, the Minecraft promotion (featuring offerings for both kids and adults) drove a 6.9% lift in visits during the movie’s opening week. But the impact of the promotion was far from uniform across the U.S. Many of McDonald’s Western markets – including Utah, Idaho, Nevada, California, Texas, Arizona, Colorado, and Oregon – recorded visit lifts above 10.0%. Meanwhile, Kentucky saw a 2.1% dip, and several other Eastern states registered modest gains below 3.0%. The McDonald’s example illustrates the power of regional tastes to shape the success of even the most creative pop-culture collabs.
Adopting a Regional Lens
Whether it’s properly timing holiday and back-to-school discounts, recognizing where Mother’s Day or Father’s Day will resonate more, or pinpointing markets that respond best to pop-culture tie-ins, the data reveals that effective promotions depend heavily on local nuances. And by analyzing regional and DMA-level trends, retailers and advertisers can craft compelling, relevant campaigns that heighten engagement where it matters most.
Discover how mall anchors are transforming in 2025 – and how a foot-traffic-focused approach to choosing key tenants can drive visits and shopper engagement.
May 29, 2025
8 minutes
Key Takeaways
1. Experiential and niche retailers can deliver anchor-level traffic. At Towne East Square Mall, the addition of a Scheels in 2023 significantly increased foot traffic and long-distance travelers, while Barnes & Noble at Coronado Center in Albuquerque has become a key driver of both foot traffic and higher-spend demographics.
2. Size isn’t everything – especially for dining venues. At Glendale Galleria and Northridge Fashion Center, smaller restaurants attracted more foot traffic than some traditional anchors.
3. Refocusing on tenants’ actual traffic contributions enables a flexible anchor approach. Balancing weekend draws like Scheels with weekday favorites such as Costco or Chick-fil-A can help maintain steady visitor flow throughout the week. Similarly, onsite fitness clubs can shift traffic to earlier in the day – an opportunity to adjust store hours and capture additional morning shoppers.
4. Temporary pop-ups can form an integral part of a visit-focused anchor strategy. The Barbie Dreamhouse Living Truck Tour generates mall visit spikes well above typical Saturday levels. Operators can integrate these events into their overall anchor strategies, offering preferential terms to high-performing pop-ups.
5. New tenants can boost traffic for existing stores in similar categories. After Aldi joined Green Acres Commons in February 2020, visits to an existing BJ’s Wholesale Club trended upwards. This synergy highlights how overlapping audiences can become a strength, creating a larger overall customer base.
The Retail Comeback Kid
Malls, it seems, are cool once again. After languishing in the wake of the pandemic, shopping centers across the country are thriving – reinventing themselves as prime “third places” where people can hang out, shop, and grab a bite to eat.
One key driver behind this resurgence is a shift in how malls view their anchor tenants. While traditional mainstays like Macy’s and JCPenney still play an important role, specialized offerings – from popular eateries to fitness centers and immersive retailtainment destinations – are increasingly taking center stage. These attractions maximize the experiential value that brick-and-mortar venues can deliver, driving visits and sales for the center as a whole.
Against this backdrop, this report leverages the latest location intelligence data to explore the types of tenants that can function as mall anchors in 2025. Should mall operators still focus on general merchandisers to draw crowds, or can dining chains and more niche retailers also do the job? How important is square footage in identifying the anchor-like tenants in a shopping center? And how can a visit-focused approach help mall operators select effective anchor or anchor-like tenants – whether to fill big-box spaces or to leverage the leasing perks traditionally reserved for major large-format chains?
Out-of-the-(Big)-Box Visit Drivers
One of the most important functions of a mall anchor is to ensure steady visitation – providing its smaller tenants with a constant flow of potential customers. And as the role of the mall continues to evolve, analyzing the actual foot traffic impacts of different types of businesses can help identify the kinds of non-traditional anchors best suited to fulfill that purpose.
The Power of a Well-Placed Scheels
Experiential venues, for example, are particularly well-poised to serve as powerful anchors in today’s retail environment – as illustrated by the visit surge experienced by Towne East Square Mall in Wichita, KS following the addition of a Scheels in July 2023.
By blending traditional retail with immersive experiences, Scheels has emerged as a true experiential destination. And this pull has also helped the mall draw more long-distance visitors willing to travel to enjoy Scheels’ offerings. In 2024, 41.9% of the mall’s customers traveled more than 50 miles to visit, compared to 35.8% back in 2018 when Sears occupied the same lot.
Scheels Anchor Brings Substantial Visit Boost to Towne East Square Mall in Wichita, KS, Attracting Visitors From Further Away
Visits to Towne East Square Mall Compared to Q1 2018 Baseline
Share of Visitors From 50+ Miles Away
Share
Embed:
The Barnes & Noble Effect
Traditionally, anchors aimed to please the widest possible audiences – with department stores, big-box chains, and grocery stores leading the way. But visitation data shows that niche concepts can also deliver anchor-level traffic if they’re compelling enough to attract dedicated fans.
The experience of the Barnes & Noble at Coronado Center in Albuquerque, NM is a case in point. After being written off as all but obsolete, Barnes & Noble has staged an impressive comeback in recent years, finding success through a more curated, localized approach to book selling. And despite not being a formal anchor, the Coronado Center Barnes & Noble accounted for 7.9% of visits to the mall in 2024 – outperforming both Macy’s and JCPenney.
Year-over-year data also shows foot traffic surging at the Coronado Center Barnes & Noble, lifting overall visitation to the mall. And demographic data reveals that the bookstore draws a more affluent audience than either the center as a whole or the two department stores – attracting a crowd with more spending power.
This example also illustrates how smaller tenants can sometimes draw larger crowds. Even though Barnes & Noble occupies a smaller onsite space than either Macy’s or JCPenney, it is proving a powerful visit driver out of proportion to its physical size.
Dining Chains Punching Above Their Size
Dining chains are also adept at punching above their square footage – often attracting crowds disproportionate to their size.
Despite its relatively small footprint, for example, the In-N-Out Burger at Glendale Galleria drew an impressive 8.6% of visits to the mall complex in 2024, outpacing some of the mall’s official anchors like DICK’s Sporting Goods, Macy’s, and JCPenney. Still, the onsite Target drew even larger crowds at 14.4% of visits.
A similar pattern emerged at Northridge Fashion Center, where Porto’s Bakery and Cafe captured a notable 15.6% of visits to the complex in 2024 – more than some of the center’s traditional department stores.
These examples underscore the potential for dining chains, which typically require less space, to serve as micro-anchors by consistently attracting outsized crowds – a key consideration for mall operators looking to sustain visitor traffic.
Choosing a Mall Anchor in 2025
Refocusing on tenants’ actual foot traffic contributions also opens the door to a more flexible and dynamic approach to anchor selection and management – one that considers each venue’s unique visitation patterns.
The Weekend/Weekday Divide
Seasonal factors, for example, can make certain anchors more powerful at specific times of the year, while different venues shine on particular days of the week.
At Jordan Creek Town Center in West Des Moines, Iowa, for instance, Scheels and Costco each delivered just under 20.0% of the complex’s overall visits in 2024. But the two retailers’ daily patterns differed significantly: Scheels saw bigger crowds on weekends, while Costco was the primary weekday destination.
Understanding differences like these can help operators optimize their tenant mix to maintain a balanced flow of shoppers throughout the week.
Another example of the impact of differing weekday traffic patterns is offered by the impact of mall-based Chick-fil-A locations on the distribution of mall visits throughout the week.
Despite its relatively small size, Chick-fil-A draws substantial traffic to malls. And after adding Chick-fil-A locations, both Northridge and Miller Hill Malls saw meaningful drops in the share of visits to the centers taking place on Sundays – even as the wider indoor mall segment saw slight upticks.
Recognizing this trend could prompt mall operators to compensate by adding more weekend-friendly traffic drivers – or to lean into this distinction by taking additional steps to bolster the mall’s role as a go-to weekday destination.
The Early-Morning Fitness Advantage
The power of different mall traffic magnets also varies throughout the day. Increasingly, shopping centers are turning to fitness centers as experiential anchors. And since many people work out early in the morning, these gyms are having a significant impact on the distribution of mall visits across dayparts.
The addition of gyms to Northshore Mall in Peabody, MA and Jackson Crossing in Jackson, MI, for instance, led to a significant rise in visits between 7:00 AM and noon. And though the rest of the stores in these malls typically open at 10:00 or 11:00 AM, this shift presents the centers with a significant opportunity.
By adjusting opening hours to accommodate these early-morning patrons, malls can capitalize on this added traffic, driving up visits and sales for relevant tenants – especially health-focused retailers such as juice bars and sporting goods stores.
Adding Temporary Pop-Ups Into the Mix
Adopting a broader, visit-focused view of anchoring also allows mall operators to apply some of the strategies typically reserved for anchors to non-conventional traffic-generating businesses, to ensure a consistent flow of traffic year-round.
Pop-up stores and events, for example, generally don’t follow the same seasonal trends as other retailers – instead, they generate short-term visit boosts during their runs, whenever in the year that may be. And a visit-focused anchor strategy can leverage some of the perks traditionally reserved for anchor tenants – such as preferential leasing terms – to complement traditional full-time anchors during slower retail periods.
The Barbie Dreamhouse Living Truck Tour is a prime example of a traffic-driving pop-up. By bringing exclusive merchandise to malls across the U.S., the truck generates plenty of buzz, drawing crowds eager to snatch up limited-edition items and immerse themselves in all things Barbie. As a result, malls hosting the tour often see significant visit spikes, with foot traffic surging well above typical Saturday levels. Well-timed pop-ups like these can help balance out traffic throughout the year, offsetting traditional slow periods.
Creating a Bigger Visit Pie
A visit-focused approach to anchor management can also help mall operators assess the potential impact of new tenants on existing stores operating in similar categories. For example, mall owners often worry that new tenants operating in similar categories might cannibalize existing businesses. But a visit-focused anchor approach reveals that a well-chosen addition can sometimes benefit current tenants – especially if they cater to similar audiences.
In February 2020, for instance, value supermarket Aldi opened at Green Acres Commons in Valley Stream, NY – a center that already hosted budget-friendly BJ’s Wholesale Club. While BJ’s visits were relatively flat in 2018 and 2019, they began to rise after Aldi’s opening (and following a pandemic-induced dip). Cross-shopping data also shows that Aldi customers were more likely to visit BJ’s than the average Green Acres patron last year.
This synergy may be due in part to the two retailers’ similar visitor bases: In 2024, the Aldi and BJ’s stores in Green Acres Common drew shoppers with comparable economic profiles. This suggests that overlapping audiences can become a strength if aligned brands attract new shoppers, who then explore multiple stores in the same center.
Visits to BJ's Wholesale Club Took Off After Addition of Aldi to Green Acres Commons – Perhaps Buoyed by Audience Similarity
Visits to Green Acres Commons BJ's Wholesale Club, Compared to Q1 2018 Baseline
Median HHI, 2024*
Cross-Shopping, 2024
*Median HHI based on STI: PopStats dataset combined with Placer.ai data for captured trade areas.
Looking ahead, effective mall anchors will be defined less by physical footprint and more by their capacity to maintain consistent, valuable foot traffic. While traditional department stores remain pivotal, smaller or niche brands can often rival – or surpass – large-format retailers. And by thinking out of the anchor box and choosing tenants that cultivate a balanced visitor flow and align with local preferences, operators can position their centers as true go-to destinations.
Dive into the data to see the trends shaping the grocery space in 2025 and uncover actionable insights for strategic decision-making in the competitive food-at-home market.
May 15, 2025
8 minutes
Key Takeaways:
1. Shoppers are taking more, shorter trips to grocery stores.Over the past 12 months, grocery stores have experienced nearly uniform YoY visit growth. And since COVID, the segment has steadily increased both overall visits and average visits per location – even as average dwell times have consistently declined.
2. Grocery stores are holding ground against fierce competition. Despite growing inroads by discount and dollar stores, wholesale clubs, and general mass retailers like Walmart and Target, grocery stores have maintained their share of the overall food-at-home visit pie over the past several years.
3. Grocery visit share is most pronounced on the coasts. In Q1 2025, grocery stores claimed the majority of food-at-home visits on the West Coast, in parts of the Northeast, Mid-Atlantic, and Mountain Regions, and in Florida and Michigan.
4. Fresh-format, value, and ethnic grocery visit shares are growing at the expense of traditional chains. And in Q1 2025, fresh-format and value grocers outperformed the other sub-segments with positive YoY visit and average visit-per-location growth.
5. Hispanic markets are on the rise. Though the broader ethnic grocery sub-segment was essentially flat YoY in Q1 2025, Hispanic-focused stores recorded increases in both visits and visits per location – and have been steadily growing visits since 2021.
6. Smaller formats for the win. In Q1 2025, smaller-format grocery store locations outpaced mid-sized and larger-format ones, underscoring the power of compact spaces to deliver significant foot traffic gains.
A Study in Resilience
Brick-and-mortar grocery stores face an uncertain market in 2025. Rising food-at-home prices (eggs, anyone?), declining consumer confidence, and increased competition from discounters, superstores, and online shopping channels all present the segment with significant headwinds. Yet even in the face of these challenges, the sector has demonstrated remarkable resilience – growing its foot traffic and holding onto visit share.
What strategies have helped the segment navigate today’s tough market? And how can industry stakeholders make the most of the opportunities in the current market? This report draws on the latest location intelligence to uncover the trends shaping grocery retail in early 2025 – highlighting insights to help key players make informed, data-driven decisions on store formats, product offerings, and more.
Growth in Aisle One
The grocery segment has experienced nearly uniform positive year-over-year (YoY) growth over the last 12 months. This sustained performance in the face of inflation and other headwinds highlights the underlying strength of the category.
Visits Up, Dwell Time Down
What is driving this growth? Since 2022, the grocery segment has seen consistent overall visit growth that has outpaced increases in visits per location – a sign that chain expansion has played a key role in the category’s success. But the average number of visits to each grocery store has also been on the rise, indicating that the segment continues to expand without cannibalizing existing store traffic.
At the same time, visitor dwell times have been steadily dropping since 2021. This shift appears to reflect a trend towards multiple, shorter trips by inflation-wary consumers eager to avoid large, costly carts or cherry pick deals across various retailers. Many shoppers may also be placing more bulk orders online and supplementing those deliveries with brief in-store stops for additional items as needed.
The bottom line: Shoppers are taking more grocery trips overall each year, but spending less time in-store during each visit. Operators can respond to this trend by optimizing layouts and promoting “grab-and-go” areas for an even more efficient quick-trip experience.
Still in Stock
Visit share data also shows that despite fierce competition from discount and dollar stores, wholesalers, and general mass retailers, the grocery segment has steadfastly preserved its share of the overall food-at-home visit pie.
Between Q1 2019 and Q1 2025, wholesale clubs and discount and dollar stores increased their share of total food-at-home visits, gains that have come primarily at the expense of Walmart and Target. Meanwhile, grocery outlets have held firm – despite some fluctuations over the years, their Q1 2019 visit share remained essentially unchanged in Q1 2025.
So even as consumers flock to alternative food purveyors in search of lower prices, grocery stores aren’t losing ground – and on a nationwide level, they remain the biggest player by far in the food-at-home shopping space.
A Coastal Advantage
Still, grocery store visit share varies significantly by region. On the West Coast, in parts of the Northeast, Mid-Atlantic, and Mountain regions, and in Florida and Michigan, grocery stores accounted for the majority of food-at-home visits in Q1 2025. Oregon (61.6%) and Washington (59.6%) led the pack, followed by Massachusetts (59.2%), Vermont (58.5%), and California (57.9%). Meanwhile, in West Virginia, Arkansas, South Dakota, Oklahoma, North Dakota, and Mississippi, less than 30% of food-at-home traffic went to grocery stores, with more shoppers in these regions turning to general mass retailers or discounters.
Grocery store operators in lower-grocery-share regions may choose to focus on price competitiveness and convenient store locations to capture more foot traffic from competitors in the space.
Fresh and Frugal on the Rise
Which types of grocery stores are thriving the most? The grocery segment is diverse, encompassing traditional grocery chains like Kroger, Safeway, and H-E-B; budget-oriented value chains such as Aldi, WinCo Foods, Grocery Outlet Bargain Market, and Market Basket; fresh-format specialty brands like Trader Joe’s, Whole Foods, and Sprouts Farmers Market; and numerous ethnic grocers.
Examining shifts in visit share among these various grocery store segments shows that traditional grocery still dominates, commanding over 70.0% of total grocery store foot traffic.
Still, over the past several years, traditional grocers have gradually ceded ground to other segments – especially value chains. Budget grocers saw a temporary surge in visits during the panic-buying days of early 2020 – and have been more gradually gaining visit share since Q1 2023. . Fresh-format banners, which lost ground in 2021 after a Q1 2020 bump, in the wake of COVID, have also been on the upswing and appear poised to capture additional visit share in the coming months and years. And though ethnic grocers still account for a relatively small portion of the overall market, they have slightly increased their visit share, reflecting heightened consumer interest in these specialized offerings.
The Discount and Premium Edge
Recent performance metrics point to a bifurcation in the grocery market similar to that observed in other retail categories. In Q1 2025, fresh-format and value retailers – which appeal, respectively, to the most and least affluent visitor bases – saw the greatest growth in both overall visits and average visits per location.
This trend highlights the power of both value and health-focused quality to motivate consumers in 2025. And grocery players that can meet these needs will be well-positioned for success in the months ahead.
WFH Fresh-Format Lunch Crunch
One factor fueling fresh-format’s success may be its role as a convenient, relatively affordable midday lunch destination for the remote work crowd.
In Q1 2025, consumers working from home accounted for 20.2% of fresh-format grocery stores’ captured market – a significantly higher share than any other analyzed grocery segment. These stores also tended to be busier midday than the other segments. Remote workers may be stopping by to grab a quick bite – and some may be choosing to do their grocery shopping during their lunch break when stores are less crowded.
This finding suggests an opportunity for grocery operators across all segments to develop or enhance in-store salad bars and quick-serve sections to tap into the lunch rush. Likewise, CPG companies may benefit from developing more ready-made, nutritious meal options that align with these midday dining habits.
Salsa Surge
Though the broader ethnic grocery category remained essentially flat in Q1 2025, Hispanic-focused grocers emerged as a sub-segment to watch. Both overall visits and average visits per location to these stores have been on the rise since 2021.
This robust demand presents an opportunity for CPG brands and grocers across segments to expand Hispanic-focused offerings, capturing a slice of this growing market.
Less is More
Finally, store size matters more than ever in 2025. During the first quarter of the year, smaller format grocery store locations (locations under 30K square feet, across different chains) outpaced larger stores with a 3.2% YoY jump in visits, showing that bigger isn’t always better in the grocery store space.
This pattern aligns with the decrease in dwell times noted above – shoppers may be making shorter trips to smaller, more convenient grocery store locations. These quick errands are ideal for picking up a few items to supplement online orders, shopping multiple deals, or sourcing specialty products unavailable at larger grocery destinations. And to lean into this trend, grocery operators might consider testing neighborhood “micro-store” concepts, focusing on curated selections, and offering convenient parking or pickup to match consumer preferences for targeted purchases and quicker trips.
Final Thoughts
Location intelligence reveals a growing, dynamic grocery landscape which is holding its ground in the face of increased competition. Shorter trips, busier lifestyles, and changing work routines are reshaping in-store experiences. And grocery players that refine their store formats, target both lunch and on-the-go shoppers, and adapt to shifting demographics can position themselves to thrive in this competitive sector. As the market continues to evolve, continuous attention to these changing patterns will be key to maintaining and expanding market share.


.svg)


.avif)

.avif)