Key Takeaways:
1. The hypergrowth of Costco, Dollar Tree, and Dollar General between 2019 and 2025 has fundamentally changed the brick-and-mortar retail landscape.
2. Overall visits to Target and Walmart have remained essentially stable even as traffic to the new retail giants skyrocketed – so the increased competition is not necessarily coming at legacy giants' expense. Instead, each retail giant is filling a different need, and success now requires excelling at specific shopping missions rather than broad market dominance.
3. Cross-shopping has become the new normal, with Walmart and Target maintaining their popularity even as their relative visit shares decline, creating opportunities for complementary rather than purely competitive strategies.
4. Dollar stores are rapidly graduating from "fill-in" destinations to primary shopping locations, signaling a fundamental shift in how Americans approach everyday retail.
5. Walmart still enjoys the highest visit frequency, but the other four chains – and especially Dollar General – are gaining ground in this realm.
6. Geographic and demographic specialization is becoming the key differentiator, as each chain carves out distinct niches rather than competing head-to-head across all markets and customer segments.
Shifting Retail Dynamics
Evolving shopper priorities, economic pressures, and new competitors are reshaping how and where Americans buy everyday goods. And as value-focused players gain ground, legacy retail powerhouses are adapting their strategies in a bid to maintain their visit share. In this new consumer reality, shoppers no longer stick to one lane, creating a complex ecosystem where loyalty, geography, and cross-visitation patterns – not just market share – define who is truly winning.
This report explores the latest retail traffic data for Walmart, Target, Costco, Dollar Tree, and Dollar General to decode what consumers want from retail giants in 2025. By analyzing visit patterns, loyalty trends, and cross-shopping shifts, we reveal how fast-growing chains are winning over consumers and uncover the strategies helping legacy players stay competitive in today's value-driven retail landscape.
The New Competitive Landscape
Dollar General, Dollar Tree, and Costco's Hypergrowth Since 2019
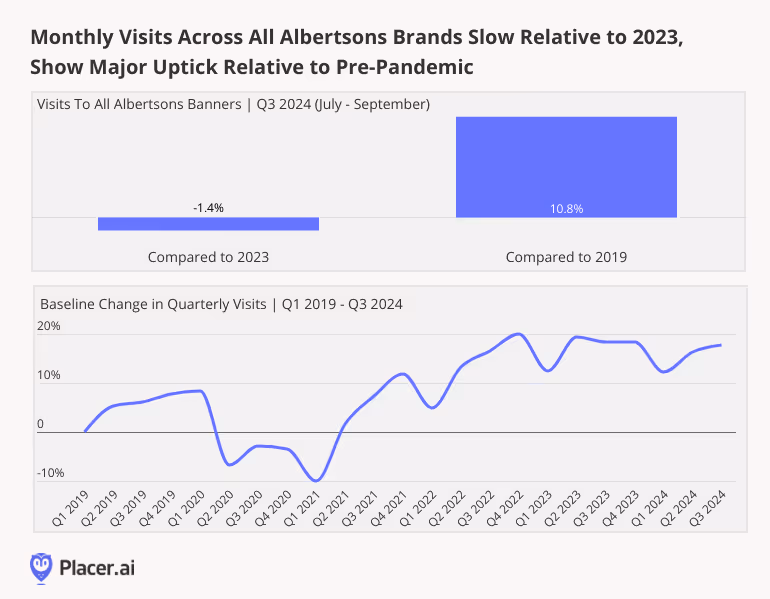
In 2019, Walmart and Target were the two major behemoths in the brick-and-mortar retail space. And while traffic to these chains remains close to 2019 levels, overall visits to Dollar General, Dollar Tree, and Costco have increased 36.6% to 45.9% in the past six years. Much of the growth was driven by aggressive store expansions, but average visits per location stayed constant (in the case of Dollar Tree) or grew as well (in the case of Dollar General and Costco). This means that these chains are successfully filling new stores with visitors – consumers who in the past may have gone to Walmart or Target for at least some of the items now purchased at wholesale clubs and dollar stores.
This substantial increase in visits to Costco, Dollar General, and Dollar Tree has altered the competitive landscape in which Walmart and Target operate. In 2019, 55.9% of combined visits to the five retailers went to Walmart. Now, Walmart’s relative visit share is less than 50%. Target received the second-highest share of visits to the five retailers in 2019, with 15.9% of combined traffic to the chains. But Between January and July 2025, Dollar General received more visits than Target – even though the discount store had received just 12.1% of combined visits in 2019.
Some of the growth of the new retail giants could be attributed to well-timed expansion. But the success of these chains is also due to the extreme value orientation of U.S. consumers in recent years. Dollar General, Dollar Tree, and Costco each offer a unique value proposition, giving today's increasingly budget-conscious shoppers more options.
The Role of Each Retail Giant in the Wider Retail Ecosystem
Walmart’s strategy of "everyday low prices" and its strongholds in rural and semi-rural areas reflect its emphasis on serving broad, value-focused households – often catering to essential, non-discretionary shopping.
Dollar General serves an even larger share of rural and semi-rural shoppers than Walmart, following its strategy of bringing a curated selection of everyday basics to underserved communities. The retailer's packaging is typically smaller than Walmart's, which allows Dollar General to price each item very affordably – and its geographic concentration in rural and semi-rural areas also highlights its direct competition to Walmart.
By contrast, Target and Costco both compete for consumer attention in suburban and small city settings, where shopper profiles tilt more toward families seeking one-stop-shopping and broader discretionary offerings. But Costco's audience skews slightly more affluent – the retailer attracts consumers who can afford the membership fees and bulk purchasing requirements – and its visit growth may be partially driven by higher income Target shoppers now shopping at Costco.
Dollar Tree, meanwhile, showcases a uniquely balanced real estate strategy. The chain's primary strength lies in suburban and small cities but it maintains a solid footing in both rural and urban areas. The chain also offers a unique value proposition, with a smaller store format and a fixed $1.25 price point on most items. So while the retailer isn't consistently cheaper than Walmart or Dollar General across all products, its convenience and predictability are helping it cement its role as a go-to chain for quick shopping trips or small quantities of discretionary items. And its versatile, three-pronged geographic footprint allows it to compete across diverse markets: Dollar Tree can serve as a convenient, quick-trip alternative to big-box retailers in the suburbs while also providing essential value in both rural and dense urban communities.
As each chain carves out distinct geographic and demographic niches, success increasingly depends on being the best option for particular shopping missions (bulk buying, quick trips, essential needs) rather than trying to be everything to everyone.
Cross-Shopping on the Rise Despite Visit Share Shuffle
Still, despite – or perhaps due to – the increased competition, shoppers are increasingly spreading their visits across multiple retailers: Cross-shopping between major chains rose significantly between 2019 and 2025. And Walmart remains the most popular brick-and-mortar retailer, consistently ranking as the most popular cross-shopping destination for visitors of every other chain, followed by Target.
This creates an interesting paradox when viewed alongside the overall visit share shift. Even as Walmart and Target's total share of visits has declined, their importance as a secondary stop has actually grown. This suggests that the legacy retail giants' dip in market share isn't due to shoppers abandoning them. Instead, consumers are expanding their shopping routines by visiting other growing chains in addition to their regular trips to Walmart and Target, effectively diluting the giants' share of a larger, more fragmented retail landscape.
Cross-visitation to Costco from Walmart, Target, and Dollar Tree also grew between 2019 and 2025, suggesting that Costco is attracting a more varied audience to its stores.
But the most significant jumps in cross-visitation went to Dollar Tree and Dollar General, with cross-visitation to these chains from Target, Walmart, and Costco doubling or tripling over the past six years. This suggests that these brands are rapidly graduating from “fill-in” fare to primary shopping destinations for millions of households.
The dramatic rise in cross-visitation to dollar stores signals an opportunity for all retailers to identify and capitalize on specific shopping missions while building complementary partnerships rather than viewing every chain as direct competition.
Competition For Visit Frequency in a Fragmented Retail Landscape
Walmart’s status as the go-to destination for essential, non-discretionary spending is clearly reflected in its exceptional loyalty rates – nearly half its visitors return at least three times per month on average -between January to July 2025, a figure virtually unchanged since 2019. This steady high-frequency visitation underscores how necessity-driven shopping anchors customer routines and keeps Walmart atop the retail loyalty ranks.
But the data also reveals that other retail giants – and Dollar General in particular – are steadily gaining ground. Dollar General's increased visit frequency is largely fueled by its strategic emphasis on adding fresh produce and other grocery items, making it a viable everyday stop for more households and positioning it to compete more directly with Walmart.
Target also demonstrates a notable uptick in loyal visitors, with its share of frequent shoppers visiting at least three times a month rising from 20.1% to 23.6% between 2019 and 2025. This growth may suggest that its strategic initiatives – like the popular Drive Up service, same-day delivery options, and an appealing mix of essentials and exclusive brands – are successfully converting some casual shoppers into repeat customers.
Costco stands out for a different reason: while overall visits increased, loyalty rates remained essentially unchanged. This speaks to Costco’s unique position as a membership-based outlet for targeted bulk and premium-value purchases, where the shopping behavior of new visitors tends to follow the same patterns as those of its already-loyal core. As a result, trip frequency – rooted largely in planned stock-ups – remains remarkably consistent even as the warehouse giant grows foot traffic overall.
Dollar Tree currently has the smallest share of repeat visitors but is improving this metric. As it successfully encourages more frequent trips and narrows the loyalty gap with its larger rivals, it's poised to become an increasing source of competition for both Target and Costco.
The increase in repeat visits and cross-shopping across the five retail giants showcases consumers' current appetite for value-oriented mass merchants and discount chains. And although the retail giants landscape may be more fragmented, the data also reveals that the pie itself has grown significantly – so the increased competition does not necessarily need to come at the expense of legacy retail giants.
The Path Forward
The retail landscape of 2025 demands a fundamental shift from zero-sum competition to strategic complementarity, where success lies in owning specific shopping missions rather than fighting for total market dominance. Retailers that forego attempting to compete on every front and instead clearly communicate their mission-specific value propositions – whether that's emergency runs, bulk essentials, or family shopping experiences – may come out on top.


.svg)