

.svg)


Thank you! Your submission has been received!
Oops! Something went wrong while submitting the form.
0
0
0
0
----------
0
0
Articles

Article
Waning Consumer Sentiment Puts Pressure on Retail IndustryAfter years of resilience, consumers appear to be pulling back as retail traffic softens alongside record-low consumer sentiment.
Elizabeth Lafontaine
Jun 8, 2026
2 minutes
Article
Restaurants at an Inflection Point: Takeaways from the 2026 NRA ShowThe 2026 NRA Show revealed an industry at an inflection point, where value, innovation, and loyalty are separating winners from the pack.
R.J. Hottovy
Jun 5, 2026
4 minutes

Article
Super Mario Galaxy's Impact on Movie Theater AudienceThe Super Mario Galaxy Movie reshaped theater audiences in 2026, driving family attendance, morning matinees, and post-movie QSR visits.
Shira Petrack
Jun 4, 2026
2 minutes
Article
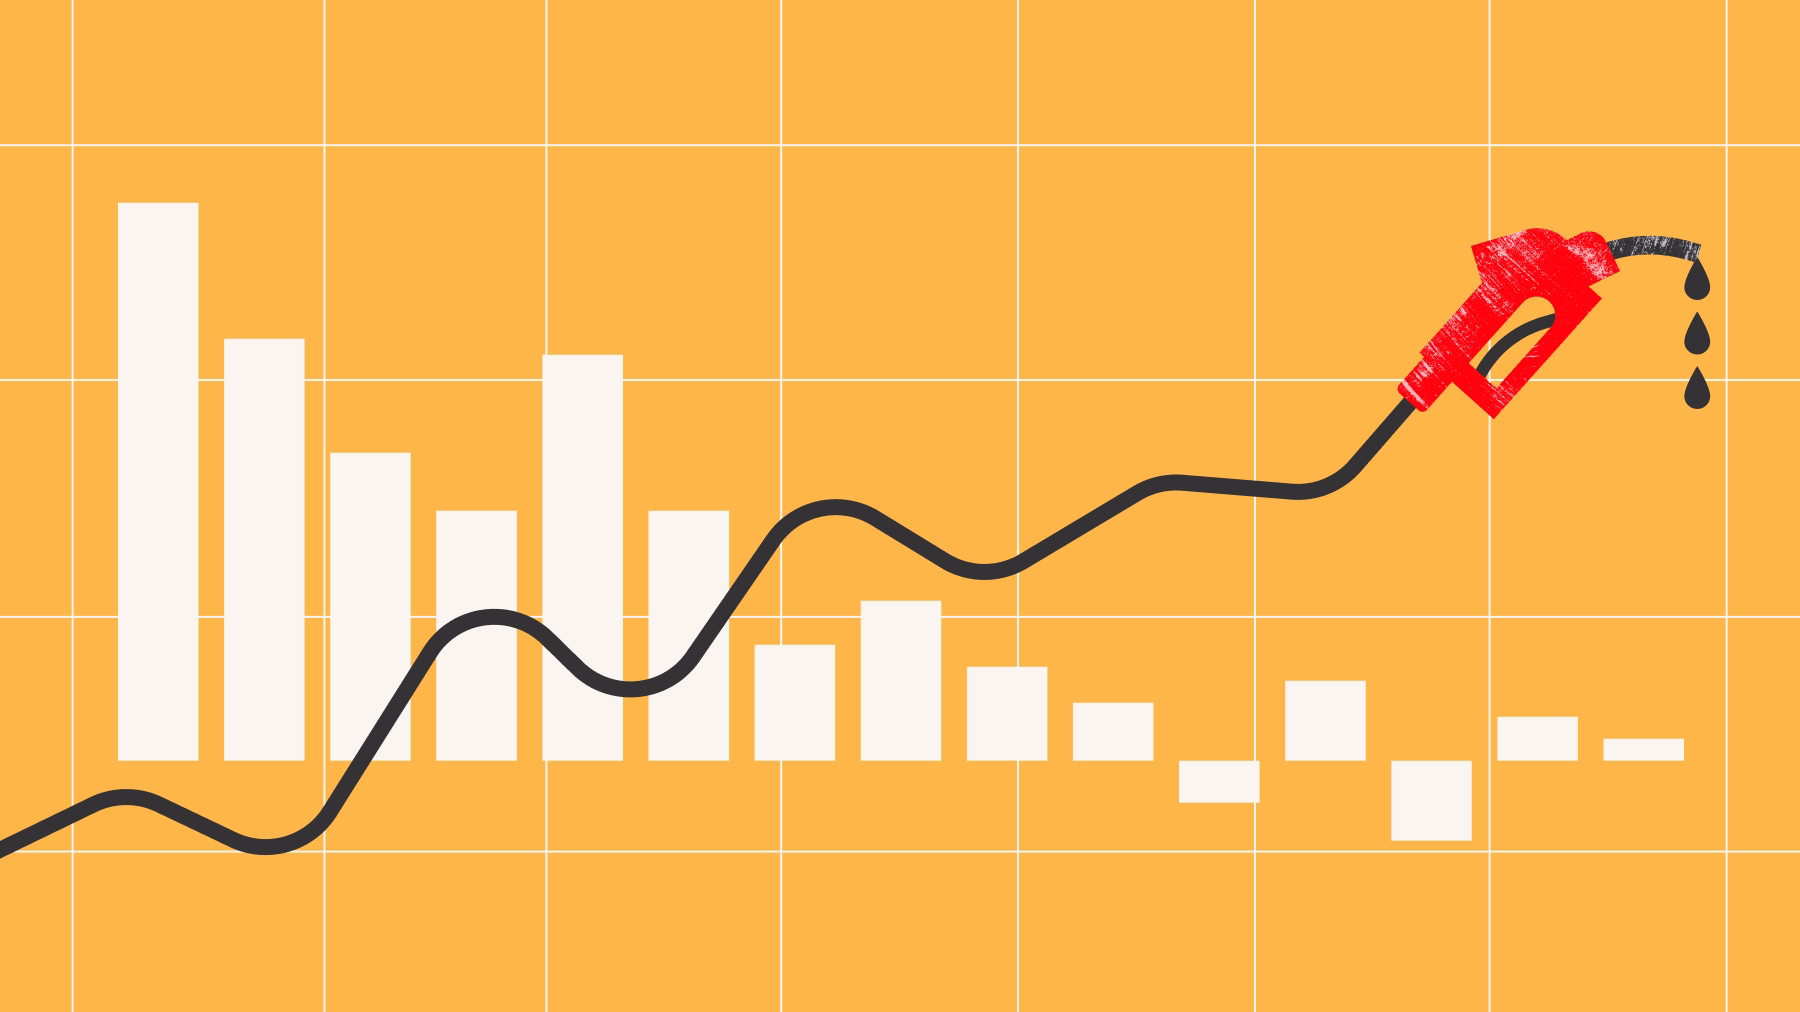
Rising Gas Prices Are Changing How America Fills Up – And ShopsGas prices climbed nearly 60% in early 2026 — and foot traffic data shows consumers are finally changing how they fill up and shop. See what the numbers reveal.
Ezra Carmel
Jun 3, 2026
4 minutes

Article
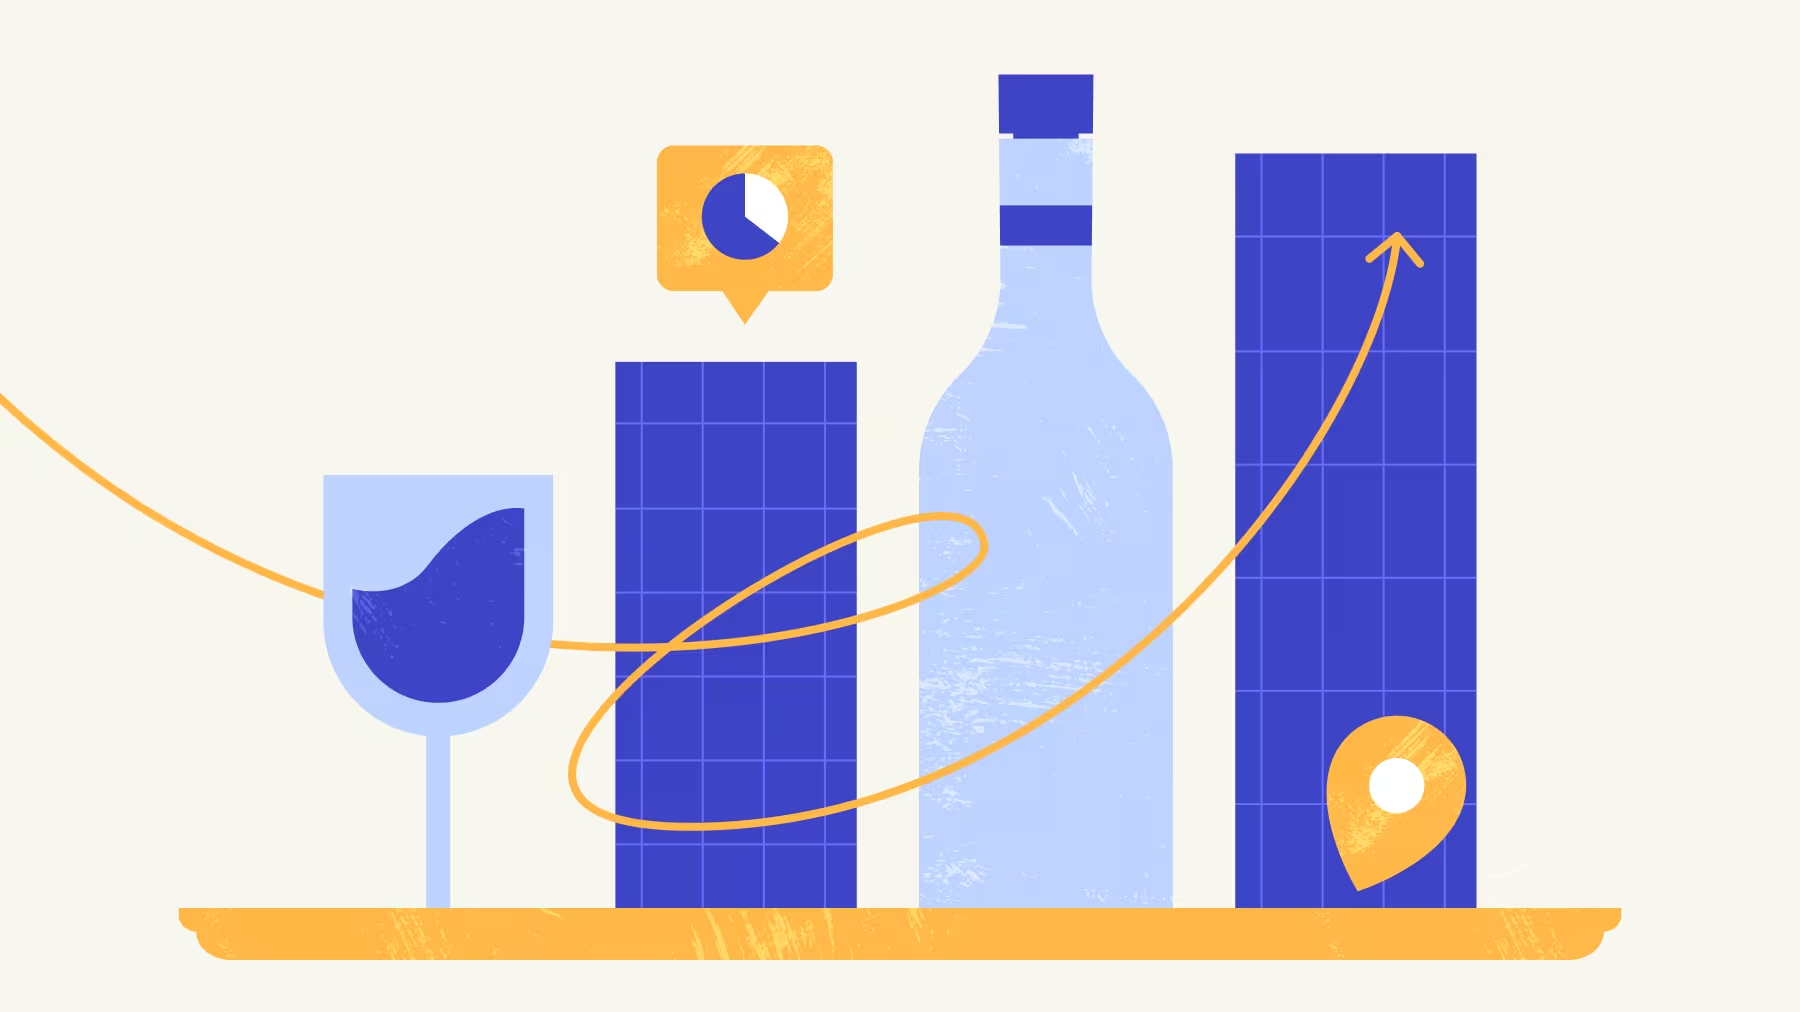
Consumer Desire for Small Indulgences Boosts Hobby RetailConsumers are embracing hobbies like book clubs, crafting, Mahjong, and journaling as affordable indulgences, boosting traffic to retailers including Barnes & Noble (BKS), Michaels, and Paper Source.
Elizabeth Lafontaine
Jun 1, 2026
3 minutes
Article
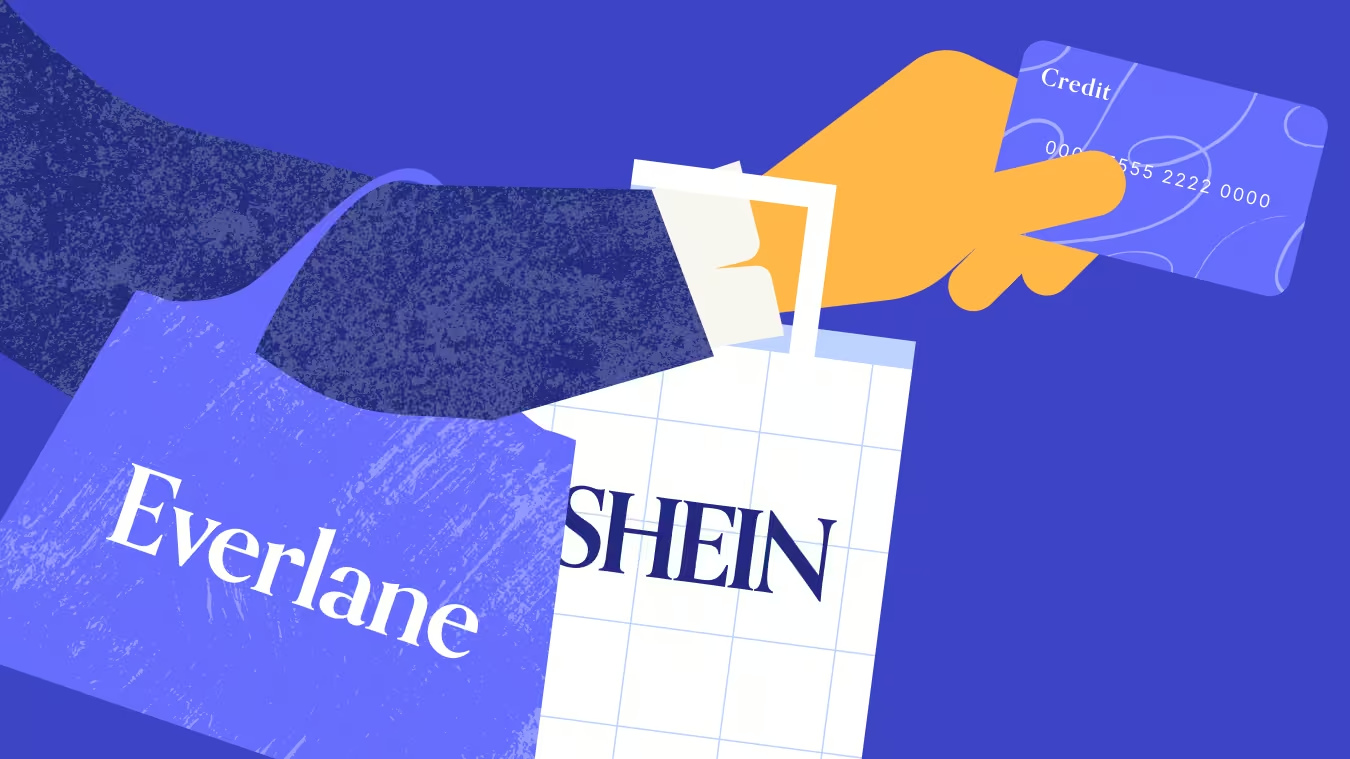
What Shein Is Really Buying with EverlaneShein’s reported $100M acquisition of Everlane is about more than a sustainability halo – it’s also a bid for direct access to the high-income, urban consumers the fast-fashion giant has long struggled to reach.
Lila Margalit
May 29, 2026
3 minutes
Reports
INSIDER
Q4 2023 Quarterly IndexFind out how the Fitness, Beauty & Self Care, Discount & Dollar Stores, Superstores, Grocery Stores, and Dining categories fared during last year’s all-important holiday shopping season.
February 15, 2024
6 minutes
INSIDER
10 Top Brands to Watch in 2024This report analyzes the latest location intelligence data to identify ten brands poised to succeed in 2024.
February 8, 2024

INSIDER
The Retail Opportunity of StadiumsDive into the location intelligence to understand the significant retail and dining opportunities in and around major stadiums – both during games and in the off-season.
January 11, 2024
7 minutes
Loading results...
We couldn't find anything matching your search.
Browse one of our topic pages to help find what you're looking for.
For more in-depth analyses on a variety of subjects, explore Reports.
For more in-depth analyses on a variety of subjects, explore Reports.

INSIDER
Stay Anchored: Subscribe to Insider & Unlock more Foot Traffic Insights
Gain insider insights with our in-depth analytics crafted by industry experts
— giving you the knowledge and edge to stay ahead.

