

.svg)


Thank you! Your submission has been received!
Oops! Something went wrong while submitting the form.
0
0
0
0
----------
0
0
Articles

Article
What Really Separated Full-Service Dining's Winners in Q2 2026?In Q2 2026, Brinker visits rose 3.2% YoY while Dine Brands fell 4.2%. Placer.ai data shows why brand execution – not just segment positioning – separated the full-service dining winners.
Lila Margalit
Jul 31, 2026
4 minutes

Article
Why RBI Weathered Q2 2026 Better Than Most QSR ChainsFoot traffic data shows how Burger King's turnaround, Firehouse Subs' growth, and Popeyes' June rebound helped RBI outperform QSR chains in Q2 2026.
Lila Margalit
Jul 30, 2026
3 minutes

Article
Yum! Brands Stayed Ahead as Its Growth Engine Cooled in Q2 2026Placer.ai data shows Yum! Brands outpaced the QSR category in Q2 2026, as Pizza Hut led per-location growth and Taco Bell lapped a strong 2025.
Lila Margalit
Jul 29, 2026
4 minutes
.avif)
Article
Frozen Yogurt's Comeback Is More Than NostalgiaFrozen yogurt is making a comeback, with visitation trends suggesting the category is benefiting from viral momentum and changing consumer habits.
Elizabeth Lafontaine
Jul 28, 2026
1 minute
Article
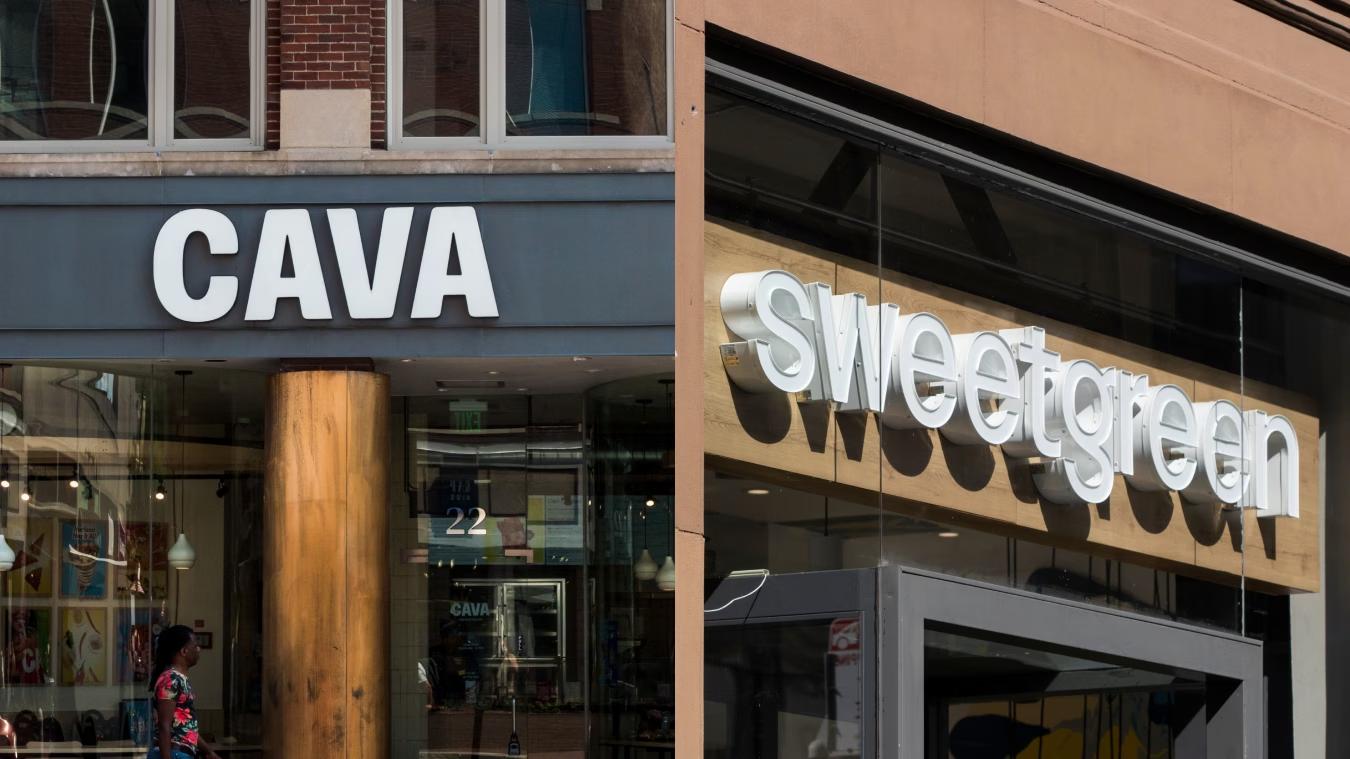
Sweetgreen Rebounds & CAVA Keeps ClimbingQ2 2026 visitation trends suggest that CAVA continues to sustain exceptional growth while sweetgreen's turnaround efforts are beginning to gain traction.
Shira Petrack
Jul 27, 2026
2 minutes
Article
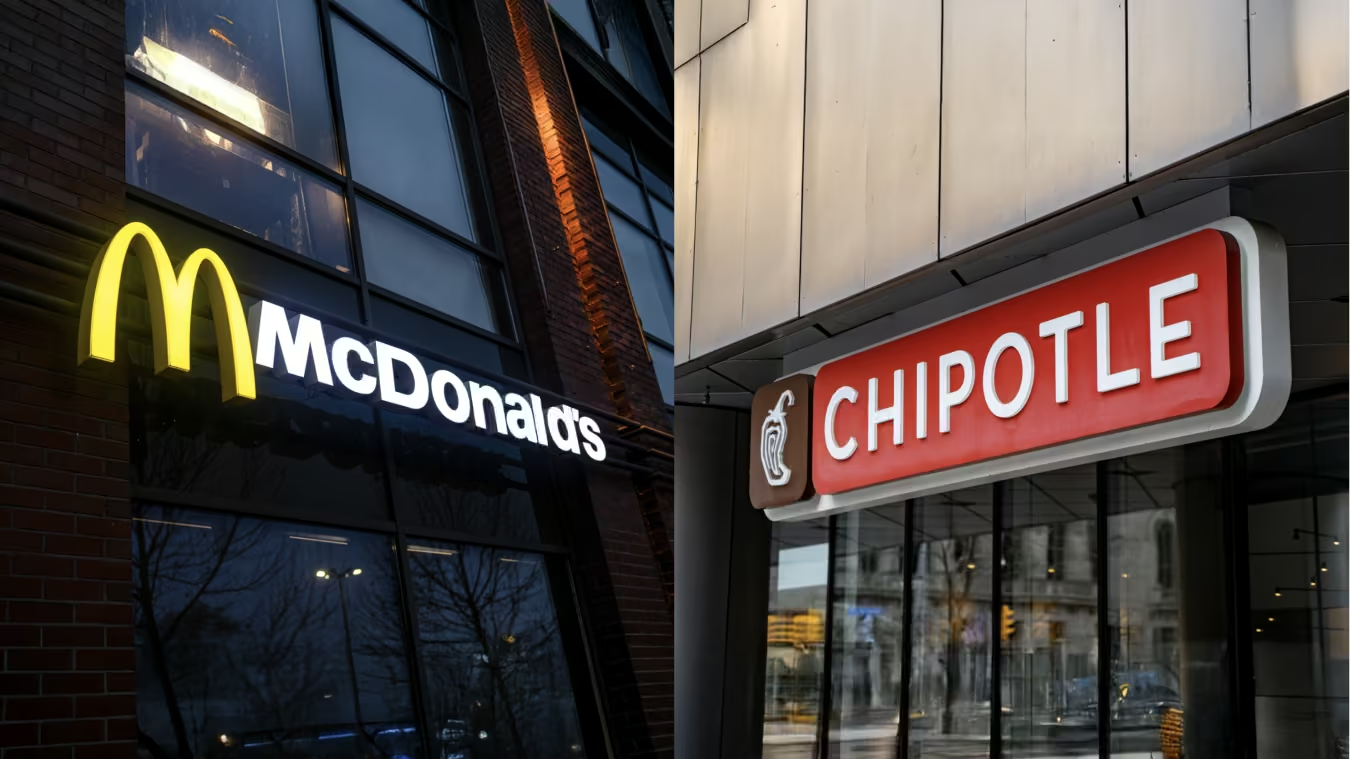
Why Chipotle and McDonald's Took Different Paths in Q2 2026Visitation data suggests customer demographics helped Chipotle outperform McDonald's in Q2 2026.
Shira Petrack
Jul 24, 2026
2 minutes
Show More
1 / 122
Reports
INSIDER
Q4 2023 Quarterly IndexFind out how the Fitness, Beauty & Self Care, Discount & Dollar Stores, Superstores, Grocery Stores, and Dining categories fared during last year’s all-important holiday shopping season.
February 15, 2024
6 minutes
INSIDER
10 Top Brands to Watch in 2024This report analyzes the latest location intelligence data to identify ten brands poised to succeed in 2024.
February 8, 2024

INSIDER
The Retail Opportunity of StadiumsDive into the location intelligence to understand the significant retail and dining opportunities in and around major stadiums – both during games and in the off-season.
January 11, 2024
7 minutes
Loading results...
We couldn't find anything matching your search.
Browse one of our topic pages to help find what you're looking for.
For more in-depth analyses on a variety of subjects, explore Reports.
For more in-depth analyses on a variety of subjects, explore Reports.

INSIDER
Stay Anchored: Subscribe to Insider & Unlock more Foot Traffic Insights
Gain insider insights with our in-depth analytics crafted by industry experts
— giving you the knowledge and edge to stay ahead.

