Overview
The grocery industry has navigated unprecedented challenges in recent years – from pandemic-driven shifts in consumer behavior and supply chain disruptions to rising costs, labor shortages, and increased operational demands. In the face of these hurdles, the category has been pushed to innovate, adapting everything from product selections to shopping formats to meet changing consumer expectations.
But within the grocery industry, some segments resonate particularly strongly with the 2024 consumer. This white paper dives into the data to explore two segments that have been leading category-wide visit growth for some time: specialty and fresh format stores, which focus on produce, organic foods, and culturally specific items (think Trader Joe’s, Sprouts Farmers Market, and H Mart, to name a few), and value grocery chains like Aldi, WinCo Foods, and Grocery Outlet Bargain Market. Location analytics show shoppers are increasingly drawn to these two grocery store types, a shift that has the potential to reshape the grocery landscape.
How did value and specialty grocery chains perform in Q3 2024 in comparison to traditional supermarkets like Kroger, Albertsons, and H-E-B? How does visitor behavior vary between the three grocery segments, and what differences can be observed in the demographic and psychographic make-ups of their trade areas? The report explores these questions and more below.
Grocery’s Continued Resilience
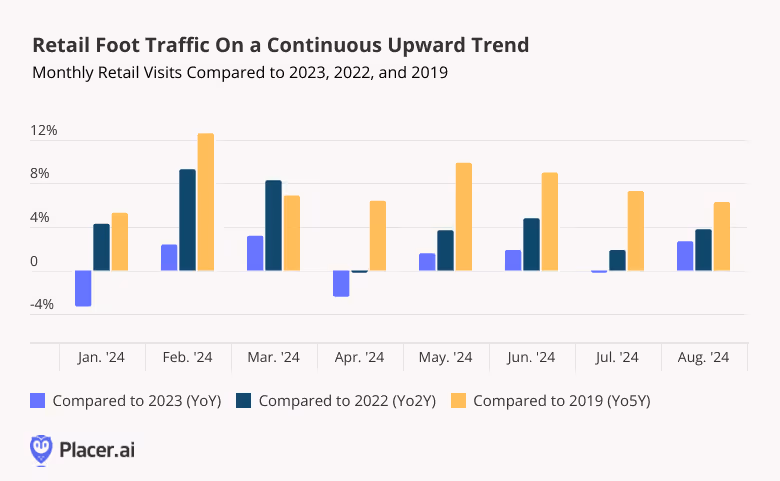
The grocery industry has performed well over the past few months, with steady weekly year-over-year (YoY) visit increases throughout Q3 2024. During the week of July 1st, the segment saw a 4.6% YoY foot traffic boost, likely driven by shoppers loading up on ingredients for Independence Day barbecues and picnics. And after tapering somewhat in early August, visits picked up again in September, with YoY increases ranging from 2.0% to 2.9% throughout the month. This positive growth is a good sign for the segment – which has experienced more than its fair share of challenges over the past few years.
Non-Traditional Grocery Chains Propel Industry Growth in 2024
Though the grocery category as a whole is thriving, a closer look at different segments within the industry reveals that some are seeing more significant growth than others.
Indeed, digging deeper into grocery visits throughout Q3 2024 reveals that much of the industry’s growth is being driven by specialty and fresh format stores and value grocery chains. The two segments offer markedly different shopping experiences: Specialty chains tend to emphasize harder-to-find ingredients and fresh produce – sometimes even at higher price points than traditional grocery stores – while value grocery stores focus on affordability. But both categories are experiencing outsize visit growth in 2024, highlighting consumers’ dual interest in both quality and value.
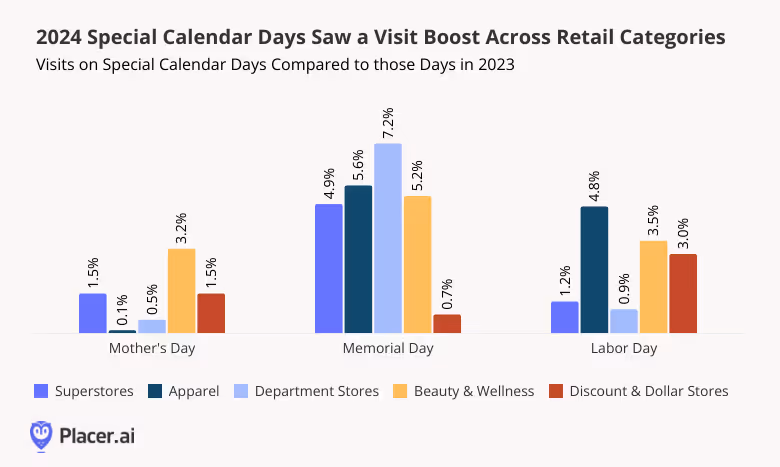
In July and August 2024, traditional supermarkets, specialty grocers, and value chains all experienced positive YoY visit growth. But while traditional grocery stores saw a 3.1% increase in July and just a 0.9% uptick in August, value and specialty chains saw YoY growth ranging from 4.7% to 7.7% during the two months. In September 2024, YoY visits to traditional grocery stores fell by 0.5%, while value and specialty chains saw 5.0% and 5.2% increases, respectively. For today’s consumer, it seems, savings are key – but specialty offerings also resonate strongly.
Shoppers Go the Extra Mile for Specialty Finds
Traveling Further to Specialty Grocery Stores
Today’s grocery shoppers are increasingly embracing specialty grocery options – and analyzing consumer driving habits to grocery stores shows that they are willing to go the extra mile to reach them.
Breaking down grocery visits by distance traveled reveals that just 18.5% of visits to specialty and fresh format grocery chains came from less than one mile away in Q3 2024 – compared to 23.9% for traditional grocery stores and 23.2% for value chains. Similarly, 31.3% of visits to specialty and fresh format grocery stores originated from one to three miles away, compared to 34.7% and 34.5% for the other analyzed segments.
On the flip side, some 26.4% of visits to specialty and fresh format stores were made by people traveling at least seven miles to do their shopping – compared to 22.7% and 21.4% for traditional and value chains, respectively. Specialty grocery operators can account for this difference, locating stores in areas accessible to geographically dispersed audiences eager to shop their unique offerings.
Longer Drives Each Year
And a look at changes in visitor behavior at three key specialty chains – Trader Joe’s, Sprouts Farmers Market, and Great Wall Supermarket – shows that even as these brands expand their footprints, customers are increasingly willing to travel the distance to visit them. Between 2019 and 2024, all three chains saw a marked increase in the share of visitors traveling over seven miles to shop their offerings. .
Asian grocery chain Great Wall Supermarket, a relatively small regional chain with some 22 locations across eight states, saw the most significant increase in visits from afar over the analyzed period. In Q3 2024, 32.3% of visits to the chain originated from seven or more miles away, up from 28.3% in Q3 2019. Ranked America’s Best Supermarket by Newsweek in 2024, the chain’s wide selection of everything from seafood to fresh produce has made it a hit among Asian food aficionados – and as the supermarket’s reputation grows, so does its draw among customers living further away from its venues.
Consumer favorite Trader Joe’s and organic grocery chain Sprouts Farmers Market also grew their shares of long-distance visits between 2019 and 2024 – no small feat for the two chains, given their expansion over the past several years.
This travel distance snapshot serves as a reminder of the unique role played by specialty grocery stores that offer their customers unique shopping experiences, premium or organic products, and culturally specific items. Shoppers will go out of their way to travel to these stores – and even as they expand and become more readily accessible, their growing popularity makes them ever-more attractive destinations for customers coming from further away.
Cost-Conscious Consumers Take Their Time at Value Grocers
While visitors to specialty grocery chains often travel long distances for unique offerings, cost-conscious consumers at value stores exhibit other behaviors that differentiate them from traditional and specialty grocery shoppers.
In Search of Savings
The rising cost of living has pushed the discount retail segment into overdrive – and value grocery chains are also benefiting. The category has flourished in recent years, with many bargain-oriented grocery chains adding new stores at a rapid clip to meet burgeoning consumer demand.
Like visitors to specialty grocery chains, value grocery shoppers demonstrate segment-specific behaviors that reflect their preferences and habits. And perhaps most strikingly, foot traffic data reveals that these shoppers tend to stay longer in-store than visitors to traditional and specialty grocery chains.
In Q3 2024, 26.5% of visits to value grocery chains lasted longer than 30 minutes, compared to 23.4% for traditional grocery chains and 23.7% for specialty and fresh format chains. This suggests that these stores attract shoppers who take their time and carefully consider price points, looking for the best value for their dollar – a need that the chains they frequent seem to be meeting.
Given the tremendous success of the value grocery space in recent years, it may come as no surprise that some traditional supermarkets are getting in on the action by opening or expanding discount banners of their own. How do such off-shoot banners impact these grocers’ reach?
H-E-B’s Value Banner Draws Parents – Balancing Visit Frequency with Duration
Cult-favorite Texas grocery chain H-E-B opened the first branch of its value banner, Joe V’s Smart Shop, in 2010. The discount arm currently includes 11 stores – mainly in the Houston area – with several new stores opening, or in planning stages, in Dallas.
And foot traffic data shows that Joe V's attracts mission-driven shoppers who make less frequent but significantly longer trips than visitors to traditional grocery stores. In Q3 2024, the average visit duration at Joe V’s was 37.8 minutes, compared to just 26.8 minutes at H-E-B – a full 11 minute difference. At the same time, while 38.5% of Q3 visits to H-E-B were made by customers frequenting the chain, on average, at least four times a month, just 11.8% of visits to Joe V’s were made by visitors reaching that threshold.
Joe V’s is also more likely than H-E-B to attract parental households, with 36.8% of its captured market made up of households with children – significantly higher than H-E-B’s 32.0%.
Together, these data points paint a picture of the average Joe V’s shopper: cost-conscious, likely to have children, and inclined to carefully plan shopping trips to maximize savings and cut down on grocery runs. This suggests that they are mission-driven and focused on stocking up rather than running out to grab ingredients as the need arises.
Hy-Vee Reaches Broader Customer Base With Dollar Fresh
Major grocery store operators often operate a variety of store types at different price points to appeal to as many shoppers as possible, and Hy-Vee is no exception. The regional grocery favorite launched a discount chain, Dollar Fresh, in 2018 and currently operates 25 stores under that banner, aiming to attract middle-class, cost-conscious shoppers.
Using Experian’s Mosaic dataset to analyze Dollar Fresh’s trade area reveals that the chain’s captured market features significantly higher shares of lower-middle-class family consumers than its potential one – highlighting its special draw for these shoppers. (A chain’s potential market is obtained by weighting each Census Block Group (CBG) in its trade area according to population size, thus reflecting the overall makeup of the chain’s trade area. A business’ captured market, on the other hand, is obtained by weighting each CBG according to its share of visits to the chain in question – and thus represents the profile of its actual visitor base. Comparing a chain’s captured market to its potential one can serve as a helpful gauge of the brand’s success at attracting key audience segments.)
In Q3 2024, the “Pastoral Pride” family segment represented 11.4% of Dollar Fresh’s captured market, compared to just 5.3% of its potential market. This over-representation of lower-middle-class consumers from small towns in Dollar Fresh’s captured market indicates that the chain is especially effective at drawing customers that belong to this segment. Though Hy-Vee’s captured market also boasted a higher share of this demographic than its potential one in Q3, the difference was much smaller – and the chain’s overall reach among these consumers was more limited.
In contrast, Hy-Vee excels at attracting “Flourishing Families” – affluent, middle-aged families and couples – who made up 10.3% of the supermarket’s captured market in Q3 2024. Dollar Fresh’s captured market, on the other hand, featured a smaller share of this segment than its potential one – showing that the discount chain is of less interest to these consumers. So while Hy-Vee tends to appeal to higher-income families with more spending flexibility, value-conscious shoppers have been making their way to Dollar Fresh.
This audience segmentation analysis shows how value offerings help grocery chains attract wider audiences – and highlights the advantage of operating multiple store types to appeal to a broader range of shoppers.
Grocery Stores at a Crossroads
People will always need access to a variety of fresh foods – ensuring that grocery stores and supermarkets continue to play a vital role in in the retail landscape. And while the category as a whole has continued to thrive even in today’s challenging environment, specialty and value grocery chains resonate particularly strongly with the 2024 consumer. As grocery retailers diversify their formats, those aligning with consumer preferences for affordability, uniqueness, and quality are well-positioned for continued growth.


.svg)