Lessons from the 2024 Holiday Season
The holiday shopping season traditionally stretches from Black Friday to New Years Eve: Shoppers looking to snag deals, purchase gifts, or enhance their celebrations drive visit spikes at retailers across the country. And although many consumers expressed concern over high prices impacting their holiday budget, spending in 2024 actually increased compared to 2023, with brick-and-mortar stores playing a key role in last year’s holiday season.
So where were the largest holiday spikes? How did last year’s calendar configuration impact retail traffic? Which segment came out ahead – and how did dining fit into the mix? Most importantly – what can we learn from the 2024 holiday season to prepare for 2025?
Apparel, Recreation, and Entertainment Segments Receive Largest Holiday Boost
The holiday shopping season is the busiest time of the year for many retail categories. Between Black Friday and December 31st 2024, daily visits to brick-and-mortar stores increased 12.7%, on average, compared to the rest of the year.
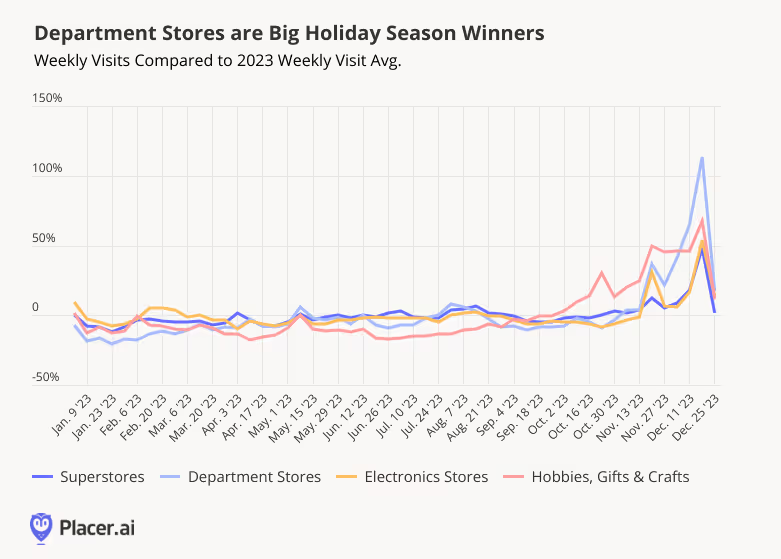
Department stores led the pack, with visits to the segment 102.1% higher than the pre-holiday season average – likely aided by strong Black Friday performances. Other favorite gifting categories, including beauty & self care (72.7%), hobbies, gifts & crafts (60.9%), recreational & sporting goods (55.5%), clothing (41.8%), and electronics stores (32.7%) also received significant traffic boosts. Shopping centers benefited as well with a 24.8% increase in daily visits over the holiday season. Retailers in these segments can capitalize on their holiday popularity and stand out amidst the crowd by promoting their brand early and ensuring their staffing and inventory can accommodate the season’s traffic increases.
The holidays are also a time for entertainment – and purchasing gifts for hosts – which likely helped drive the 48.4% and 41.7% traffic increases at liquor stores and at furniture & home furnishings retailers, respectively. Superstores and discount & dollar stores – with their selection of affordable giftable products and entertainment essentials – also saw holiday-driven visit bumps of 21.2% and 20.2%, respectively. Retailers may choose to highlight seasonal items and hosting-friendly products to increase these traffic bumps in 2025.
Pet stores & services received a smaller (10.0%) bump than the wider retail average – indicating that, although some shoppers buy gifts for their fur babies, pets may not be at the top of most Americans’ gift lists. And visits to the home improvement segment were essentially on par with the pre-holiday period – indicating that the holidays are not the time for extensive home renovation projects. But home improvement chains looking to get in on the holiday action might consider promoting decorations and smaller giftable items in December.
And despite the grocery frenzy of Turkey Wednesday and Christmas Eve Eve, the Grocery segment received a relatively minor holiday boost of 5.0% – perhaps due to holiday travelers skipping their weekly grocery haul. Grocers who lean into prepared foods or pre-packaged meal kits might get an additional bump.
Holiday Shopping Most Impactful in the South
Although the holidays drive retail visit surges across the country, some regions see a bigger traffic bump than others.
In December 2024, almost all 50 states (with the exception of Wyoming ) received a holiday-driven retail traffic boost ranging from a 3.3% (Montana) to a 16.8% (New Hampshire). On a regional basis, the South received the largest increase: The West South Central, East South Central, and South Atlantic divisions received a collective 12.2% increase in daily visits between Black Friday and New Years Eve compared to the pre-Black Friday daily average. (Washington, D.C. saw a slight visit decline of 0.4%, likely due to the many residents leaving the capital for the holiday break.) Retailers in this region may choose to increase staffing and inventory ahead of the 2025 holiday season to handle the increased demand.
Meanwhile, the Midwest region had the smallest holiday-driven traffic spike (9.2%) – despite starting the season ahead of the pack, with the highest Black Friday weekend visit boost. This suggests that Midwestern retailers may have more success with early promotions than with last-minute discounts.
Different Retail Segments Peak on Different Milestones
While the holiday season drove an overall retail visit boost nationwide, diving deeper into the data reveals that different retail segments peak at different points of the holiday season.
Most categories – especially the ones that tend to offer steep post-Thanksgiving discounts, such as recreational & sporting goods, department stores, electronics stores, and beauty retailers – received the biggest visit spikes on Black Friday. Retailers in these categories may benefit from promotional campaigns ahead of Thanksgiving to cater to early shoppers and maximize their performance on their busiest day.
Other segments that carry more affordable gifts, stocking stuffers, and food items gained momentum as Christmas approached – with superstores visits spiking on December 23rd and discount & dollar stores peaking on December 24th. These retailers may get even larger end-of-year visit bumps by offering discounts and bundles to last-minute shoppers.
The grocery segment received its largest boost ahead of Thanksgiving, with visits also surging on the days before Christmas as home cooks picked up supplies for the holiday dinner. Grocers who can save their shoppers time during this busy period by offering curbside pickup, pre-prepped ingredients or meal kits, and other conveniences may see particularly strong performances in 2025.
Calendar Shift Highlighted Different Shopping Patterns at Different Chains
Calendar shifts also play an important role in shaping holiday shopping patterns. Last year, Super Saturday and “Christmas Eve Eve” – each a significant milestone in its own right – coincided on December 23rd, 2023 to create a supercharged shopping event that generated massive visit spikes at retailers across categories.
But in 2024, when the milestones occurred separately, important differences emerged between retailers. Gift-shopping destinations like Macy’s, Nordstrom, and Best Buy saw bigger visit spikes on Super Saturday, while retailers like Target, Walmart, and Costco – carrying both gifts and food items – saw visits surge higher on December 23rd. Dollar Tree, a prime destination for affordable stocking stuffers, also experienced a more pronounced visit spike on Super Saturday.
Predictably, this year’s pre-Christmas milestones generally drove smaller individual visit spikes, as shoppers spread their errands across a longer period. But the stand-alone Super Saturday on December 21st 2024 also allowed consumers to prioritize gift-shopping on Saturday and shop for groceries and last minute stocking stuffers on December 23rd – benefiting certain retailers.
Nordstrom, for instance, saw visits soar to 215.9% above the chain’s 2024 daily average on December 21, 2024 – surpassing the 196.2% increase recorded on December 23, 2023. Macy’s also experienced a slightly higher Super Saturday visit boost this year. Next year, retailers can expect another spread-out pre-Christmas shopping period, with Super Saturday falling on December 20th, 2025 – five days before the holiday. Gift-focused retailers can leverage this timing by ramping up promotions in the run-up to Super Saturday – or by enhancing offerings on December 23rd to capture more late-season shoppers.
Big box retailers like Target, Walmart, and Costco, conversely, can double down on December 23rd or amplify earlier deals to capture a larger share of Super Saturday traffic. And retailers across categories can benefit from the more extended last-minute shopping period by implementing multi-day sales and promotions that encourage repeat visits and drive traffic throughout the week.
Traditional Grocers Surge on Turkey Wednesday, Liquor Stores and Ethnic Grocers Peak Before Christmas
Turkey Wednesday – the day before Thanksgiving – is traditionally the grocery sector’s time to shine. And this year didn’t disappoint: On November 27th, 2024, visits to traditional grocery mainstays like Kroger, Safeway, and H-E-B shot up by a remarkable 66.9% to 79.2% compared to the 2024 daily average. And on December 23rd, foot traffic to the chains rose once again, though somewhat more moderately, as shoppers geared up for Christmas celebrations.
But the holiday season stock-up, it turns out, is about more than just food. Whether to help smooth out the rough edges of family interactions or to take celebrations to the next level, consumers also make pre-holiday runs to liquor stores. On Turkey Wednesday, leading spirit purveyors outperformed traditional grocery stores with epic 140.1% to 236.5% visit spikes. And the day before Christmas Eve was an even bigger milestone for the segment, with foot traffic skyrocketing by a staggering 153.6% to 283.8% above daily averages.
Ethnic supermarkets – chains like El Super and Vallarta Supermarket – also thrived on these traditional pre-holiday grocery store milestones. But like liquor stores, they saw bigger visit spikes on December 23rd, as customers likely sought out ingredients for their festive holiday dinners.
Grocery stores seeking to maximize the power of these pre-holiday milestones in 2025 could enhance their liquor selections and launch targeted promotions in the lead-up to both Thanksgiving and Christmas.
Holidays Boost Dining Traffic
Dining venues are also impacted by the rhythms of the holiday season – but each segment within the dining industry follows its own unique seasonal trajectory.
Visits to the fast-casual, coffee, and fine-dining segments increased the week before Thanksgiving, with fast-casual and coffee visits peaking on Wednesday and fine-dining peaking on Thanksgiving day. Both coffee and fine-dining chains also received a small traffic bump on Black Friday, with coffee traffic likely aided by consumers looking to refuel during their shopping.
But beginning in mid-December, the fine-dining category pulled ahead of the other dining segments, picking up steam as the month wore on before peaking on December 23rd and 24th. And while traffic predictably declined on Christmas Day, the drop was less pronounced than for the other analyzed segments. Fine dining then resumed its strong showing on December 26th, maintaining elevated visits through the following days, potentially reflecting its appeal as a festive holiday dining destination for families.
Coffee chains and fast-casual restaurants also enjoyed moderately elevated December traffic, with smaller visit spikes on December 23rd. Traffic to both segments then slowed during the holiday – though coffee chains continued to see higher-than-average foot traffic on Christmas Eve – before tapering off as the month drew to a close.
Looking ahead to 2025, each dining segment can take steps to maximize its holiday impact. Fine dining chains can attract more special-occasion celebrants with unique holiday-themed menu items – paired with targeted promotions that make its premium offerings more accessible to families. Meanwhile, fast-casual and coffee chains can capitalize on high-traffic days like December 23rd by catering to the needs of busy holiday shoppers – extending operating hours and offering streamlined ordering and pickup options.
Looking Ahead to 2025
The 2024 holiday season proved strong for most retail categories, with each retail category displaying a different holiday visit pattern. This year’s calendar layout also presented a unique advantage, with a longer stretch between Super Saturday and Christmas compared to last year.
By analyzing 2024 holiday regional visit trends, understanding the role that each year’s specific calendar configuration plays in shaping consumer behavior, and identifying the unique retail milestones for each chain and category, retail and dining stakeholders can refine their strategies and make the most of the 2025 holiday season.


.svg)