Strategy is Everything
The full-service dining segment has experienced its fair share of challenges over the past few years, with pandemic-era closures, rising food and labor costs, and cutbacks in discretionary spending contributing to visit lags. In 2024, visits were down 0.2% year over year (YoY) and remained 8.4% below 2019 levels – a reflection of the significant number of venues that permanently closed over COVID and a testament to the industry's ongoing struggle to regain its pre-pandemic footing.
Yet, even in a difficult environment, some full-service restaurant (FSR) chains are thriving. These brands aren’t waiting for the industry to rebound – they're becoming trendsetters in their own right, proving that stand-out strategy is everything in a challenging market.
This white paper explores brands that are harnessing three key differentiators – fixed-price value offerings, elevated social experiences, and a laser focus on product – to drive full-service dining success in 2025.
Fixed-Price Value Models
One of the most defining trends over the past few years has been the unrelenting march of price increases. And as consumers continue to seek out ways to save, some chains are staying ahead of the pack with fixed-price value offerings that help diners squeeze out the very best bang for their buck.
A Golden Opportunity: All You Can Eat at Golden Corral
Golden Corral, the all-you-can-eat buffet chain that lets kids under three eat for free, is one FSR that is benefiting from consumers’ current value orientation. Despite closing several locations in 2024, overall visits to the chain still tracked closely with 2023 levels, declining by just 0.5% – while the average number visits to each Golden Corral restaurant grew 3.8% YoY.
Golden Corral’s value proposition is resonating strongly with budget-conscious Americans eager to enjoy a wide variety of comfort foods at an affordable price. The chain’s visitors tend to come from trade areas with lower median household incomes (HHIs) than traditional full-service restaurant (FSR) diners. And these patrons are willing to travel to enjoy the chain’s value buffet offerings, many of which are situated in rural areas and may require a longer drive. In 2024, 25.2% of Golden Corral’s diners came from over 30 miles away – compared to just 19.2% for the wider FSR segment.
Golden Corral’s continued flourishing proves that in an era of rising costs, diners are willing to go the extra mile (literally) for a restaurant that delivers both quality and affordability.
(Nearly) All-You-Can-Play at Chuck E. Cheese
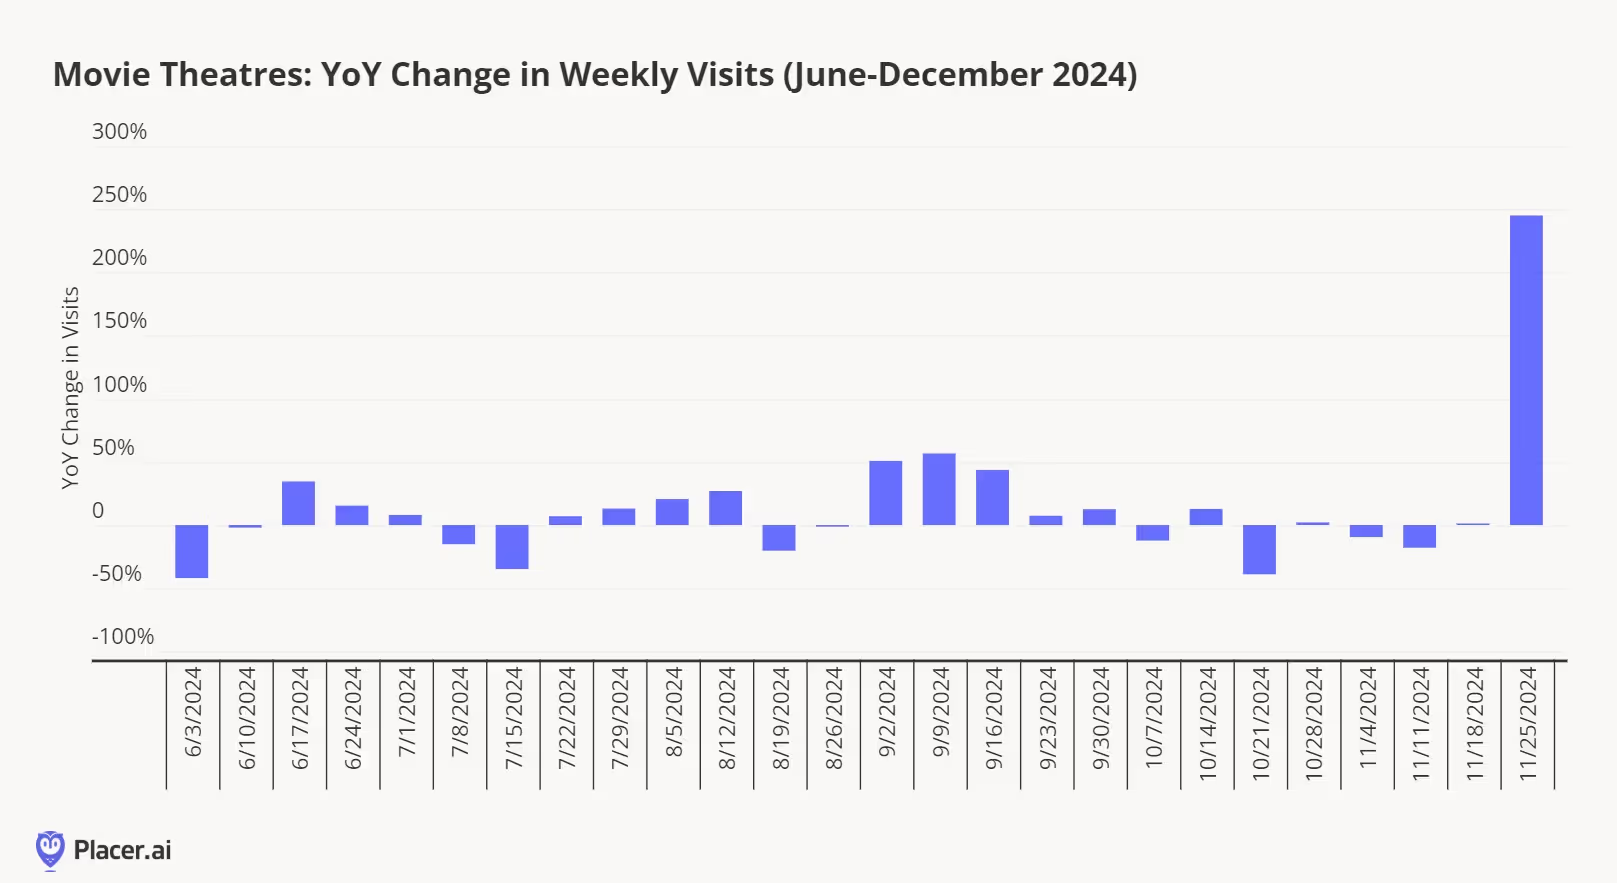
Children’s party space and eatertainment destination Chuck E. Cheese has had a transformative few years. Following the retirement of its iconic animatronic band, the chain shifted its focus to a new membership model, announcing a revamped Summer of Fun pass in May 2024 – including unlimited visits over a two-month period, steep discounts on food, and up to 250 games per day. The pass proved incredibly popular, with YoY visits surging by 15.6% in May 2024, when the offer launched – a sharp turnaround from the YoY visit declines of the previous months. Recognizing the strong demand, Chuck E. Cheese extended the program year-round – and the strategy has paid off as YoY visits remained positive through the end of 2024.
Fun With Repeat Visitors
A closer look at the data suggests that parents are making full use of their unlimited passes: The share of weekday visits was higher in H2 2024 than in H2 2023, likely due to families using their passes for weekday entertainment rather than reserving visits for weekends and special occasions.
At the same time, the share of repeat visitors – those frequenting the chain at least twice a month – also grew. Although these repeat visitors may not purchase additional gameplay beyond the flat fee, their more frequent on-site presence likely translates into increased sales of pizza and other menu items.
Next-Level Social Experiences
While value has been a major motivator for restaurant-goers in recent years, low prices aren’t the only drivers of FSR success. Brands offering unique experiences aimed at maximizing social interaction are also seeing outsized gains.
Though many of these more innovative venues tend to be on the more expensive side, they draw enthusiastic crowds willing to pony up for concepts that combine good food with fun social occasions. And some of the more successful ones bolster perceived value through offerings like fixed-price menus or club memberships.
KPOT: Food, Friends, and Fun
Korean cuisine has been on the rise in recent years, with restaurants like Bonchon Chicken and GEN Korean BBQ House making significant waves in the dining space. Another chain drawing attention is KPOT Korean BBQ and Hot Pot, which began modestly in 2018 and has since expanded to over 150 locations nationwide.
Diners at KPOT can customize their meals by selecting from a variety of proteins, broths, sauces, and side dishes, known as banchan, while barbecuing or cooking in a hotpot at their table and sipping on the drinks from the menu’s extensive selection. And though pricier than Golden Corral, KPOT also offers an all-you-can-eat experience that lets customers squeeze the most value out of their indulgence.
Location intelligence shows that KPOT’s experiential dining model is resonating with customers: Since Q4 2019, the average number of visits to each KPOT location has risen steadily – even as the chain has grown its footprint – while the average dwell time has also increased. Indeed, rather than a quick dining stop, KPOT has become a destination for guests to linger, enjoying both food and drinks – and an interactive and social experience.
Wine-Not Have a Drink
By positioning themselves as gathering places for fine wine aficionados, wine-club-focused concepts such as Postino WineCafe and Cooper’s Hawk Winery are also benefiting from today’s consumers’ emphasis on social experiences. The two upscale dining destinations offer club memberships that combine periodic wine releases with a variety of perks.
And the data suggests that the model is strongly resonating with diners. Both Postino and Cooper’s Hawk have grown their footprints over the past year, driving substantial YoY chain-wide visit increases while average visits per location grew as well – showing that the expansions and experiential offerings are meeting robust demand.
And analyzing the two chains’ captured markets shows that the wine club model enjoys broad appeal across a variety of audience segments.
Unsurprisingly, both wine clubs’ visitor bases include higher-than-average shares of affluent consumers with money to spend, including Experian: Mosaic’s “Power Elite”, “Booming with Confidence”, and “Flourishing Families” segments (the nation’s wealthiest families, as well as affluent suburban and middle-aged households). But the two chains also attract younger, more budget-conscious consumers – Postino, which has many downtown locations, is popular among “Singles and Starters”, while Cooper’s Hawk is popular among “Promising Families” - i.e. young couples with children.
The success of the two brands across various segments underscores the impact of a distinctive experience – especially when paired with a loyalty-boosting membership – in attracting today’s consumers.
Laser Focus on Food and Ambiance
Value offerings and unique experiences have the power to drive restaurant visits – but ultimately, a good meal in an inviting atmosphere is a draw in and of itself, as is shown by the success of First Watch and Firebirds Wood Fired Grill.
Seasonal Menus, Leisurely Brunches
Breakfast-only restaurant First Watch excels at ambiance and menu innovation, changing up its offerings five times a year and striving to maintain a neighborhood feel at each of its locations.
First Watch has made a point of leaning into its strengths, eschewing discounts in favor of a consistently elevated dining experience and doubling down its strongest day part (weekend brunch), rather than trying to artificially drive up interest at other times.
And the strategy appears to be working: In 2024, visits to First Watch increased 6.6% YoY – with Saturdays and Sundays between 11:00 A.M. and 1:00 P.M. remaining its busiest dayparts by far. Visitors to First Watch also tend to linger over their meals more than at other breakfast chains – in 2024, the restaurant experienced an average dwell time of 54.9 minutes, significantly longer than the 48.7-minute average at other breakfast-focused restaurants.
By focusing on what matters most to its diners – innovative and exciting food and a welcoming atmosphere that allows patrons to enjoy their meals at a leisurely pace – First Watch is continuing to flourish.
Firing Up Interest In Dining Out
Another chain that is growing its footprint and its audience on the strength of a menu and ambiance-focused approach is Firebirds Wood Fired Grill. The chain, known for its “polished casual” vibe and bold, unique flavors, added several new restaurants last year, leading to a 6.5% increase in overall visits. Over the same period, the average number of visits to each Firebirds location held steady – showing that the new restaurants aren’t cannibalizing existing business.
The chain’s success may rest, in part, on its locating its venues in areas rife with enthusiastic foodies. Data from Spatial.ai’s FollowGraph shows that in 2024, Firebird’s trade areas had significantly higher shares of “BBQ Lovers”, “Gourmet Burger Lovers,” and “Foodies” than the nationwide average. This suggests that Firebirds is attracting diners who prioritize the experience of eating – key for a chain that prides itself on putting good food first. The chain is also known for its welcoming decor and design – another aspect that may lead to its strong visit success.
Put That On Your Plate
Necessity often serves as the mother of invention, and challenging economic periods continue to spark new trends and innovations in the dining scene. From a heightened focus on value – drawing families and lower-HHI consumers willing to travel for a good deal – to the growing appeal of social dining and the timeless draw of good food – new trends are emerging to meet changing consumer expectations.


.svg)