


Choosing the Right Foot Traffic Data Interface
Foot traffic data has become the offline equivalent of website analytics – providing critical visibility into where people go in the real world. By leveraging location analytics, professionals across industries can gain unprecedented insight into brick-and-mortar consumer behavior. These insights reveal which stores people visit, the restaurants they prefer, and the duration of their stay at different locations.
This data is essential for retailers, consumer packaged goods (CPG) companies, and investors looking to optimize their business strategies. For many, the most accessible route to these insights is a location intelligence platform with a user-friendly User Interface (UI). However, for organizations with advanced data needs, a foot traffic API (Application Programming Interface) is often the superior choice.
In this guide, we will explore the distinct advantages of each option and help you determine the right solution for your analytical needs.
What is a Foot Traffic API?
To understand the value of an API, it is helpful to contrast it with a standard foot traffic UI. A Foot Traffic UI allows users – even those with minimal technical expertise – to view, manipulate, and analyze data directly on the provider's platform. This "self-serve" model is excellent for generating quick reports, visualizing heat maps, or running specific analyses on a chain or point of interest (POI).
A Foot Traffic API, on the other hand, allows users to integrate the raw data directly into their own business intelligence (BI) applications. Instead of logging into a separate dashboard, the data is programmatically fed into your internal systems. This allows for the seamless combination of foot traffic metrics with first-party data – such as sales figures or inventory levels – to facilitate custom reporting and support complex decision-making.
The Case for a Location Intelligence UI
For many professionals, a platform with a built-in UI offers the fastest path to insights.
- User-Friendly: Intuitive interfaces allow non-technical teams (like marketing or real estate) to conduct sophisticated analyses without needing data scientists.
- Geospatial Layering: Top-tier platforms allow users to layer additional datasets – such as local traffic infrastructure, crime statistics, or demographic trends – on top of visitation data. This context is crucial for understanding the "why" behind the traffic.
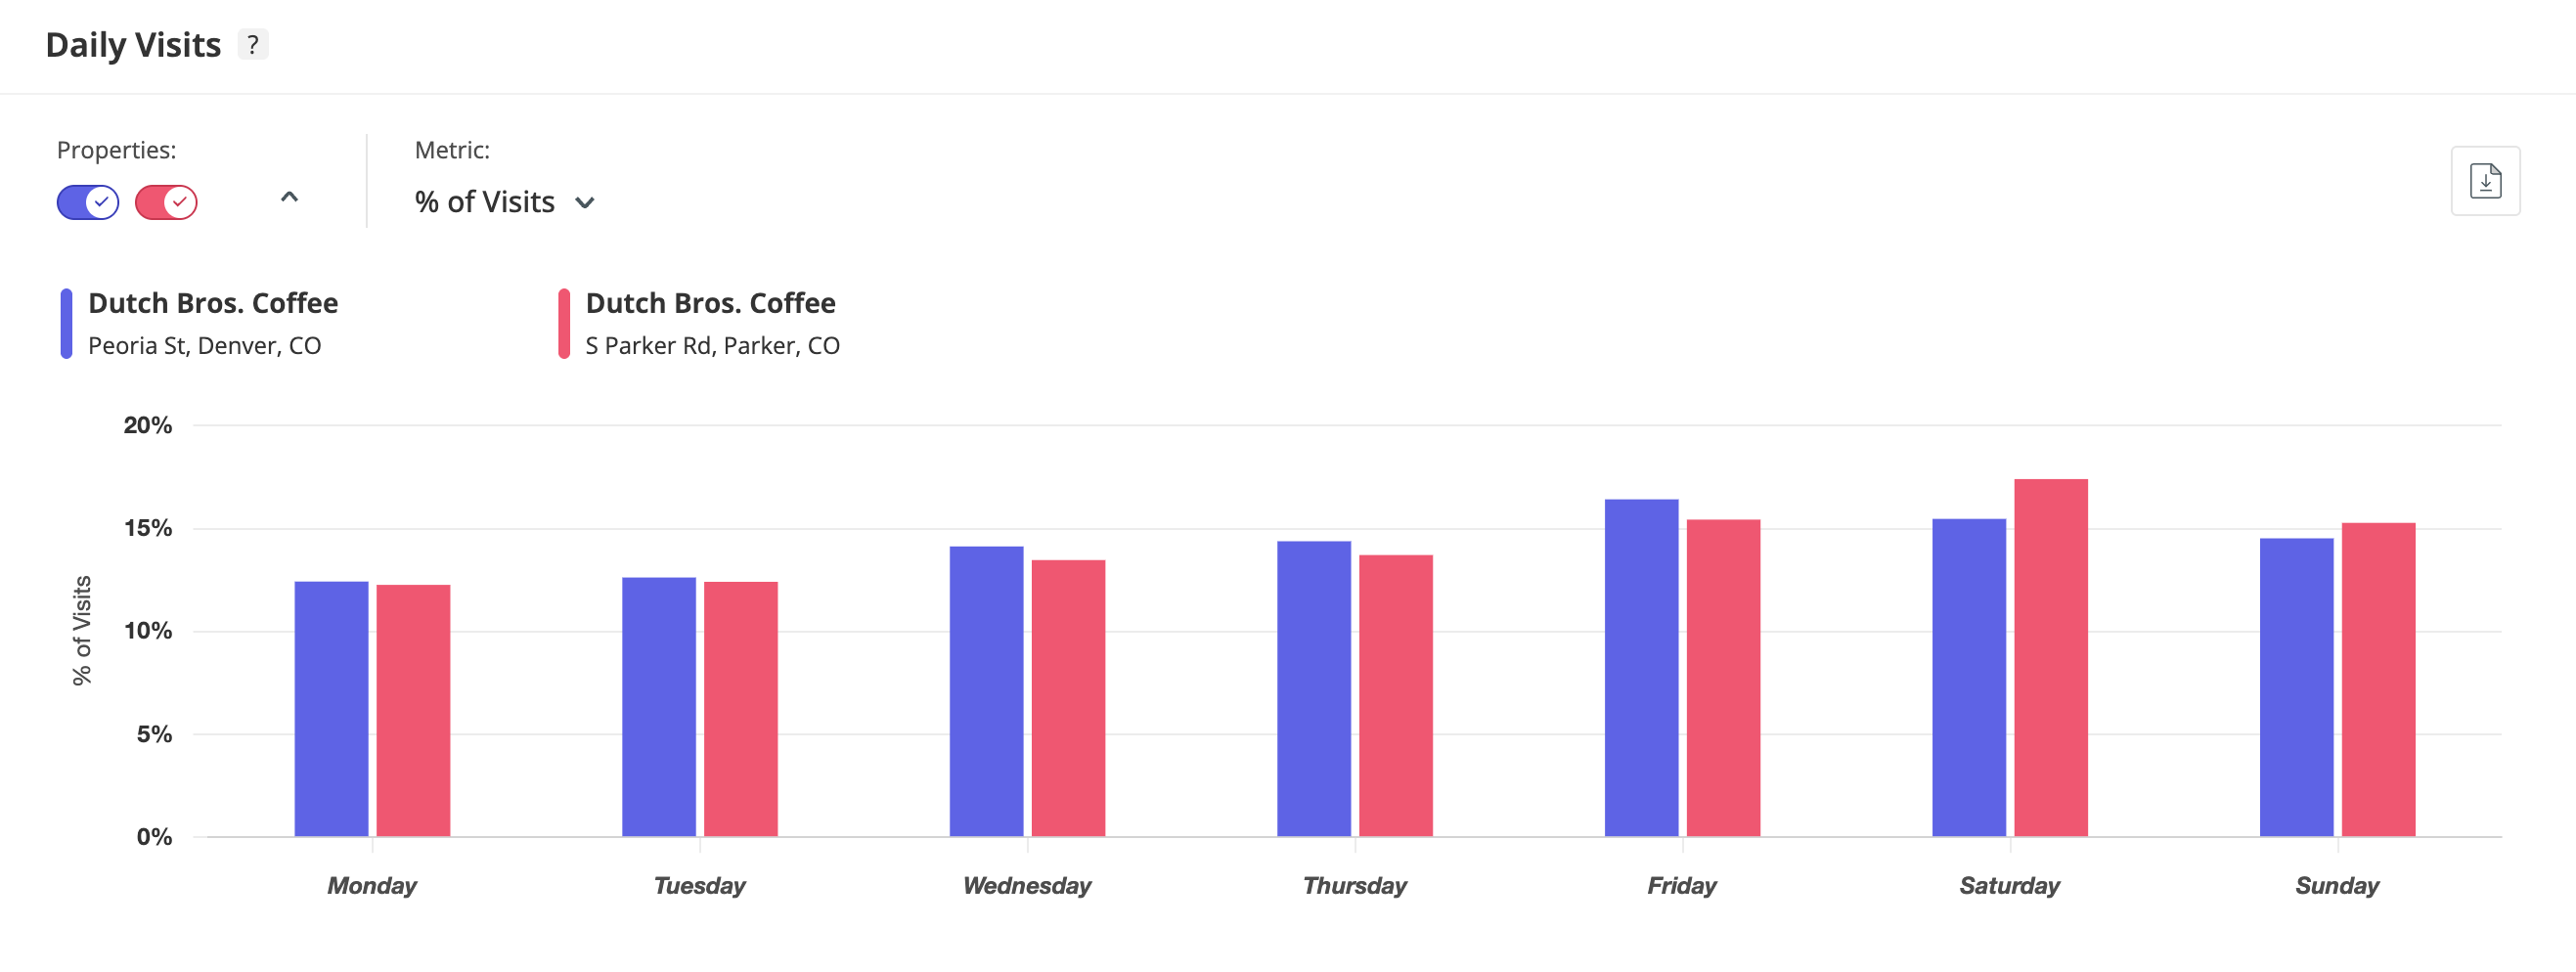
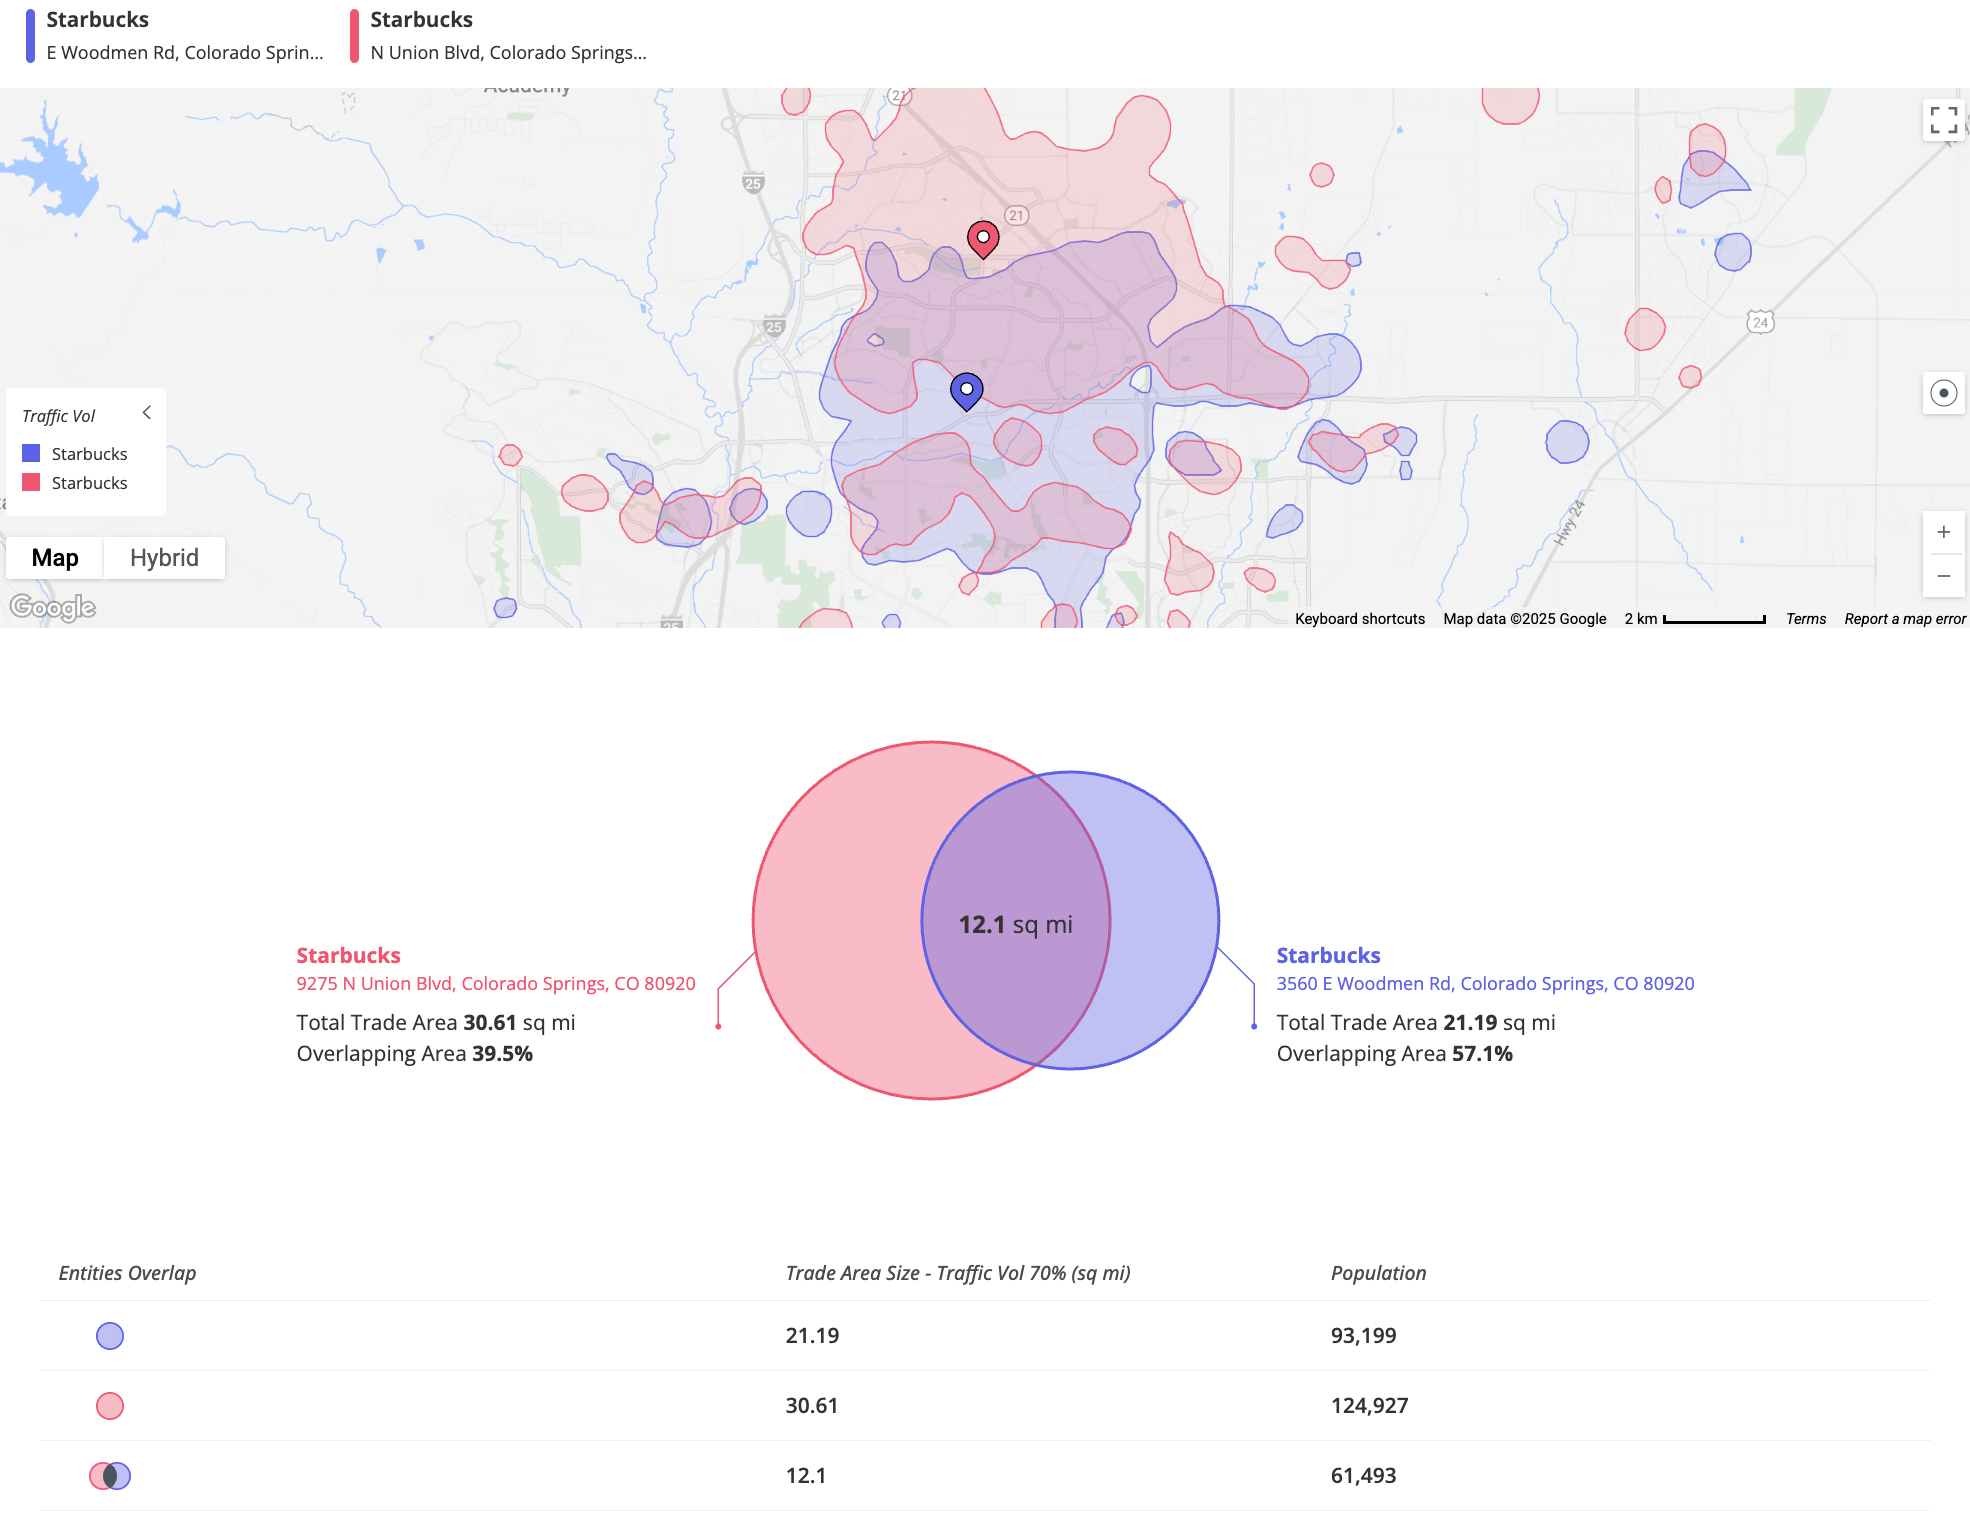
- Instant Visualization: Users can generate heat maps and trade area visualizations with a single click, making it easy to present findings to stakeholders.
The Case for a Foot Traffic API
For companies with in-house data science teams or those needing to analyze data at a massive scale, an API offers an integrated experience that has advantages over a UI.
- Seamless Integration and "Single Source of Truth": An API allows third-party foot traffic data to be incorporated into existing platforms. By feeding this data into a central executive dashboard, a "single source of truth" is created, where offline visitation patterns sit side-by-side with online engagement and sales revenue. This integration is critical for modern "omnichannel" strategies, where connecting digital and physical touchpoints is key.
- Scale and Efficiency: While a UI is great for analyzing a few dozen locations, it can become cumbersome when analyzing thousands. An API enables executives to simultaneously access and process data for huge numbers of entities. Automated periodic reporting saves time and drastically reduces the risk of human error associated with manual data entry.
- Customizability: Analytics professionals often need to slice and dice data in ways that pre-built dashboards do not support. An API delivers the raw materials needed to build custom reports and visualizations that align perfectly with an organization’s specific KPIs.
For many companies, a solution that combines the capabilities of a platform’s own user interface with the flexibility of an API offers the best of both worlds.
Foot Traffic APIs in Action
What does this integration look like in practice? Here is how different industries are leveraging APIs to gain a competitive edge.
Investors and Financial Firms
Investors use foot traffic APIs to integrate physical visitation patterns into their risk analysis and predictive models.
- Spot Demand Signals: By feeding this "alternative data" into proprietary algorithms, firms can spot trends before they appear in quarterly earnings reports – such as a dip in customer visits weeks before a revenue miss is announced.
- Scale Investment Thesis: An API allows investors to conduct bulk analyses of hundreds of potential investment targets at once to hone in on the best opportunities.
Retailers
Retailers utilize APIs to ingest data for thousands of store locations to refine site selection and performance monitoring.
- Conversion Analysis: By combining foot traffic (potential customers) with point-of-sale data (actual purchases) in one BI tool, retailers can accurately calculate conversion rates. This reveals if a drop in sales is due to low traffic (marketing issue) or low conversion (inventory/pricing issue).
- Unified Customer Journey: Integrating online and offline traffic metrics allows retailers to see the full picture of their customer marketing funnel. This visibility into the customer journey highlights the different ways customers interact with a brand – helping answer whether online campaigns drive physical visits, or if a new location correlates with a rise in online sales.
CPG Companies
For Consumer Packaged Goods companies, the challenge is visibility – they sell products in stores they do not own.
- Market Optimization: An API allows CPG brands to extract visitation data for thousands of retail partners simultaneously. This helps them monitor how their retail partners are performing and identify which markets have the right demographic fit for their products.
- Merchandising: By integrating local foot traffic trends into their models, CPGs can tailor their inventory to match the specific tastes of the local consumer base rather than using a "one size fits all" strategy.
The Placer.ai Foot Traffic API Solution
For organizations ready to take the next step in data integration, Placer.ai offers a robust Foot Traffic API add-on. This solution allows companies to extract Placer’s rich location intelligence data for use in any internal or third-party application.
Whether you are an investor looking to feed a predictive model, or a retailer aiming to unify your data streams, the Placer.ai API provides the flexibility to enrich, filter, and combine analytics to suit your unique business needs.
Placer.ai leverages a panel of tens of millions of devices and utilizes machine learning to make estimations for visits to locations across the US. The data is trusted by thousands of industry leaders who leverage Placer.ai for insights into foot traffic, demographic breakdowns, retail sale predictions, migration trends, site selection, and more.
Key Takeaways
- Offline Analytics: Foot traffic data serves as the physical world equivalent of website analytics, providing critical insights into consumer behavior, dwell time, and cross-shopping patterns for brick-and-mortar locations.
- UI vs. API: A location intelligence User Interface (UI) is best for quick, visual analysis and non-technical teams, while an API is designed for data science teams requiring automated, bulk access to data.
- Unified Intelligence: The primary advantage of an API is the ability to integrate offline visitation data with internal first-party data (sales, inventory, marketing spend). This creates a "single source of truth" for more accurate omnichannel decision-making.
- Scalability: For large enterprises, an API enables the programmatic processing of thousands of locations simultaneously, significantly reducing the manual effort required for reporting and site selection.
- Industry Application: From retailers optimizing conversion rates to investors forecasting revenue before earnings calls, integrating foot traffic data via API allows professionals to build custom predictive models that standard dashboards cannot support.

