


.svg)


Retail Traffic Up Slightly Compared to 2024
Despite the ongoing macroeconomic uncertainties, overall retail traffic this year has remained generally on par with 2024 levels. Between January and May 2025, retail visits were 0.4% higher than for the equivalent period in 2024, with April and May 2025 visits up 2.3% and 1.3%, respectively.
Some of the recent strength may be attributed to a pull-forward of consumer demand as a response to potential price hikes and limited product availability. But the strongest year-over-year (YoY) visit increase in 2025 so far was actually in January – when visits were up 3.4% compared to January 2024 – highlighting the resilience of retail consumers in 2025 and boding well for the upcoming back to school season.
Regional Disparities in Retail Foot Traffic Trends
Diving into YoY May 2025 retail visit data by state suggests that back to school performance may be particularly strong in the West: Retail traffic in Oregon, Washington, Idaho, and Montana was 3.0% to 5.1% higher than in May 2024, while Utah's retail chains received a 5.0% YoY boost in traffic. Consumers in these states may be particularly primed to spend this summer.
Meanwhile, several Eastern states (Ohio, New York, Mississippi, Alabama, and Georgia) saw YoY declines in May 2025 retail visits, perhaps suggesting that consumer confidence in those states is slightly more muted. This may indicate that back to school retail traffic will be slightly weaker in these markets.
Which Categories Will Replicate Their 2024 Back to School Success?
Last year, sportswear & athleisure and footwear retailers saw the largest back to school visit jumps, followed by office supplies and traditional apparel (excluding off-price, department stores, and sportswear & athleisure). These segments all saw slight visit increases in May 2025 and are likely to continue seeing sizable traffic spikes for back to school season this year.
But looking at the visit data from April and March reveals that the retail categories seeing the strongest visit trends currently are the segments that get a slightly smaller boost from back to school – including furniture & home furnishings, off-price retailers, and thrift stores. Some of this strength may be attributed to pull-forward of demand (as consumers could have bought larger ticket items like furniture in anticipation of price hikes) or to shoppers' value-orientation (driving visits up for off-price and thrift stores). But these categories' recent success may also suggest that home furnishings, off-price apparel, and thrift stores could see higher volumes of consumer traffic this year compared to 2024.
Looking Ahead at Back to School 2025
Ahead of the 2025 back to school season, retail traffic data paints the picture of a generally resilient consumer, despite the regional variability. And while last year's big back to school winners will likely perform well again in 2025, more secondary back to school categories – including home furnishings, off-price, and thrift stores – may be the ones to come out on top this year.
For more data-driven retail insights, visit placer.ai/anchor.
Muted Office Traffic in May 2025:
Following a strong April when nationwide office visits rose 4.8% year-over-year, visits fell slightly in May 2025 as traffic fell 1.0% compared to May 2024. On a year-over-six-year basis (Yo6Y, or compared to 2019), visits were down 37.2% – a steep drop from April's 30.1% Yo6Y visit gap.
The weaker May numbers may be partially driven by a calendar shift, as May 2025 had an extra Saturday, and therefore one less workday, than either May 2024 or May 2019. Americans may have also chosen to take more PTO around Memorial Day this year – according to the TSA, airports were busier on the Friday before Memorial Day 2025 than they were on Friday, May 24th 2024.
But the muted May office data also highlights the persistent popularity of hybrid and remote work. According to Gallup, over half of U.S. employees work hybrid while over a quarter are fully remote – and the recent May data suggests that these work arrangements are proving difficult to change.
New York, Miami, and Southern Hubs Lead May 2025 Office Recovery
Diving into the market-level data reveals that New York City, NY and Miami, FL continue to lead the pack, with office visits down 18.4% and 19.6%, respectively, compared to 2019. But both cities also saw slight declines compared to May 2024's office numbers – highlighting once again the persistence of the new work arrangements and the overall slowing of the office recovery.
Southern hubs – specifically Atlanta, GA, Dallas, TX, and Houston, TX – followed New York and Miami, with visits down 32.1%, 35.5%, and 36.2% compared to May 2019. Dallas and Houston also saw their office visits increase compared to 2024, with Houston specifically seeing an 8.3% increase in YoY office visits, perhaps aided by corporate relocations to the two cities. Georgia and Texas also saw their populations increase in recent years, which may be contributing to these cities' office performance.
Meanwhile, the Yo6Y office visit gap in Washington, D.C., Boston, MA, Los Angeles, CA, Chicago, IL, Denver, CO, and San Francisco, CA ranged from 40.1% to 50.6%, with all the cities except for Boston also experiencing YoY declines.
Plateaued Office Recovery
The May 2025 Placer.ai Office Index highlights a persistent plateau in office recovery. While some regional bright spots exist, the return to pre-pandemic office traffic remains elusive, largely due to the enduring popularity of hybrid and remote work models.
For more data-driven commercial real estate insights, visit placer.ai/anchor.
Memorial Day – the unofficial start of the summer season – is typically accompanied by major retail promotions and movie releases. We dove into the visit data to see how consumers celebrated the holiday and see how brick-and-mortar retail traffic compared to last year's numbers.
Memorial Day Boosted Retail Visits – But Traffic Stayed Flat Compared to 2024
Memorial Day weekend brought a visit boost to retail chains nationwide, with the holiday's impact already felt on Friday, May 23rd 2025 as traffic spiked 10.0% compared to the YTD (January 1st to May 26th) Friday average. But comparing the data with last year's numbers shows that year-over-year (YoY) visits remained essentially flat.
Critically, this stability in Memorial Day week retail visits follows several weeks of year-over-year (YoY) traffic increases, likely due to consumer pull-forward of demand. So the fact that consumers still came out to shop Memorial Day sales – even after weeks of increased activity – suggests that brick-and-mortar retail remains resilient despite the wider macroeconomic shifts.
Apparel Visits Spike – But Not All Categories See YoY Increase
Diving into the apparel industry reveals that traditional apparel received a healthy Memorial Boost. And sportswear and athleisure – which may carry a slightly higher price point – saw the largest Memorial Day spikes compared to the year-to-date (YTD) average as shoppers took advantage of holiday promotions.
Meanwhile, off-price retailers saw relatively muted boosts compared to the YTD numbers, perhaps because shoppers prioritized time-sensitive bargains over the off-price segment's regular discounts. But the category saw a substantial increase in YoY visits, demonstrating consumers' ongoing value orientation.
Grocery, Discount & Dollar Stores Get A Boost
Memorial Day is also a time for getting together with family and friends – often over a barbecue, picnic, or other food-forward events. As a result, grocery stores, BevAlc retailers, discount & dollar stores, and superstores all received traffic boosts compared to the YTD average, with BevAlc seeing the largest spike in visits.
Grocery stores, BevAlc retailers, and discount & dollar stores also saw YoY visit increases – perhaps suggesting an increase in Memorial Day socializing compared to 2024.
Movie Theaters Win Memorial Day 2025
While several retail categories saw significant Memorial Day-driven visit boosts, the largest increase in traffic by a long shot went to movie theaters. Combined visits to AMC, Regal, and Cinemark were up 423.6% on Monday, May 26th 2025 compared to the YTD Sunday average, with combined weekly visits to the three chains up 92.4% for the week.
The Memorial Day visit spikes – likely driven by the success of new releases such as Mission: Impossible – The Final Reckoning and Lilo & Stitch follow weeks of high traffic as films including A Minecraft Movie and Sinners drove significant traffic increases at movie theaters nationwide.
This ongoing movie theater momentum suggests that, despite past concerns about streaming and changing consumer habits, the theatrical experience continues to hold significant appeal.
Overall, the Memorial Day 2025 data paints a picture of a resilient consumer ready to engage with both retail promotions and entertainment experiences. The data also suggests that, while brick-and-mortar retail continues to attract consumers on retail milestones, entertainment is reclaiming its role as a powerful draw for holiday spending.
For more data-driven consumer insights, visit placer.ai/anchor.

Difficult February Drags Gap Traffic Down in Q1 2025
Overall visits to Gap Banners declined 3.8% in Q1 2025 compared to the same period in 2024, with average visits per location falling 4.2%. The company’s performance appears to have been impacted by a particularly challenging February, when the absence of a leap year day and severe weather events led to a 10.2% drop in overall visits and an 11.0% decrease in average visits per venue compared to February 2024.
The company’s traffic was also somewhat weighed down by Banana Republic’s performance, which posted the largest year-over-year (YoY) declines of all Gap banners during the analyzed period. Meanwhile, the Athleta banner – which struggled somewhat in 2024 – returned to modest growth in Q1 2025, with overall visits up 0.4% and average visits per location up 1.1% YoY.
Signs of Growth in April 2025
Gap’s performance improved significantly in April, with the Gap and Old Navy banners seeing YoY increases in both overall visits and average visits per venue. Old Navy in particular saw its overall traffic jump 10.2% and average visits per location increase by 9.1% compared to April 2024 – likely boosted by a tariff-driven pull-forward in consumer demand.
Average visits per venue also increased at Banana Republic and Athleta – although both banners saw minor YoY declines in overall traffic. The positive April data may indicate that the company is gaining traction and could suggest a more robust year ahead.
Ulta’s Budding Recovery
Ulta saw YoY declines of 3.7% in total visits and 7.1% in average visits per venue in Q1 2025, driven in part by difficult comparisons to a strong Q1 2024. Like Gap, the company’s February performance likely hurt its Q1 performance, with February traffic down 7.4% and average visits per venue down 10.7% compared to February 2024. But Ulta’s visit metrics improved in March 2025, with visits just 1.0% lower than in March 2024, and average visits per venue metrics narrowing to a 4.3% decline.
By April 2025, overall visits were up 0.4% YoY, and visits per venue down just 2.8% – suggesting that Ulta, like Gap, is now on a potential upward trajectory.
While Q1 2025 presented challenges for both Gap and Ulta, the rebound in April traffic offers a hopeful indication of strengthening consumer engagement. Will the companies maintain their momentum, or was the April rally the result of a temporary pull-forward of demand?
Keep up with The Anchor to find out.
Analyzing location intelligence for Saturday, May 10th (the day before Mother’s Day) and on Sunday, May 11th (Mother’s Day) can reveal how some consumers chose to celebrate the occasion.
Full-service restaurants – including breakfast-first casual dining chains such as IHOP and Waffle House – saw significant visit spikes on Mother’s Day, with traffic also rising on Saturday (almost 10% up compared to the average Saturday to date). In fact, Mother’s Day and the day before Mother’s Day were the busiest Sunday and Saturday in 2025 so far, respectively. Coffee chains also received a boost – both before Mother’s day and an even larger spike on Mother’s Day itself.
May 10th and 11th were also the most visited Saturdays and Sundays in 2025 so far at greeting card retailers – both specialized stores like Hallmark and chains with a large greeting card selection such as CVS and Walgreens. Finally, Ulta also received a boost – likely from shoppers looking for the perfect Mother’s Day gift.
For more data-driven consumer insights, visit placer.ai/anchor.
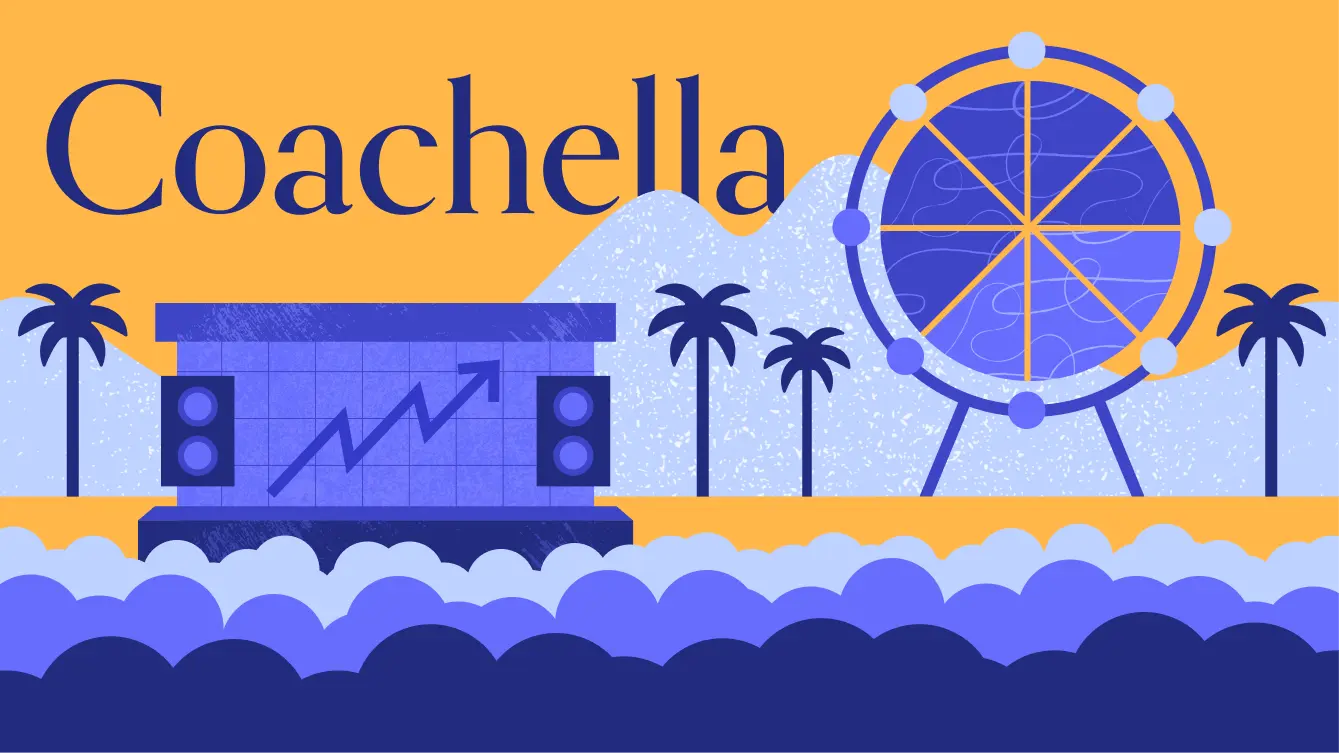
The Coachella Valley Music and Arts Festival, held annually at the Empire Polo Club in Indio, CA, recently wrapped up its 24th run. We dove into the location intelligence data to understand how the audience has changed in recent years and understand how the shift is impacting spending patterns at the festival.
Coachella Drives Visitors to Indio, CA
Indio, CA is home to the Empire Polo Club, a thousand-acre event facility known for hosting many large-scale events throughout the year which attract numerous out-of-towners. One of the venue’s oldest annual events is the Coachella Valley Music and Arts Festivals (often referred to just as “Coachella”) that takes place over two consecutive three-day weekends in April and drives large visit spikes to Indio during its run.
Coachella Audience Shifted In Recent Years
Like many other live cultural events, Coachella was cancelled in 2020 and 2021 due to the ongoing COVID pandemic. And comparing the recent audience segmentation data for Empire Polo Club visitors during recent Coachella weekends to pre-pandemic trends suggests that the festival’s audience shifted slightly following its post-pandemic return.
In recent years (2023, 2024, and 2025), the share of family segments in the Empire Polo Club’s captured market has generally been higher than it was pre-pandemic, while the share of single audience segments decreased. Specifically, Spatial.ai’s segments of Near-Urban Diverse Families, Wealthy Suburban Families, and Melting Pot Families grew, while the share of Young Professionals fell. The share of Educated Urbanites in the Empire Polo Club’s captured market showed more variance, though it was also lower over the last two years (2024 and 2025) than it was in 2019.
The audience shift could suggest that Coachella is becoming more family-friendly, with some parents choosing to make a family trip out of the festival weekend. At the same time, the increase in family-oriented segments may also indicate that the audience base has shifted younger and that the festival now attracts more Gen Z attendees, many of whom still live at home.
Shifts in Spending Patterns
The shift in audience also seems to have driven a change in spending patterns over Coachella weekend. Between 2019 and 2025, the data reveals a notable decrease in hotel & resort visits by Coachella attendees along with an increase in visits to major retail and dining categories, with the largest visit increase reserved for the most affordable segments.
Perhaps budget-conscious families and cash-strapped Gen-Zers living at home are foregoing the more expensive hotels and resorts in favor of more affordable accommodations such as Airbnbs or even camping on-site. To stretch their budgets even further, these attendees are favoring grocery stores, superstores, c-stores, and QSR as their preferred food options, driving significant visit increases to these categories.
At the same time, traffic to full-service restaurants and even apparel chains also grew somewhat in recent years – which could suggest a bifurcated spending pattern. While a significant portion of attendees prioritize affordability in lodging and everyday food, other segments with more disposable income are still willing to spend on sit-down dining and fashion purchases, perhaps viewing these as part of the overall festival experience.
Staying Relevant in 2025 and Beyond
Analyzing post-pandemic Coachella audiences reveals an increased presence of family segments, coupled with a notable gravitation towards budget-friendly spending – painting a picture of a potentially younger, more financially conscious attendee base. Simultaneously, the continued, albeit more moderate, growth in spending at full-service restaurants and apparel chains also indicates a persistent segment willing to invest in the broader festival experience. This dual trend underscores Coachella's success in balancing its appeal to both value-driven attendees and those seeking a more premium experience and suggests that the festival is continuing to maintain its relevance in 2025 – and beyond.
For more data-driven consumer insights, visit placer.ai/anchor.

