


.svg)


Mall Traffic Trends Improve in July 2025
Mall visit trends improved slightly in July 2025. Indoor mall traffic grew 1.3% year-over-year, reversing June's visit declines. This growth highlights indoor malls' rebound and suggests that enclosed shopping centers continue to attract consumers seeking climate-controlled comfort during peak summer heat.
Meanwhile, open-air shopping centers and outlet malls narrowed their visit gaps, with visits to open-air shopping centers almost on par with July 2024 levels and visits to outlet malls just 2.1% lower than this time last year.
Mid-July Visit Boost
Diving into the weekly data reveals a more complex picture. While mid-July visits were generally up relative to 2024 – perhaps boosted by the various July sales events – traffic across all three formats softened towards the end of the month. This may suggest that these major promotional events may be pulling demand forward rather than generating sustained, incremental traffic and highlights the challenge of converting a promotional 'sugar rush' into lasting momentum.
Mall Spotlight: Boise Towne Square
Boise Towne Square significantly outpaced the broader Placer.ai Indoor Mall Index in July, posting 12.2% year-over-year growth versus the national average of 1.3% – extending the Idaho mall's exceptional performance streak throughout 2025. And remarkably, Boise Towne Square has also consistently surpassed its pre-pandemic visit level every month of 2025 so far.
While multiple factors likely contribute to this strength, a major traffic driver has been the new In-N-Out location that opened in the mall in late October 2024. Since the opening, visits to Boise Towne Square have steadily increased, and other tenants – including other dining establishments – have also benefited from sustained visit improvements across the entire mall.
This demonstrates the powerful halo effect that a high-draw non-traditional anchor tenant can create for an entire shopping center.
To check out retail foot traffic trends for yourself, try Placer.ai's free industry trends tool.

Starbucks: Narrowing the Visit Gap
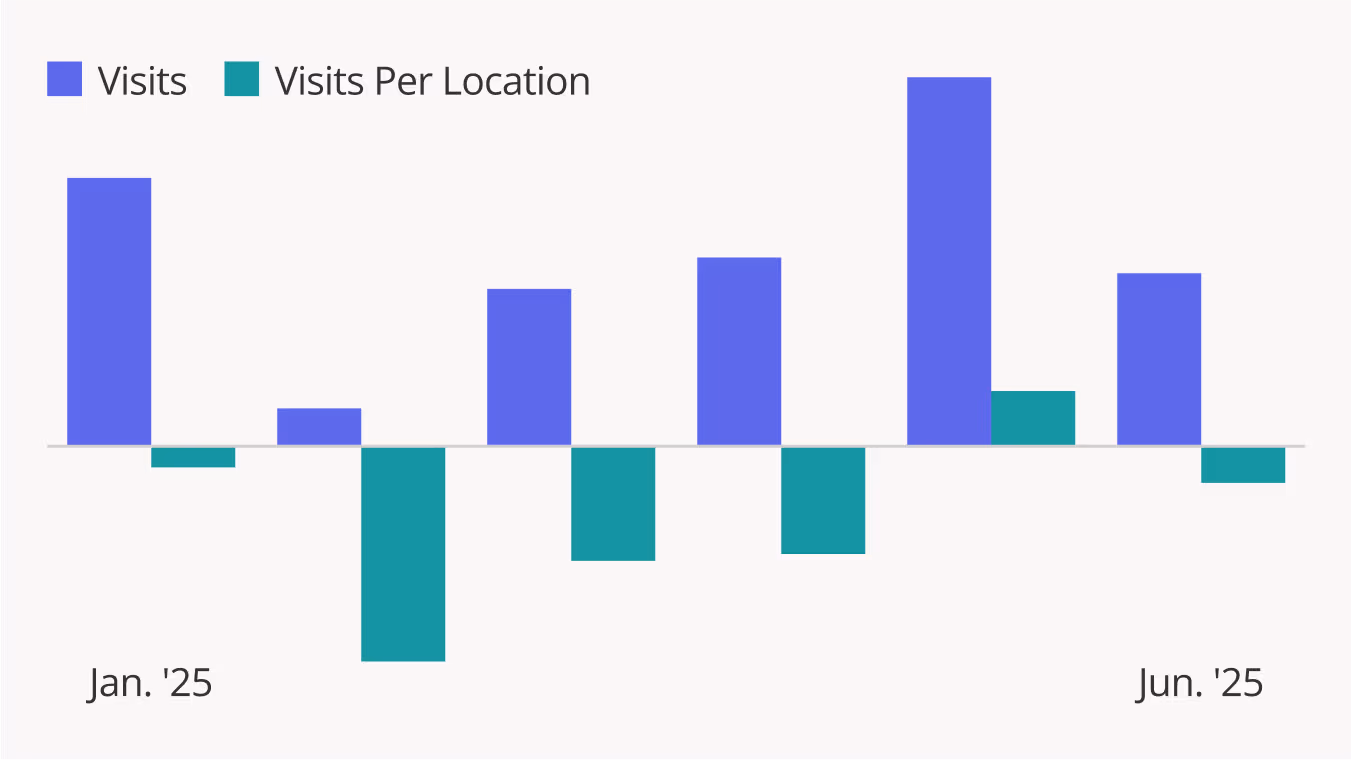
The coffee space has become increasingly competitive in recent years. And while traffic to the segment is up, the growth of small and medium sized chains may be coming at the expense of Starbucks. Visits to the reigning coffee giant were down slightly (0.1%) YoY in Q2 2025 while average visits per location declined 4.2% in the same period.
Still, these trends mark an improvement compared to last quarter, when YoY visits and average visits per venue were down 0.9% and 5.4%, respectively – suggesting that the company's "Back to Starbucks" strategy and recent menu innovations are beginning to drive a turnaround.
Dunkin’ Grows Slightly
Meanwhile, Dunkin' – the second-largest coffee chain in the country – is seeing modest growth, with overall visits and average visits per venue up 1.7% and 0.3% YoY, respectively, in Q2 2025. Like Starbucks, Dunkin' showed improvement in Q2 2025 compared to Q1 2025 – perhaps an early sign of strengthening consumer confidence.
But while broader market forces may have helped, Dunkin's Q2 2025 turnaround may also be attributed to the chain's promotional efforts – including a new ad campaign to promote the chain's $6 Meal Deals. As value continues to drive consumer decision-making, Dunkin's emphasis on affordable bundles positions it well to maintain its visit share despite the growing competition in the space.
Dutch Bros Visits Spike
Dutch Bros, one of the fastest growing coffee brands in recent years, maintained its momentum in Q2 2025, as coffee chains betting on small-format, largely drive-thru locations – including 7Brew, PJ's Coffee, Biggby, and Foxtail – continue to resonate with consumers.
Overall visits to the Oregon-based chain grew 13.8% YoY alongside a 0.8% increase in average visits per venue – indicating that the chain's ongoing expansion is not cannibalizing traffic from existing venues. This bodes well for the brand as it continues its aggressive expansion – 2,029 stores by 2029.
Success Brewing for H2?
As we look to the second half of 2025, the coffee sector will be characterized by the distinct strategies of its key players. Dutch Bros' aggressive expansion will continue to challenge the incumbents on a local level, while Dunkin's focus on value will likely remain a key advantage with budget-conscious consumers. The ultimate test will be for Starbucks, as the industry leader's ability to translate its strategic innovations into sustained visit growth will determine its capacity to defend its market share.
For more data-driven dining insights, visit placer.ai/anchor.
Traffic Performance Reveals Divergent Growth Trajectories
Shake Shack traffic increased an impressive 13.7% year-over-year (YoY) in Q2 2025 while average visits per venue held relatively steady at -1.7% – indicating that the chain's aggressive expansion strategy is capturing new market share without cannibalizing existing locations.
Meanwhile, although Q2 2025 visits to Wingstop were up 3.6%, the chain's average visits per venue declined 6.3% – which may suggest that discretionary dining brands serving lower-income consumers may be experiencing pressure from tightening household budgets.
Demographic Differences Between Wingstop & Shake Shack
Analyzing trade area demographic data reveals that Wingstop's captured market has a median household income of $69.5K – significantly lower than Shake Shack's $97.0K. Wingstop's trade area also includes a much higher proportion of households with children.
Wingstop attracts families with tighter budgets who must stretch their dining dollars further, which likely contributed to the decline in average visits per venue during this period of economic uncertainty. Meanwhile, Shake Shack's appeals to higher-income consumers with more discretionary spending power could explain the chain's impressive visit strength despite the ongoing headwinds.
Small Shifts in Visitor Loyalty
Looking at the change in visit frequency compared to 2024 also suggests that Wingstop is feeling the impact of its visitors' tighter budgets.
Wingstop still maintains a significant advantage in customer loyalty, with 16.8% to 18.1% repeat monthly visitors in H1 2025 compared to Shake Shack's 10.5% to 11.4%. But comparing these numbers to 2024 reveals that Wingstop's share of repeat visitors has declined slightly since 2024, while Shake Shack has posted modest monthly gains throughout H1 2025.
This shift suggests that budget-conscious families may be reducing their regular Wingstop visits to save money, while Shake Shack's strategic expansion is bringing locations closer to customers which could be driving increased repeat visitation.
Wingstop's Well-Positioned For Long-Term Resilience
Despite facing economic headwinds, Wingstop's continued positive visit growth and superior customer loyalty metrics demonstrate the brand's strong fundamentals and deep connection with its core family demographic.
As economic conditions stabilize, Wingstop's established customer base and proven appeal to budget-conscious families positions the chain for a strong rebound, particularly given that families with children represent a large and resilient market segment that will likely return to regular dining patterns when household budgets recover.
Visit Placer.ai/anchor for the latest data-driven dining insights.
Movie theater visits were up year-over-year in Q2 2025, but traffic generally remains significantly below 2019 levels – with the exception of Cinemark, where visits are almost on par with pre-pandemic levels. We analyzed the data to understand how movie-going behavior has changed since COVID and why Cinemark is staying ahead of the curve.
Year-over-Year Strength
Movie theater traffic jumped year-over-year (YoY) in Q2 2025 thanks to the release of several successful blockbusters, including A Minecraft Movie, Sinners, Lilo & Stitch, and Mission Impossible: The Final Reckoning.
Movie Visits Lag Pre-COVID Levels – But Cinemark Bucks the Trend
Still, baseline movie theater attendance remains significantly lower than it was pre-pandemic. And although YoY trends for AMC, Regal, and Cinemark were relatively consistent, comparing these chains' recent visit trends to pre-pandemic traffic reveals major differences in long-term performance.
Between July 2024 and June 2025, visits to the two largest chains – AMC and Regal – were 33.2% and 40.0% lower, respectively, than they were between July 2018 to June 2019. The visits per location gap was slightly narrower – due to rightsizing efforts that consolidated traffic into fewer movie theaters – but the data still indicates that AMC and Regal theaters are generally emptier than they were in 2018-2019.
But bucking the trend is Cinemark, which saw traffic to its flagship Cinemark brand dip just 2.6% compared to pre-COVID, while average visits per location were relatively stable at -0.8%. Thanks to this impressive recovery, Cinemark has significantly strengthened its position in the wider movie theater landscape.
Cinemark's Fuller Theaters
A deeper look at the data confirms Cinemark's success in attracting moviegoers. Cinemark theaters average more visits both per location and per square foot, indicating that their higher visit numbers stem from fuller theaters rather than larger venues or more locations.
Blockbusters Playing Larger Role in Driving Movie Visits
But just because Cinemark's visit numbers are relatively aligned with 2018-2019 traffic levels does not mean that the chain has not been impacted by the shift in post-COVID movie-going behavior.
Comparing monthly visits between July 2018-June 2019 and July 2024-June 2025 reveals increased traffic volatility at all three chains, with higher peaks and deeper valleys compared to average monthly baselines. This volatility likely stems from blockbusters playing a more central role in driving movie visits. Fewer consumers now go to movies casually – instead, they save their limited movie budgets for major releases.
The data also shows that all three chains have seen a relative drop in visits to matinee screenings (before 5 PM) along with a relative increase in late-night visits (9 PM to 1 AM) – which could also be consistent with a more intentional and less casual movie-going pattern.
And Cinemark hasn't been immune to these changes. The chain has also experienced similar monthly visit volatility, fewer matinee visits, and more late-night visits – matching the patterns seen at AMC and Regal.
Cinemark's Success – Less Affluent, More Family-Friendly Visitor Base
So what is driving Cinemark's success? Some of the answer may lie in its strategic focus on less affluent family audiences. Compared to AMC and Regal, Cinemark attracts visitors from areas with lower median household incomes and higher concentrations of families – a positioning the chain seems to be deliberately cultivating.
Cinemark has built an ecosystem designed for budget-conscious families: their Movie Club membership includes monthly rollover ticket credits and concession discounts, while their Summer Movie Clubhouse offers discounted family packages. Select locations also feature Camp Cinemark auditoriums – screening rooms specifically designed to be child-friendly.
This strategy creates a virtuous cycle. While Cinemark's lower-income audience has tighter entertainment budgets, they're also less likely to have premium home theater setups that compete with the theatrical experience.
When these families do decide to splurge on entertainment, Cinemark's value-oriented approach and family-friendly amenities make it the logical choice – turning occasional visits into a more loyal customer base that sustains traffic even during industry-wide downturns.
Cinemark Highlights Path to Success for Movie Theaters
While most movie theater chains continue to struggle with significantly lower attendance compared to pre-pandemic levels, the strong YoY performance suggests that the movie theater recovery story is still being written. Cinemark's success demonstrates that chains willing to adapt their strategies to serve underserved audiences can not only survive but thrive in the transformed post-pandemic entertainment landscape.
For more data-driven consumer insights, visit placer.ai/anchor.

Major retailers held promotional events around Amazon's Prime Day sales event. How did the promotional events impact retail foot traffic? And what does the data reveal about the state of consumers going into the second half of 2025?
July Promotional Events Mostly Boosted Mid-Week Visits
Comparing daily visits to major retailers during their July campaigns against same-day YTD averages (e.g., Sunday July 6th traffic versus average Sunday visits in 2025) reveals that sales primarily boosted weekday traffic. Visits increased Monday through Friday during the promotional periods, but every retailer that extended its campaign to Saturday – typically the busiest in-store shopping day – experienced traffic declines compared to YTD Saturday averages.
Individual retailer analysis shows Best Buy achieved the strongest response, with visits increasing 13.2% to 21.9% between July 7th and 11th compared to same-day YTD averages, and the final day (Sunday July 13th) posting a 7.2% increase. Conversely, Dollar General saw the weakest performance – only three of seven promotional days generated visit increases, all remaining in low single digits.
This pattern suggests consumers leveraged sales for big-ticket purchases at discounts but didn't use the opportunity to stock up on lower-priced items.
Generally Lower YoY Visit Numbers
Comparing average daily visits during 2024 and 2025 July campaigns shows generally lower in-store traffic this year. Timing likely played a role – except for Best Buy, all analyzed retailers ran their 2024 campaigns before Amazon Prime Day, while this year all five overlapped with Amazon's event. This means that, unlike in 2024, Target, Walmart, Kohl's, and Dollar General directly competed with Amazon Prime Day in 2025, potentially driving the in-store traffic decline.
This calendar shift makes Walmart's performance particularly noteworthy. Average daily visits during "Walmart Deals" increased 8.9% compared to last year – despite facing direct Amazon competition for the first time.
Walmart's strength may stem from its recent "Who Knew?" advertising campaign, which may have kept the retailer top-of-mind for many customers during this period of intense retail competition.
The YoY visit growth during July campaigns represents another milestone in the company's turnaround and brand refresh, demonstrating the legacy retailer's continued relevance in today's competitive retail landscape.
The data reveals that consumers approached July 2025 promotional events with strategic intent, focusing on high-value purchases during convenient weekday shopping windows rather than impulse buying across all categories.
Walmart's standout performance amid increased competition suggests that strong brand messaging and strategic positioning can overcome market headwinds, providing optimism for retailers heading into the second half of 2025.
For more data-driven retail insights, visit placer.ai/anchor.
McDonald's recent re-introduction of the snack wrap joins the recent wave of nostalgia-driven menu innovations – and initial data suggests that the fan-favorite is already driving up visits to the chain. On July 10th – the day of the launch – McDonald's traffic nationwide was up 15.0% compared to the 2025 YTD daily average and 11.4% higher than the YTD Thursday average, and visits remained high on Friday and Saturday as well.
The Snack Wrap's return comes at a critical time for McDonald's, as the chain continues to lean on menu innovations to turn around its recent traffic plateau plateau and sales dips.
Will the initial excitement translate into a sustained visit hike?
Visit placer.ai/anchor for the latest data-driven dining analysis.

