


.svg)


Many of Thanksgiving’s consumer behavior impacts are broadly recognized, from the pre-Thanksgiving Turkey Wednesday peak at grocery stores to the post-Thanksgiving Black Friday shopping bonanza. But diving into consumer foot traffic trends for the week before the holiday reveals some lesser-known ripple effects from many Americans’ favorite national event. So how did Thanksgiving impact retail, dining, and airport visits this year? We analyzed the data to find out.
Visits to Home Decor & Party Supply Stores Spike
Many Americans host friends and family for Thanksgiving dinner, leading to the well-recognized spike in pre-Thanksgiving grocery traffic that culminates on Turkey Wednesday. But hosting a proper Thanksgiving dinner requires more than just good food – the space needs to be prepped as well.
Foot traffic data indicates that many consumers do in fact spend the week before Thanksgiving shopping for decor and other entertainment supplies, driving visit increases at home furnishing stores such as Homesense and at party supply stores such as Party City. And the prospect of guests also seems to motivate consumers to tackle whatever home repair projects they’ve been putting off – visits to home improvement stores, including Home Depot and Lowe’s, also received a significant boost the week before Turkey Day.

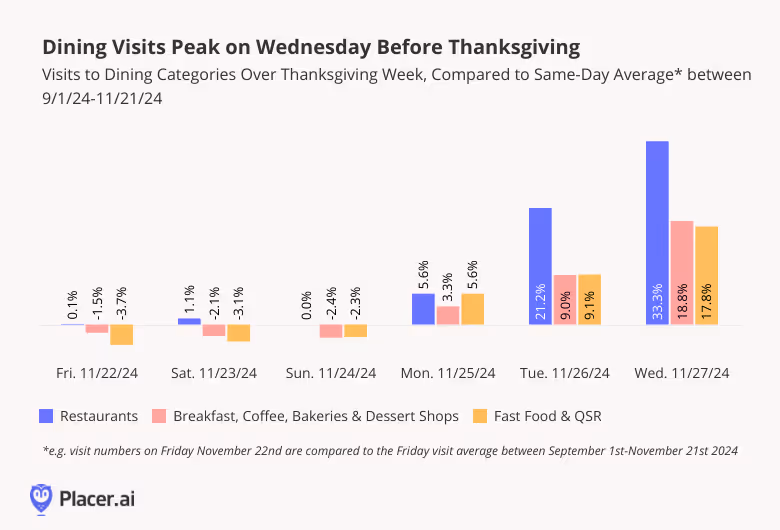
Dining Visits Rise
All the time spent in the kitchen cooking for Thanksgiving may also be contributing to a rise in dining visits on the days leading up to the holiday. Although visits to restaurants, breakfast joints, and fast food places dipped slightly during the weekend before Thanksgiving, foot traffic to major dining segments began climbing on Monday, November 25th before peaking on Turkey Wednesday.
This increase in dining visits could be due in part to home cooks – and their families – looking to fuel up outside the home as the kitchen gets taken over by Thanksgiving prep. And some Americans who started the Thanksgiving vacation early may choose to spend some quality time going out to eat with their friends and families prior to the big day. Others who are already traveling may also be driving up dining visits by looking for more meals on the go.
Car Categories’ Visit Boost Limited to Wednesday
But even as some Americans begin their Thanksgiving travels earlier in the week, most Americans traveling by car seem to wait until Wednesday to head out – and the traffic boost to car-related categories seems to occur much closer to the day itself. Car shops & services and gas stations & convenience stores received a minor bump on the Tuesday before Thanksgiving as some Americans hit the road early or got their car serviced ahead of the long drive back home. But most of the traffic boost to car shops, car washes, and gas stations occurred on Wednesday November 27th – just before Thanksgiving travel.

Thanksgiving’s Foot Traffic Boost
Thanksgiving’s economic impact is not limited to grocery stores and post-Thanksgiving Black Friday shopping. Analyzing consumer foot traffic data for the week before the holiday reveals the widespread impact that Thanksgiving has on a range of consumer sectors, from car washes to dining segments to home improvement.
For more data-driven consumer insights, visit placer.ai.

Visits to Starbucks usually spike on its annual Red Cup Day, as patrons flock to the chain to order a specialty holiday beverage and receive a complimentary reusable red cup. But last year, the chain’s Red Cup Day performance was relatively muted – although foot traffic still got a boost, the jump was not quite as significant as in previous years. Was the promotion more effective in 2024? We dove into the data to find out.
Red Cup Day Drove a Higher Visit Spike in 2024 relative to 2022 & 2023
Starbucks’ Red Cup Day came roaring back in 2024, with Thursday, November 14th – the day of the promotion – receiving 42.4% more visits than the recent Thursday daily visit average. And Red Cup Day didn’t just drive visits relative to a regular weekday – the promotion brought a 9.4% lift in overall weekly visits to Starbucks during the week of the event.
The relative visit bump was significantly higher than on Red Cup Day 2023 – when visits on Thursday, November 16th 2023 were only 25.0% higher than the previous five Thursday averages – and even outshined the already strong performance of Red Cup Day 2022.

Red Cup Day Lift More Significant Than PSL Launch
As usual, Red Cup Day at Starbucks drove a larger visit spike than the launch of the chain’s popular Pumpkin Spice Latte (PSL): During the week of the PSL launch, visits rose 9.7% compared to the first week of H2 (July 1st-7th 2024), while Red Cup Day drove a 12.9% foot traffic bump relative to that same baseline.
Nevertheless, the recent data also indicates that the PSL remains a seasonal fan favorite – Starbucks received more weekly visits on the PSL’s arrival week than it did when it launched the holiday menu, when visits increased 6.7% relative to the beginning of H2.

Starbucks’ Wins Consumers Back by Owning the Calendar
This year’s Red Cup Day followed several weeks of year-over-year (YoY) visit dips at Starbucks, with weekly foot traffic between September 2nd and November 10th 2024 down an average of 4.4% YoY. But the success of the promotion – which drove YoY visit growth for the first time since August – showcases Starbucks’ expertise at driving visits by owning the calendar.
The chain has succeeded in establishing a yearly buzz around its branded cups that drive visits during what would otherwise be an off-season for the chain. And even this year, when consumers seem to be tightening their purse strings and cutting down on discretionary spending ahead of the holidays, Red Cup Day still managed to drive patrons to Starbucks stores in search of holiday beverages and free swag.

How will Starbucks perform throughout the end of 2024?
Visit placer.ai to find out.

With the year almost over, we dove into the visitation data for off-price leaders to see how the TJX chains, Burlington, and Ross Dress for Less are positioned ahead of the holidays.
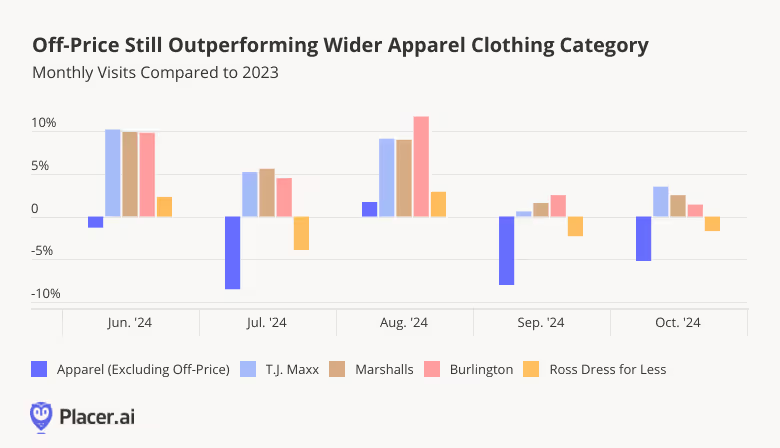
Off-Price Still Going Strong
The off-price segment continued to outperform the wider apparel category in recent months as consumers continued favoring budget-friendly retail outlets. Visits to TJX-owned T.J. Maxx and Marshalls as well as to Burlington remained elevated, with the three chains seeing YoY growth of 5.1%, 5.5%, and 6.4% in Q3 2024. And while Ross foot traffic declined slightly relative to 2023 in July, September, and October, the chain’s YoY visit gap remained significantly smaller than that of the wider apparel category.
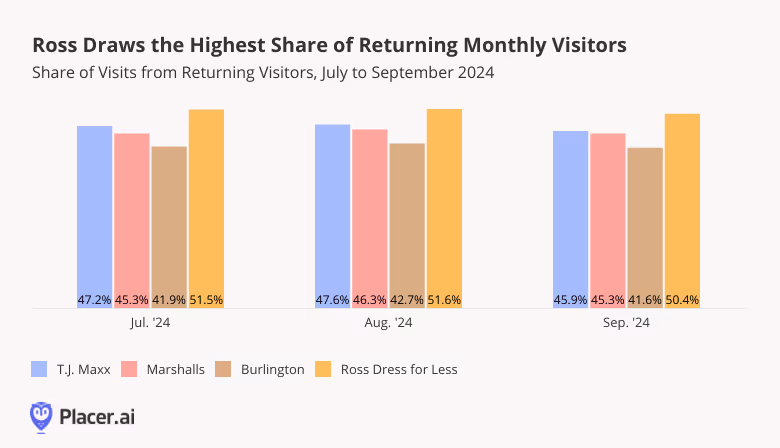
Ross Attracts the Most Loyal Following
And even as Ross lags slightly behind the rest of the off-price space, the chain leads the segment in one metric – the share of returning visitors every month. In Q3 2024, over half of Ross’ monthly visits came from visitors who visited the chain at least twice in the month, compared with 41.9% - 47.6% of visits from returning visitors for the other three off-price leaders.
This data indicates that Ross is already extremely successful at cultivating a loyal clientele that regularly visits the company’s stores – and adding new shoppers to its circle of dedicated customers could drive further YoY visit growth going forward.
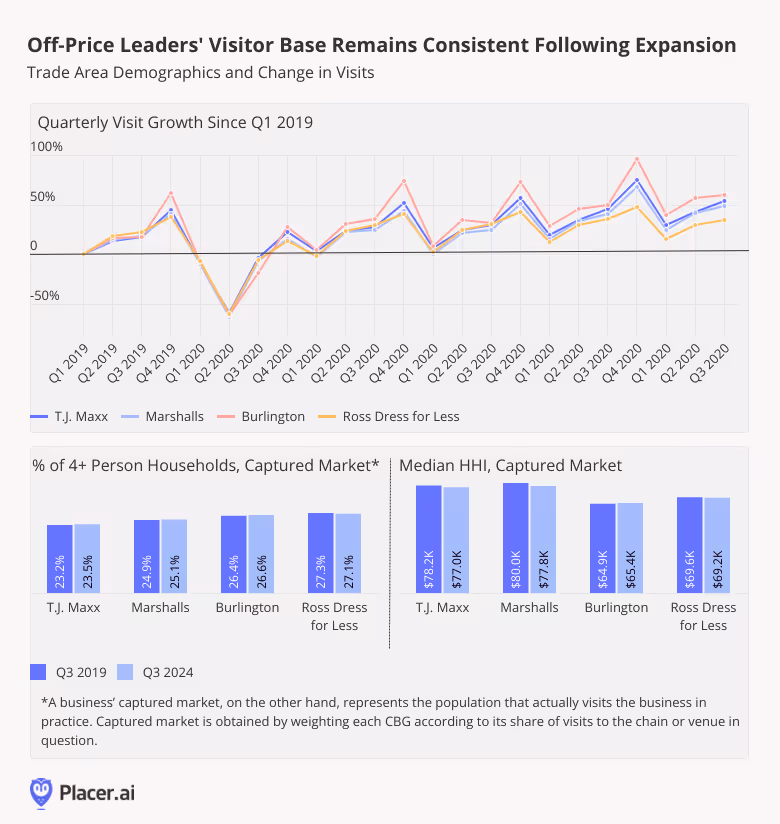
Off-Price Leaders Stay True to Their Audience
Expansion has been a major driver of off-price growth in recent years. Since 2019, the four off-price chains analyzed have all greatly increased their brick-and-mortar footprints, leading to visit surges nationwide.
And impressively, T.J.Maxx, Marshalls, Burlington, and Ross have all managed to expand their physical reach dramatically without straying from their core audience. Diving into the four chains’ trade area demographics in Q3 2019 and Q3 2024 reveals that, even as the retailers’ store fleet configurations evolved, their trade area demographics remained strikingly consistent.
Since 2019, the share of large households in the retailers’ trade areas has remained remarkably steady – though all four brands have seen a slight increase in the share of 4+ person households. The trade areas’ median household incomes (HHIs) did shift slightly as the chains expanded – falling for T.J. Maxx and Marshalls, and, to a lesser extent, Ross, while increasing somewhat for Burlington – but the change from 2019 has been minimal.
It seems, then, that these four off-price leaders have successfully grown their reach over the past five years while maintaining a strong connection with their core customer base, positioning them for continued sustained success in the competitive retail landscape.
As the holiday season approaches, the off-price retail sector remains resilient. The year-over-year growth and high loyalty rates seen by category leaders along with their success at expanding without alienating their core audiences positions these chains to remain a formidable force within the wider retail landscape.
For more data-driven retail insights, visit placer.ai/blog.

The sporting goods and sportswear category has had a rough couple of months. Two mainstays in the space – Bob’s Stores and Eastern Mountain Sports – filed for bankruptcy in June, and several sportswear and athleisure leaders posted disappointing results. So is the consumer demand for leggings and sneakers waning? Or is the category merely facing a temporary slowdown? We dove into the data to find out.
Lululemon in the Lead
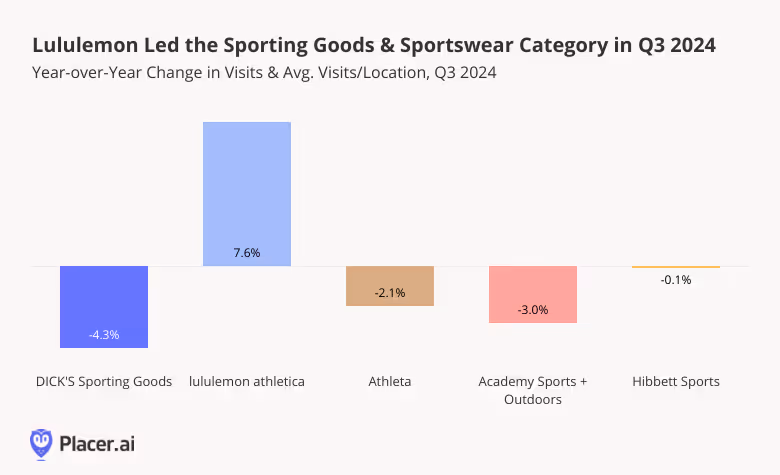
With budgets still tight, many shoppers are turning to value apparel and value athletic wear – and this trading down may be impacting the sporting goods and sportswear space: Q3 2024 visits to most sporting goods and athletic wear chains analyzed, including DICK’s Sporting Goods, Athleta, Academy Sports + Outdoor, and Hibbett Sports, remained at or moderately below 2023 levels. Still, the relatively minimal visit gaps indicate that demand for the category remains stable and may rise again with increased consumer confidence.
Meanwhile, lululemon athletica saw a 7.6% increase in YoY visits in Q3 2024 thanks to the company’s ongoing expansion.
Different Chains Serve Different Audiences
But even as the sporting goods and sportswear category may be facing a temporary lull, diving into the demographics of the trade areas for the various retailers reveals the variety of sporting goods and sportswear consumers – showing the varied demand for the category.
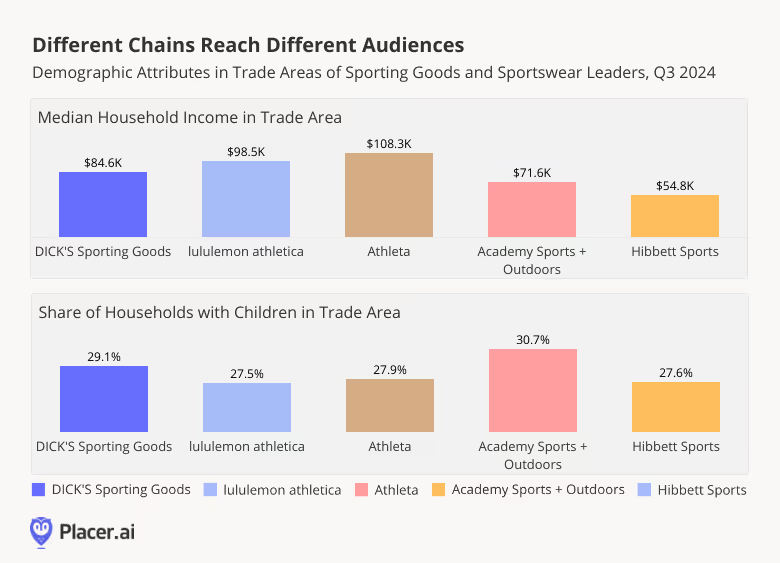
The median household income within the trade areas of the five chains analyzed ranged from $54.8K for Hibbett Sports to $108.3K for Athleta. The share of households with children within the trade areas also varied among the chains: DICK’s Sporting Goods, and Academy Sports + Outdoors included significantly more households with children in their captured markets when compared with Athleta, lululemon, or Hibbett Sports.
It seems, then, that each chain appeals to a specific consumer segment – DICK’s and Academy Sports both serve families, although DICK’s attracts the higher-income households and Academy Sports draws more middle-income shoppers. Lululemon and Athleta both operate at the higher-end of the athletic wear spectrum, but Athleta shoppers tend to come from slightly more affluent areas with larger household sizes. And Hibbett has carved out a niche among lower-income consumers.
Reason for Optimism Ahead of the Holidays
Demand for sportswear and gym gear may not be as strong as it was at the height of the pandemic when gyms were closed and consumers were doubling down on comfort. But the variety of audiences within the category leaders’ trade areas indicates that appetite for athletic wear and sporting goods is still widespread. And with Black Friday around the corner, these chains – and especially the higher-priced retailers among them – may well get a boost from price-conscious consumers looking to snag discounts at their favorite premium chains.
For more data-driven retail insights, visit placer.ai.
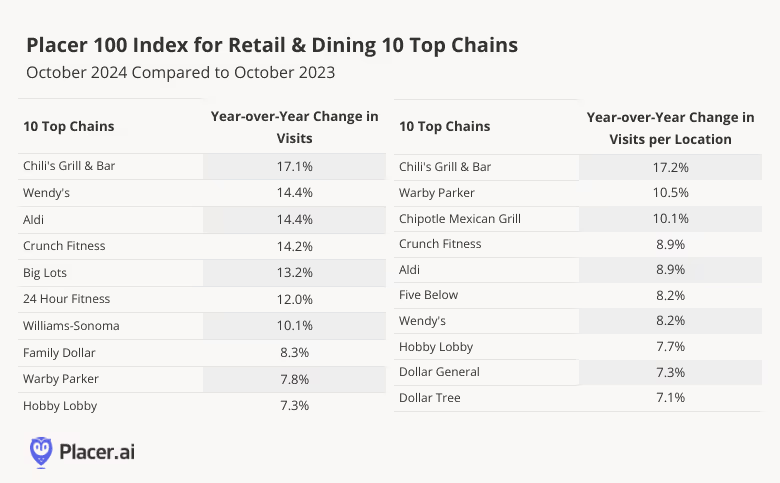
About the Placer 100 Index for Retail & Dining: The Placer 100 Index for Retail and Dining is a curated, dynamic list of leading chains that often serve as prime tenants for shopping centers and malls. The index includes chains from various industries, such as superstores, grocery, dollar stores, dining, apparel, and more. Among the notable chains featured are Walmart, Target, Costco, Kroger, Ulta Beauty, The Home Depot, McDonald’s, Chipotle, Crunch Fitness, and Trader Joe's. The goal of the list is to provide insight into the wider trends impacting the retail, dining and shopping center segments.
Placer 100 Index Swings Positive in October
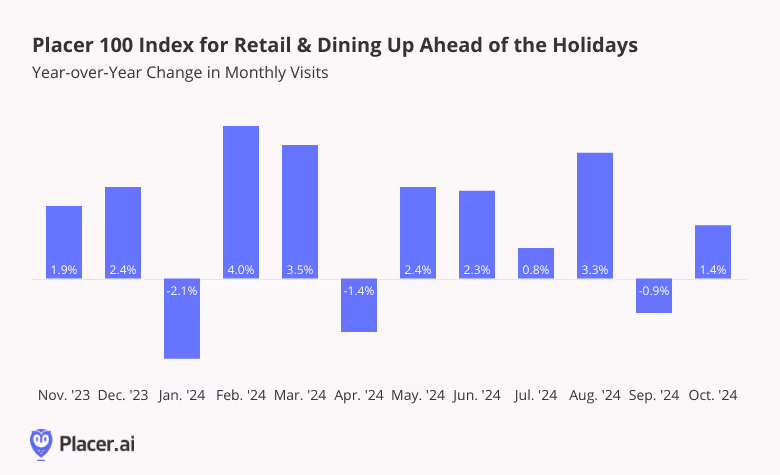
Visits to the Placer 100 Index chains grew over the summer, as the back to school season drove a 3.3% year-over-year (YoY) jump in August 2024 visits. And visits in September 2024 were essentially on par with September 2023 levels – indicating that shoppers did not stay home to make up for retail’s summer surge, which could signal an increased willingness to spend ahead of the critical Q4.
And indeed, the fourth quarter of the year started strong, with the Placer 100 Index up 1.4% YoY in October 2024 – and with consumer confidence recently hitting a 9-months-high, the upcoming holiday season looks particularly promising.
Placer 100 October 2024 Winners
Chili’s Grill & Bar topped the Placer 100 October chart in terms of both overall and per-location visit growth. The chain is still riding the wave of its Big Smasher Burger success, which sent visits skyrocketing following the product’s launch in late April. Warby Parker also saw impressive increases in overall visits and in visits per location as the chain continued opening new stores and adding eye exam offerings to existing locations.
Aldi and Crunch Fitness also saw growth in both metrics, with the increase in overall visits outpacing the strong increase in visits per location – pointing to a successful expansion strategy.
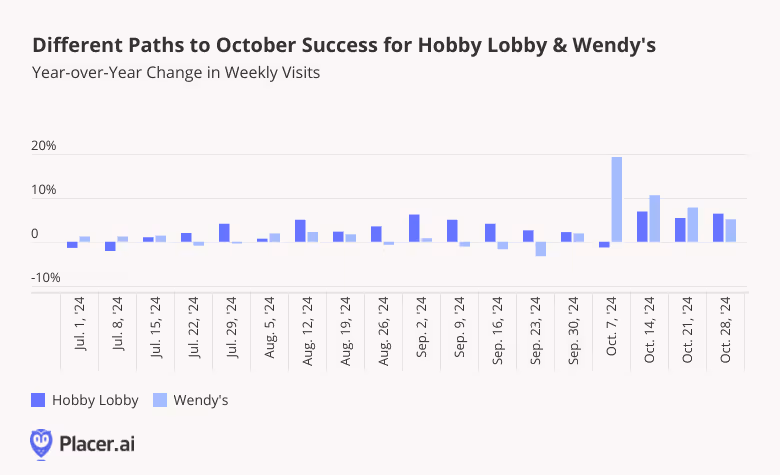
Placer 100 October 2024 Spotlight: Hobby Lobby & Wendy’s
Hobby Lobby and Wendy’s also experienced increases in both overall visits and visits per location in October, with different paths leading to the two chains’ October successes.
Hobby Lobby’s visits follow clear seasonal patterns. The chain’s traffic usually peaks in December, but traffic already begins to rise in August as parents and teachers stock up on supplies and classroom decorations. Visit growth then ramps up throughout September and October as consumers purchase Halloween-themed costumes and decorations. So far, Hobby Lobby appears to be having a particularly successful year, with visits outpacing last year’s numbers since the summer – and with the chain’s busiest season of the year coming up, Hobby Lobby is positioned to close out the year with a bang.
Wendy’s, meanwhile, demonstrated how chains can create their own growth opportunities without aligning with existing calendar-driven spending occasions. The chain introduced the Krabby Patty Kollab menu items on October 2nd to celebrate the 25th anniversary of "SpongeBob SquarePants,” which sent visits surging. And YoY traffic was still up four weeks later, revealing the potential of LTOs to drive up dining traffic even in the absence of a specific seasonal boost.
Which chains will top the Placer 100 Index in November?
Visit placer.ai to find out!
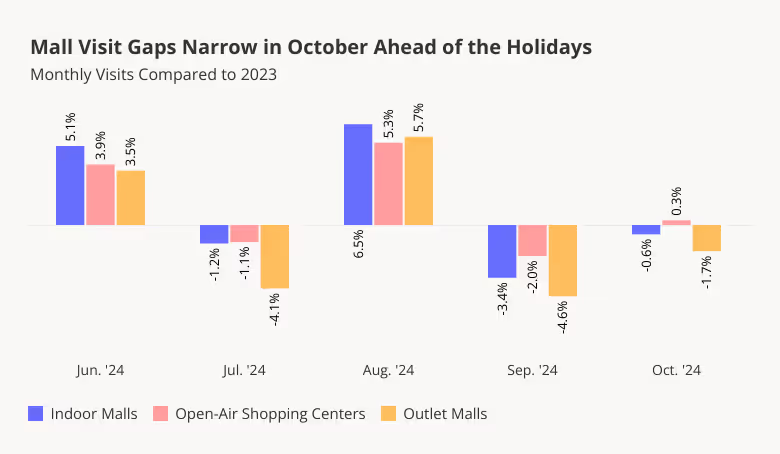
With the holiday season just around the corner, we dove into the Placer.ai Mall Index to see how these shopping mainstays performed during the fall retail lull.
October Mall Visits on Par with 2023 Levels
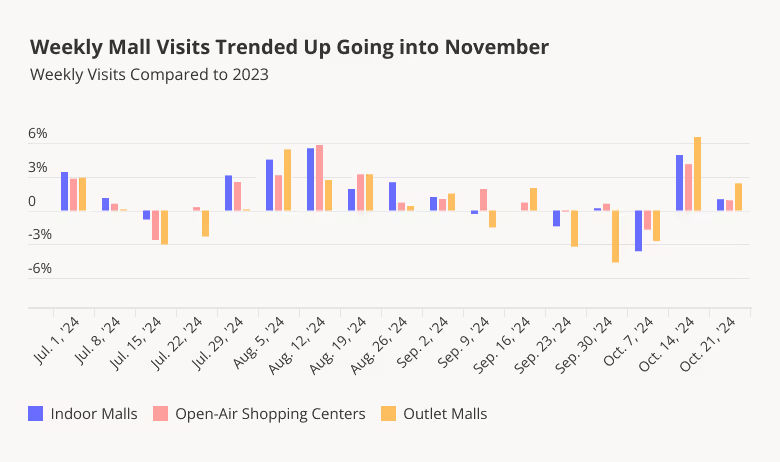
Following several months of roller-coaster visit trends – as August visits surged compared to last year and September visits dipped year-over-year (YoY) – mall traffic stabilized in October: Last month’s visits to indoor malls, open-air shopping centers, and outlet malls generally matched 2023 visitation trends. The closing of the YoY visit gaps may indicate that consumers are once again ready to spend following the brief September slow-down – boding well for the upcoming holiday season.
Weekly Trends Swing Positive Ahead of November
Diving into the weekly trends offers even further reasons for optimism: YoY visits over the last two full weeks of October were positive for all three mall categories, with outlet malls in particular seeing the largest YoY increases. Outlet malls’ positive performance during the second half of the month may signal a comeback for the format, which has generally lagged behind indoor malls and open-air shopping centers in recent months.
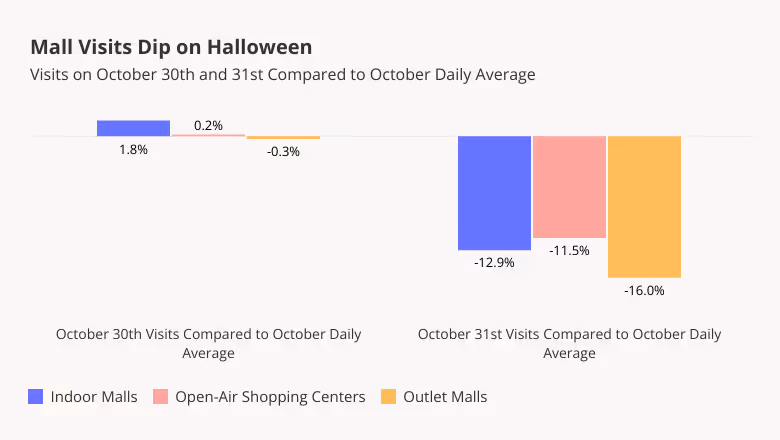
Mall Visits Dip on Halloween
Unlike certain retail categories that enjoy Halloween-driven visit surges either on the day itself or on October 30th, malls do not appear to benefit from the spooky holiday. Analyzing daily visits reveals that October 30th visits were on par with the daily October average, while October 31st traffic actually took a hit across the three mall formats in the Placer.ai Mall Index.
The dip is likely due to shoppers putting off their mall trips and instead choosing superstores and specialty retailers such as party supply stores and liquor shops for their holiday prep. Stores hoping to avoid the Halloween dip may want to offer special promotions around the day – and managers can also use this information to optimize their staffing schedules on October 31st.
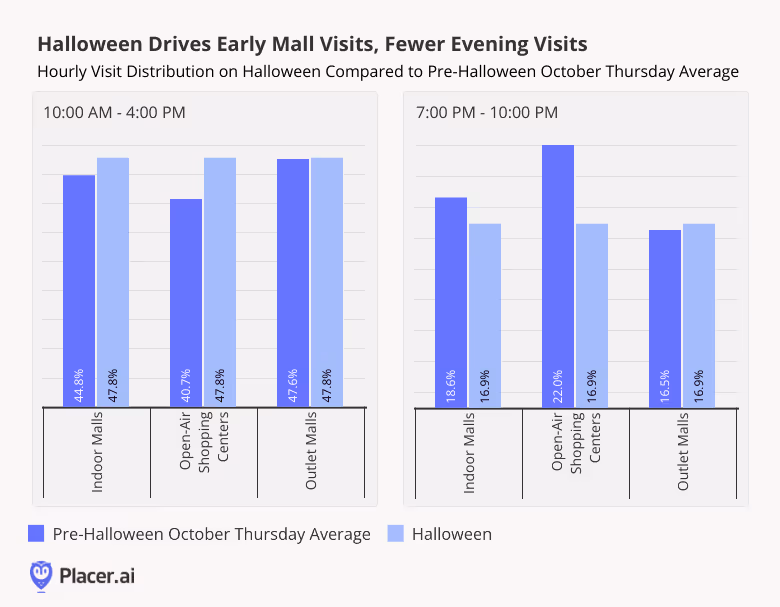
Shoppers Shop Early on Halloween
Diving into hourly visit distributions provides even more data for those looking to optimize store performance. On Halloween, indoor malls and open-air shopping centers received a larger share of their visits before 4:00 PM and relatively fewer visits in the evening when compared to an average Thursday in October. So while some consumers did come out to malls in the morning, by evening, many shoppers may have been too busy scrambling to complete their Halloween costume or stock up on candy for the evening. Meanwhile, the Halloween dip in visits to outlet malls appears to have been evenly spaced throughout the day, with hourly visit shares on October 31st closely matching the average Thursday visit distribution patterns.
Store managers operating in indoor malls or open-air shopping centers may use this data to optimize staffing for the afternoon and evening Halloween shifts, while those working at outlet malls may want to reconsider their manpower needs for the day as a whole. At the same time, those looking to draw in more foot traffic may try offering promotions that appeal to early birds or trick-or-treaters.
With October in the rearview mirror, the holiday season is kicking off. How will malls perform?
Visit placer.ai to find out.

