


.svg)


Sprouts, the natural and organic food focused grocery chain operating in 23 states nationwide, is going through a growth spurt. We dove into the visit and audience data to see where the chain stands today and what the rest of 2024 – and beyond – may have in store.
Sprouts is on a Growth Spurt
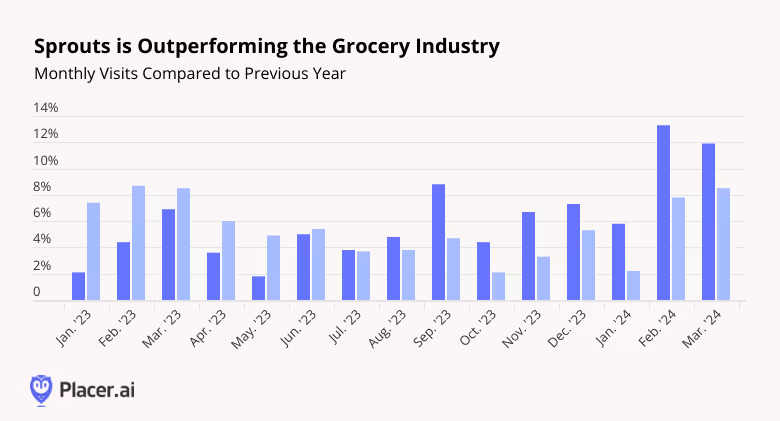
Sprouts is on the rise. Year-over-year (YoY) visits increased every month of last year and have been outperforming the nationwide Grocery average since mid-2023. And the chain continued to grow in Q1 2024, with visits up an impressive 13.3% and 11.9% in February and March 2024, respectively – an impressive feat given the comparison to an already strong Q1 2023.
Some of the growth is driven by expansion – the company opened 30 new stores in 2023 and expects to add 35 additional locations in 2024. But the increase in foot traffic is also a testament to the potential of specialty grocery stores to leverage their unique product selection to attract grocery shoppers, even in the face of growing competition in the space.
Sprouts High-Income Visitor Base Likely Contributing to the Chain’s Success
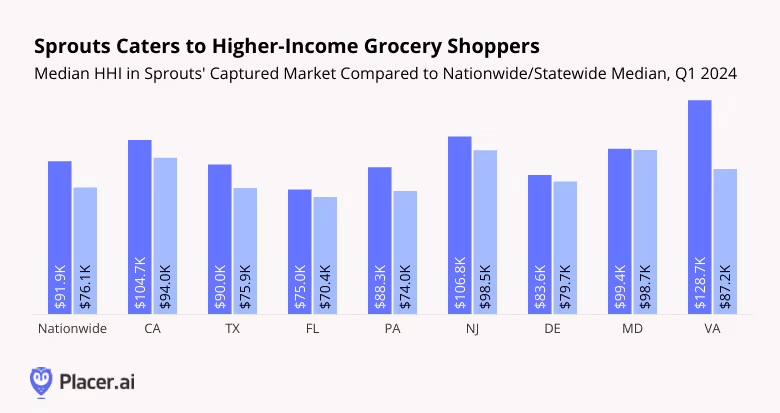
The relatively high income of Sprout’s visitor base is likely also helping the chain stay ahead of the grocery pack: Median HHI in Sprout’s trade areas nationwide is higher than the U.S. median HHI, and the data shows a similar trend in Sprout’s eight growth markets.
The relative affluence of Sprouts shoppers means that this segment may not be as impacted by high food prices as other grocery shoppers – so the retail headwinds predicted this year are not likely to slow down Sprout’s growth potential as the chain continues expanding its reach in 2024.
Sprouts’ Different Growth Markets Exhibit Different Characteristics
While Sprouts’ visitors across states seem to share a relatively high income level, diving deeper into the location intelligence data reveals some major differences in both in-store behavior and overall market composition.
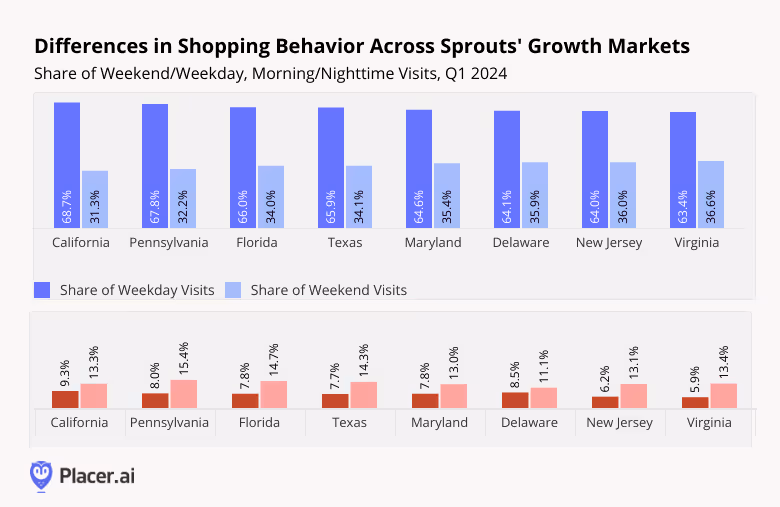
For example, the share of weekend (as opposed to weekday) visits to Sprouts in Q1 2024 varied significantly – from 31.3% in California to 36.6% in Virginia. Shoppers in the company’s various growth markets also visited stores at different hours throughout the day: Mornings (8:00 AM to 9:59 PM) were popular with California, Delaware, and Pennsylvania residents, while evenings were favored by Pennsylvanians, Floridians, and Texans.
Understanding the in-store behavior of shoppers in each state will likely help Sprouts adapt its operations and staffing schedules as the company continues expanding in these markets.
Differences in the Composition of the Grocery Market in Each State
In addition to highlighting the variance between the shopping habits of Sprouts visitors across markets, diving deeper into the location intelligence data also reveals differences in the relationship between Sprouts shoppers and the wider grocery markets in each state.
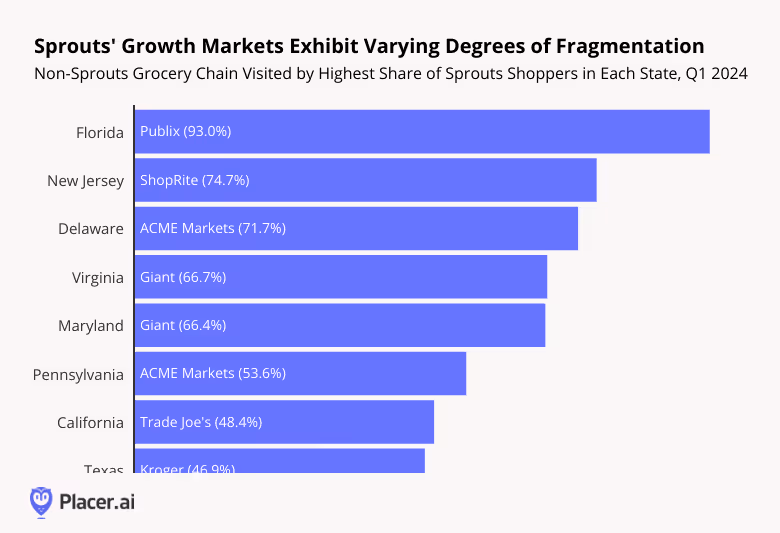
The chart below shows the most popular grocery alternative for Sprouts shoppers in each state (which other grocery chain was the most visited by Sprouts visitors) and what share of Sprouts shoppers visited that grocery chain in Q1 2024.
In Florida, over 90% of Sprouts shoppers also visited a Publix location in Q1 2024 – indicating that Sprouts in the Sunshine State is operating in a relatively consolidated grocery market and operating against an established crowd favorite. Meanwhile, only 46.9% of Texan Sprouts visitors also visited a Kroger – the other grocery chain most visited by Sprouts visitors – indicating that the Texas grocery market may be more fragmented, and so may respond to a different expansion strategy, than the Florida grocery market.
Sprouts’ Room to Grow
Sprouts strong visitation trends indicate that the grocery chain is expanding into willing markets, and the brand’s relatively affluent shopper base means that Sprouts is unlikely to be too impacted by whatever economic headwinds may lie ahead. As the chain continues making its presence felt in newer markets, location intelligence suggests that Sprouts has plenty of room to grow in 2024 and beyond.
For more data-driven retail insights, visit our blog at placer.ai.

About the Mall Index: The Index analyzes data from 100 top-tier indoor malls, 100 open-air shopping centers (not including outlet malls) and 100 outlet malls across the country, in both urban and suburban areas. Placer.ai leverages a panel of tens of millions of devices and utilizes machine learning to make estimations for visits to locations across the country.
Key Takeaways:
- Year-over-year visits to Indoor Malls, Open-Air Shopping Centers, and Outlet Malls continue to grow.
- Fewer visitors across all three formats are treating malls as a one-stop-shop – which may actually serve as a positive indicator of malls’ resilience in 2024.
Visits to Malls Up for Second Month in a Row
Shopping centers are making a comeback. Following an unusually cold January that impacted retail visit trends across the country, mall visits increased year-over-year (YoY) in February 2024 and rose even higher in March: Last month, traffic to Indoor Malls, Open-Air Shopping Centers, and Outlet Malls was up 9.7%, 10.1%, and 10.7% respectively, compared to March 2023.
The positive visitation trends along with the rising consumer sentiment numbers capping off the first quarter of 2024 bode well for retail in general and discretionary categories in particular – and may signal the end of the retail challenges that plagued much of 2022 and 2023.
.png)
Comparison to Pre-Pandemic Highlights Mall Comeback
Comparing Q1 visits to malls in 2021, 2022, 2023, and 2024 to Q1 2019 further highlights the positive trajectory of the ongoing mall recovery. The data reveals that the pre-pandemic visit gap has been steadily narrowing over the past four years across all shopping center formats. And in Q1 2024, visits to Open-Air Shopping Centers even exceeded 2019 levels for the first time since the lockdowns – indicating that retail has not yet fully settled into a “new normal” and the post-COVID recovery story is still being written.
.png)
Fewer Consumers Treat Malls Like a One-Stop-Shop
But even as mall visit numbers may be returning to pre-pandemic levels, analyzing the visitor journey for malls in Q1 2019 and Q1 2023 – which looks at where mall visitors were directly before and after their mall visit – indicates that some mall-based shopping habits have shifted.
Between Q1 2019 and Q1 2024, the share of shoppers coming to a mall directly from home or returning home directly following the mall visit decreased. And during the same period, the share of mall visitors coming from or going to dining venues or other retail locations before or after a mall visit generally increased across mall formats. The change in visitor journey between 2019 and 2024 indicates that more consumers are now visiting malls as one of multiple stops within a larger outing.
The fact that consumers are still visiting malls, even if they are no longer treating shopping centers like a one-stop-shop can be seen as another testament of malls’ resilience: Despite the string of big-name retailers expanding off-mall in recent years, shoppers continue incorporating malls into their shopping and dining routines – even as they expand their outing to add stops to off-mall shopping or dining locations as well.
.png)
Consumers Still Want Malls
Despite the years of mall apocalypse predictions, consumer behavior continues to showcase the central role that malls play in the U.S. retail landscape. And even as consumer habits change, top shopping centers have proven capable at adapting their offerings to current consumer appetites to maintain their relevance in 2024 and beyond.
For more data-driven retail insights, visit our blog at placer.ai.
This report includes data from Placer.ai Data Version 2.0, which implements improvements to our extrapolation capabilities, adds short visit monitoring, and enhances visit detection.

JOANN recently announced that it had filed for bankruptcy, and the company expects to go private as early as next month. Can the retailer still make a comeback? We dove into the data to find out.
JOANN’s Rollercoaster Trajectory Since 2019
JOANN went public in March 2021 – at the height of the pandemic – following a particularly strong 2020. The COVID-era crafting boom had put the company on a growth trajectory, with visits during the first year of the pandemic barely lower than in 2019 despite the lockdowns and movement restrictions. But as the country reopened and people’s schedules filled back up – leaving less time for sewing and knitting – visits began to fall. Foot traffic in 2021 was lower than in 2020, and by 2022, overall visits to the chain were 11.8% lower than they had been in 2019
But now, recent foot traffic data indicates that demand for fabric-related crafting supplies may be rebounding. In 2023, visits to the chain grew relative to 2022 and the visit gap relative to 2019 narrowed. Sewing appears to be making a comeback, with both millennials and Gen-Z exhibiting a newfound interest in the craft. And although the resurgence of interest in fiber arts was not strong enough to prevent JOANN’s recent bankruptcy filing, the YoY visit growth in 2023 indicates that the company should not be written off just yet.
.png)
JOANN is Pulling Ahead of the Competition
According to C.F.O. Scott Sekella, 95% of JOANN’s stores are cash-flow positive. The company is also committed to maintaining usual operations during the court-supervised procedure. And this year as well – especially since the end of early 2024’s cold spell – JOANN’s year-over-year (YoY) visits have trended positive, even outperforming YoY foot traffic to other leading crafting retailers.
%20(1).png)
Focusing on Growth Dayparts May Help JOANN Optimize In-Store Operations
The unique nature of JOANN’s products give the company’s brick-and-mortar stores an advantage over digital counterparts: Crafters like to get a feel for the material before purchasing, and amateur DIY-ers who visit physical stores can consult with expert salespeople to receive guidance for ongoing projects. And although foot traffic to JOANN’s stores is not what it was at the height of the pandemic, the YoY visit growth in 2023 indicates that the brand is still serving many committed sewers and knitters who are choosing to shop in-person. So how can JOANN maintain its store fleet while optimizing in-store operations?
Analyzing the change in hourly visits between 2022 and 2023 reveals that the YoY growth is not evenly distributed across dayparts. Morning and early afternoon visits saw modest increases, but traffic growth really ramped up in the afternoon and evening – peaking between 6:00 and 6:59 PM – and visits actually decreased between 7:00 and 8:59 PM. Should the company try to streamline its logistics without sacrificing its large store fleet, JOANN may focus its staffing and operational costs on the dayparts with the most growth potential and reduce expenditure during the less popular timeslots.
.png)
JOANN Well-Positioned To Thrive Post-Bankruptcy
Despite the crafting retailer’s current rough patch, location intelligence suggests that the company is a strong contender for a post-bankruptcy comeback. And the positive YoY trends also indicate that – despite the ongoing headwinds and contraction in discretionary spending – there is still demand for hobby-driven retail in 2024.
How will the bankruptcy proceedings impact foot traffic to JOANN? What does the rest of 2024 hold for the brand?
Check in with our blog at placer.ai to find out.
This blog includes data from Placer.ai Data Version 2.0, which implements improvements to our extrapolation capabilities, adds short visit monitoring, and enhances visit detection.

With rumors swirling of a potential Panera Bread IPO in 2024, we dove into the data to find out how the St. Louis, Missouri-based company is performing – and what sets Panera apart from its competition.
Panera Bread’s Foot Traffic on the Rise
Panera Bread has been on a growth spurt recently, with monthly visits over the past 12 months consistently exceeding 2022/2023 levels. Part of the traffic increase may be due to the brand’s larger store fleet – Panera expanded into urban and non-traditional markets with small-format locations focused on pick-up and digital ordering. And the company is not resting on its laurels, with Panera revamping its menu to compete more directly with meal-focussed fast casual concepts.
.png)
Panera Plays a Unique Role Within the QSR/Fast Casual Landscape
Because Panera straddles the line of coffee QSR and fast-casual lunch spot, there is no one dining chain that directly competes with Panera on all fronts. Instead, Panera plays a unique role in the QSR/fast casual landscape: The chain has a strong café feel, with the company’s “Sip Club” membership program seems specifically designed to appeal to customers looking for frequent coffee fixes. But Panera also offers more substantial fare, and the upcoming menu overhaul promises to add even more hearty salads and affordable sandwiches to its array of options.
The new menu may be aimed towards attracting more budget-conscious diners thanks to a focus on larger portions and the addition of several items priced at under $10. Some speculate that the changes are also part of the company’s broader refocusing towards the lunchtime daypart. Comparing Panera to Starbucks, which competes with Panera on the coffee shop and affordable foods front, and to Sweetgreen, a strong presence in the fast-casual lunch market, can shed light on Panera’s role within the increasingly competitive dining landscape.
Panera’s Visit Trends Reveal Its Appeal During All Day Parts
Panera’s hourly visitation pattern highlights its unique place within the wider QSR-fast casual landscape. Like Sweetgreen, Panera experiences a lunchtime foot traffic rush – 30.8% of daily visits to the chain take place between 12 PM and 2 PM. But Panera also receives almost a third of its visits before noon – 30.2% of visits to the chain take between 6 AM and 11 AM, compared to just 13.2% of visits to Sweetgreen. Between 9 AM and 11 AM, Panera’s hourly visit share of 20.8% is almost on par with Starbucks’ 25.3%. (The small number of morning Sweetgreen visits is likely also driven by a difference in opening hours, with most Sweetgreen locations only opening at around 10:30 AM).
Meanwhile, Panera also seems to be a strong dinner contender. Although Panera’s evening performance may not be quite as strong as Sweetgreen’s, the St. Louis-based dining chain still sees 17.3% of its daily visits between 6 PM and 8 PM – almost double Starbucks’ 9.8.%.
These hourly visitation patterns indicate that while a significant contingent of Panera patrons treat the chain as their go-to coffee shop, many others tend to consider Panera as a lunch or early dinner destination.
.avif)
Demographically, Panera’s Visitor Base is Most Similar to Starbucks’
Although analyzing hourly visitation patterns highlight similarities between Panera and Sweetgreen, focusing on the three chains’ visitor bases reveals many more similarities between Starbucks and Panera.
The median HHIs in Panera and Starbucks’ trade areas stand at $79.2K/year and $76.4K/year, respectively. Around 34% of both chains’ trade areas consist of non-family and one-person households and 28% consist of households with children. Meanwhile, Sweetgreen tends to attract a much larger share of affluent singles – 42.9% of households in Sweetgreen’s trade area are non-family and one person households, and the salad and grain-bowl focused chain has a trade area median HHI stands at $102K/year.
It seems, then, that although Panera appears to compete with Sweetgreen for the lunch rush – and to a lesser extent, for dinner visits as well – the two brands’ audience bases are substantially different. On the other hand, Panera’s visitor base seems to overlap significantly with that of Starbucks – which may explain Panera’s move towards enhanced portion sizes and affordable meal options, which may set it even further apart from the Seattle-based coffee giant.
.png)
Bright Future Ahead
Panera Bread is one of 2024’s most anticipated IPOs – and location intelligence metrics suggest that the buzz is well substantiated.
For more data-driven dining insights, visit our blog at placer.ai.
This blog includes data from Placer.ai Data Version 2.0, which implements improvements to our extrapolation capabilities, adds short visit monitoring, and enhances visit detection.

Family Dollar’s parent company Dollar Tree recently announced plans to dramatically rightsize the discount chain’s store fleet, with 600 stores slated for closure in 2024 and more to follow in upcoming years for a total of almost 1000 closures. We dove into the location intelligence for Family Dollar and three other leading value-forward retailers to understand which chain stands to benefit most from Family Dollar’s contraction.
Discount & Dollar Store Growth Bypassed Family Dollar
Dollar Tree’s plans to close almost 1000 Family Dollar stores did not surprise retail analysts. Discount & Dollar Stores have been on the rise in recent years, driven in part by significant expansions – visits to the industry up 25.4% in Q1 2023 and up 55.8% in Q4 2023 relative to pre-pandemic Q1 2019. But this growth seems to have bypassed Family Dollar. Q1 2023 visits to the brand were up just 0.8% and traffic during the critical holiday-driven Q4 2023 was up just 9.8% since Q1 2019.
Meanwhile, the eponymous banner of Family Dollar’s parent company Dollar Tree outperformed the wider industry during the same period, with a 28.4% increase in Q1 2023 visits and a 72.1% increase in Q4 2023 visits relative to a Q1 2019 baseline.
.avif)
Competition for the Visitor Base of Shuttered Family Dollars
The Discount & Dollar Store space includes major players like Dollar General and the Dollar Tree banner that can fill the voids left by shuttering Family Dollar Venues. Walmart also may step into some of the newly created gaps. Analyzing the demographic and psychographic composition of the trade areas of these four chains – Family Dollar, Dollar General, Dollar Tree, and Walmart – may reveal the chain(s) best positioned to cater to Family Dollar’s current visitor base.
Family Dollar and Dollar General Share Hourly Visitation Patterns
Most people have set daily shopping habits, and chains will likely have more success vying for Family Dollar’s visitor base if they can accommodate the current visitation patterns of Family Dollar shoppers.
Family Dollar and Dollar General respectively receive 37.0% and 37.9% of their daily visits between the hours of 5:00 PM and 8:59 PM. Meanwhile, only 31.2% of Dollar Tree’s visitors and 34.3% of Walmart visitors visited those chains in the late afternoon and evening. The similarities between Dollar General and Family Dollar’s visitation patterns may mean that Dollar General’s staffing and opening schedule is suited to handle the influx of former Family Dollar visitors without making these visitors modify their current shopping behavior.
.png)
Family Dollar Serves a Distinct Demographic Base
Analyzing the four chains by trade area median household income (HHI) also shows that Family Dollar is closer to Dollar General than to Walmart or Dollar Tree – but the data also reveals that Family Dollar serves a distinct demographic base. The chain has a potential market median HHI of $62.1K and a captured market median HHI of $48.3K – in both cases, the lowest trade area median HHI of the four chains analyzed.
Potential market analysis weighs the Census Block Groups (CBG) making up a trade area according to the number of residents in each CBG. The low median HHI in Family Dollar’s potential market means that the chain’s venues tend to be located in lower-income areas compared to the other chains’ store fleets.
Captured market median HHI reflects the median HHI in the CBGs making up a trade area weighted according to the number of visits to the chain from each CBG. And comparing the four chains indicates that the gap between Family Dollar and the other three chains is even larger when looking at the captured market median HHI, with Family Dollar serving the lowest income households within its potential market.
Still, Dollar General’s trade area median HHI is closest to that of Family Dollar – although Family Dollar’s trade area median HHI is still significantly lower than that of Dollar General – which could mean that Dollar General will be most attractive to Family Dollar’s former visitors.
.png)
But looking at other metrics suggests differences in household composition between Family Dollar and Dollar General. Although the potential market share of households with children is similar for the two chains, Family Dollar’s captured market share is higher while Dollar General’s captured market share of households with children is lower.
Family Dollar’s popularity among lower-income households with children may explain why the chain has been struggling in recent years, as this demographic has been particularly hard-hit by the recent economic headwinds. And this distinct demographic base may also mean that Dollar General might want to make some merchandising, pricing, or marketing adjustments to best serve Family Dollar’s former visitors.
.png)
Psychographic Similarities between Family Dollar and Other Discounters’ Visitor Base
Although the demographic composition of Family Dollar’s trade areas sets the chain’s visitor base apart, diving into the psychographic segmentation of the chain’s captured and potential market highlights similarities with other value-forward retailers.
All four chains analyzed seem particularly popular with rural audiences – specifically with the Rural Average Income and Rural Low Income segments as defined by the Spatial.ai: PersonaLive dataset. (Dollar General and Walmart also see a disproportionate number of visits from the Rural High Income segment within their potential markets.) So some of Family Dollar’s rural shoppers may already be visiting Walmart or Discount & Dollar Stores – and these other retailers may choose to open in areas where Family Dollar is closing and where no other discounter currently operates.
.avif)
The massive rightsizing of Family Dollar’s store fleet creates major opportunities for other value-driven retailers to expand their reach. Who will end up benefiting most from these shifts?
Check in with placer.ai to find out.
This blog includes data from Placer.ai Data Version 2.0, which implements improvements to our extrapolation capabilities, adds short visit monitoring, and enhances visit detection.

With the first round of earning announcements in 2024 coming to a close, we dove into the foot traffic data to find out which companies are likely to surpass their 2023 performance in the coming year.
1. Gap Maintains Minimal Visit Gaps Despite Store Closures
Following a challenging period and shifts in apparel consumer preferences hampering traffic, Gap’s performance is on the upswing. The company, which operates four iconic brands – Gap, Old Navy, Athleta, and Banana Republic – recently announced stronger-than-expected Q4 2023 results, driven by strong performances of the Gap and Old Navy brands.
Foot traffic data also points to a comeback. The Old Navy and Gap managed to maintain minimal year-over-year (YoY) visit gaps in 2023 despite the challenging retail environment, with Q4 visits – during the critical holiday season – down just 2.3% and 1.7% for the two brands, respectively.
Gap’s turnaround is likely helped by several C-suite personnel changes at the company. Last year, Gap Inc. brought in C.E.O. Richard Dickson from Mattel to revitalize the legacy brands, and Chris Blakeslee – previously at Alo Yoga – was chosen to lead the Athleta chain. And the company is continuing its series of high-profile hirings in 2024 with the appointment of designer Zac Posen as Creative Director of the company and Chief Creative Officer of the Old Navy banner. Should Gap continue on its current track, the company is well-positioned for a strong 2024.
.png)
2. The Cheesecake Factory’s Growth Potential
Monthly visits to The Cheesecake Factory fell YoY for much of last year, with the chain’s foot traffic regularly lagging behind the wider Restaurant category. But the gaps between the wider industry performance and visits to the brand began to narrow towards the end of the year, with The Cheesecake Factory beating out the overall Restaurant industry in terms of YoY traffic in December 2023. And although January 2024’s cold spell brought visits back down, foot traffic rose again in February 2024.
The chain has announced plans to expand its store count this year and intends to implement moderate price hikes to offset rising costs. And if the positive foot traffic trends continue alongside the company’s new unit openings and price increases, The Cheesecake Factory may well outpace its 2023 performance in 2024.
.png)
3. Petco On Track for a Rebound
The pet care sector thrived over the pandemic, as the combination of shelter-in-place orders, stimulus checks, and reduced spending channels drove consumers to shower their pets with love in the form of increased spending at pet stores. But the economic headwinds of the past two years led some shoppers to reduce their discretionary spending. Some consumers have gone as far as surrendering their pets in an effort to cut costs, with the tighter consumer budgets impacting visits to leading pet care retailers, including Petco. And to add to an already challenging situation, the pet care landscape has recently become even more competitive, with Walmart recently making more aggressive inroads into the space.
But Petco is fighting to stay on top, with the company continuing to invest in its veterinary program and optimize its product assortment to keep up with the changing preferences of 2024 consumers. And recent foot traffic data indicates that Petco’s strategy may be bearing fruit. Visits to Petco grew 1.8% and 4.0% YoY in November and December 2023, respectively – indicating that many pet owners still splurged on holiday gifts for their beloved pets and turned to Petco for the perfect treat or toy. And although January 2024’s unusual cold spell drove a visit lag, foot traffic quickly stabilized in February – indicating that the company should not be written off quite yet.
.png)
For more retail and dining insights, visit our blog at placer.ai.
This blog includes data from Placer.ai Data Version 2.0, which implements improvements to our extrapolation capabilities, adds short visit monitoring, and enhances visit detection.

