


.svg)


Discount and Dollar Stores specialize in bargain discretionary offerings –but their role as go-to destinations for essentials is not to be overlooked. We dove into the data for Dollar General, Dollar Tree, and Five Below to find out what drove their success in 2024 and what may lie ahead for the chains in 2025.
Expanding Footprints
In 2024, Dollar General, Dollar Tree, and Five Below continued to expand their real estate footprints, contributing to the chains’ YoY visit growth.
Since the start of H2 2024, all three chains saw consistent monthly visit increases compared to the previous year, contributing to overall YoY traffic increases of 5.1%, 5.2%, and 12.8% for Dollar General, Dollar Tree, and Five Below, respectively. And the visit growth has continued in 2025. (The February 2025 minor visit YoY gap for Dollar General can be attributed to the calendar shift and comparison to a 29-day February in 2024).
As Dollar General, Dollar Tree, and Five Below plan to continue investing in their physical footprints in 2025 by adding stores and remodeling existing ones, visits are likely to continue on a growth trajectory.
More Frequent Visitors
Diving into the consumer behavior of visitors to Dollar General, Dollar Tree, and Five Below reveals that at least some of the chains’ visit growth could be due to an increase in repeat visits.
Since Q1 2023, Dollar General, Dollar Tree, and Five Below’s average visits per visitor have steadily increased compared to the previous year. In other words, the chains’ visitors are visiting more frequently than they did in the past.
This pattern may be driven by consumers’ continued prioritization of value – a trend that doesn’t look to be abating in the near-term.
More Weekday Visits
Discount and dollar stores have long been hailed as treasure hunt destinations for non-necessities, but drilling down to the daily visit date reveals that consumers may be turning to these retailers for more daily essentials.
In 2024, Dollar General, Dollar Tree, and Five Below’s shares of weekday visits (Monday-Thursday) increased compared to 2023. And Five Below, perhaps best-known for its discretionary offerings in mostly durable goods categories, saw the largest boost in weekday visits of the three chains (from 45.1% in 2023 to 46.4% in 2024). This could be evidence of growing demand in the retailer’s consumable categories like snacks, health, and beauty – essential products that consumers might need to replenish mid-week.
And in part to meet the demand for everyday essentials, Dollar General, Dollar Tree, and Five Below have expanded product assortments – perhaps positioning themselves for continued weekday visit growth.
Dollar and Discount in 2025
Dollar General, Dollar Tree, and Five Below’s success in 2024 was likely driven by a variety of factors including expanding store networks, consumers’ focus on value, and the rising demand for essentials. As these trends are likely to prevail in 2025, discount and dollar chains appear poised to sustain foot traffic growth.
For more data-driven retail insights, Visit Placer.ai.

Two of the biggest sporting events of the year – the Super Bowl and the Daytona 500 – took place in February 2025. We dove into the location analytics and demographic characteristics of visitors for both events to find out who attends the Big Game and the Great American Race.
Super Bowl Demographics
Super Bowl tickets aren’t cheap, and combined with elevated travel costs, attending the game comes with a hefty price tag. So it may be no surprise that “Ultra Wealth Families” – Spatial.ai: Personalive segment for the nation’s wealthiest households – are consistently the largest segment within the stadiums’ captured markets* on game day. The same trend persists for NFL’s conference championships, indicating that regardless of the region in which the biggest games are played, fans in attendance come from relatively similar, affluent households.
*A venue’s captured market is derived by the census block groups (CBGs) from which the venue draws its visitors, weighted by the share of visits from each, and thus reflects the population that actually visits the venue.
Daytona 500 Demographics
Visitors to the Daytona 500, it seems, are a more diverse cohort. Although the race is the most prestigious in NASCAR, tickets are available at price-points that suit a variety of budgets. And analyzing the visitor base of Daytona International Speedway on race day in 2025 reveals that the event’s relative affordability seemed to have attracted visitors from all walks of life: The venue’s trade area included a wide range of psychographic segments – ranging from the wealthiest families to retirement-age folks on a budget – demonstrating the diversity of the audience in attendance.
Where Do Super Bowl and Daytona 500 Visitors Come From?
Analysis of the 2025 Super Bowl and Daytona 500’s trade areas, which reflect the regions from which the venues received visitors on the day, reveals other key differences between the events’ attendees.
As was the case for previous Super Bowls, the 2025 Super Bowl at the Caesars Superdome in New Orleans, LA drew visitors from the country’s major metro areas – and from some of the wealthiest – including New York City, Los Angeles, San Francisco, and Miami. The trade area also revealed elevated attendance from the teams’ home regions – Kansas City, MO and Philadelphia, PA – likely by the squads’ die-hard fans, and robust visitation from the host region (the New Orleans area), as local football fans appeared to take advantage of the opportunity to attend a Super Bowl close to home.
The 2025 Daytona 500's trade area, however, revealed a more tilted regional distribution of visitors. Although the event did draw fans from all over the country, most of the Daytona International Speedway attendees came from the Eastern United States, and Florida in particular – which hosts the race every year. This suggests that while the Daytona 500 attracts visitors from all over the country, the event is particularly popular among locals.
Want more data-driven event insights? Visit Placer.ai.

Department stores continue to adapt to evolving consumer preferences and an ever-changing retail landscape. We looked at the latest location analytics for traditional and luxury department stores to uncover how they are finding success in today’s dynamic apparel space.
Off-Price Poses a Challenge
Consumers’ prioritization of value has significantly impacted the apparel space in recent years.
Fueled by tepid consumer confidence and rampant inflation, demand for off-price has soared, putting pressure on department stores and traditional apparel retailers. As a result, off-price’s share of total visits to the apparel space steadily increased between 2021 (36.4%) and 2024 (41.5%), while the visit shares of our traditional department stores and other apparel segments declined.
But luxury department stores, which serve a higher-income clientele, appear to have remained relatively insulated from the rise in budget-conscious shopping, as the relative share of visits to this segment held steady over the past four years.
Leaning into Value
Diving into cross-visitation trends also reveals the impact of a growing off-price segment on the department store space.
Between 2021 and 2024, the share of both Nordstrom’s and Dillard’s visitors that also visited one of the leading off-price chains increased – suggesting that shoppers at both traditional and premium department stores feel the draw of off-price apparel. (Still, the shares of Dillard’s visitors that also visited one of the off-price chains was generally larger than that of Nordstrom’s, suggesting that visitors to the more upscale department store were less inclined to also visit an off-price store.)
And it seems that leading department stores are already trying to meet the growing demand for discounts within their consumer base. Dillard’s emphasis on private-label merchandise helps keep products affordable without compromising quality. Meanwhile, Nordstrom continues to expand its off-price format – Nordstrom Rack – to capitalize on demand for value in the apparel space.
Delivering on Experience
Still, value-seeking behavior on the part of the consumer doesn’t always mean prioritization of discounts, and one way that several department stores are adding value – and finding success – is by investing in the shopping experience.
Bloomingdale’s emphasized experiential events and exclusive product launches to engage consumers last year, including several pop-culture-inspired collections. The department store’s visits increased 1.5% YoY in 2024, perhaps reflecting the demand for Bloomingdale’s immersive and culturally relevant environment.
Meanwhile, Nordstrom’s digital strategy demonstrated how a seamless omnichannel platform can elevate the shopping experience. The brand’s new app uses generative AI to make personalized style recommendations and allows users to check merchandise availability or make a stylist appointment at their local store. The app’s pre-holiday release may have contributed to Nordstrom’s resounding success in 2024, including a 2.2% visit increase compared to 2023.
And the investments in in-store experiences yielding visit dividends are not limited to premium chains. Dillard's, often considered a mid-range brand, has expert stylists ready to assist, and carefully manages inventory so stores are well-stocked but clutter-free, cultivating a classy retail environment. Dillard’s saw 2.3% YoY visit growth in 2024, indicating that its in-store experience is highly valued by shoppers.
The Department Store Opportunity
Department stores are uniquely positioned to thrive in the current apparel retail landscape. Faced with demand for lower price points, department stores can harness the opportunity with affordable private-label merchandise or off-price formats. And while value-seeking is on the rise, retailers that provide an elevated shopping experience add a different kind of value to their brand.
For more data-driven retail insights, visit Placer.ai.
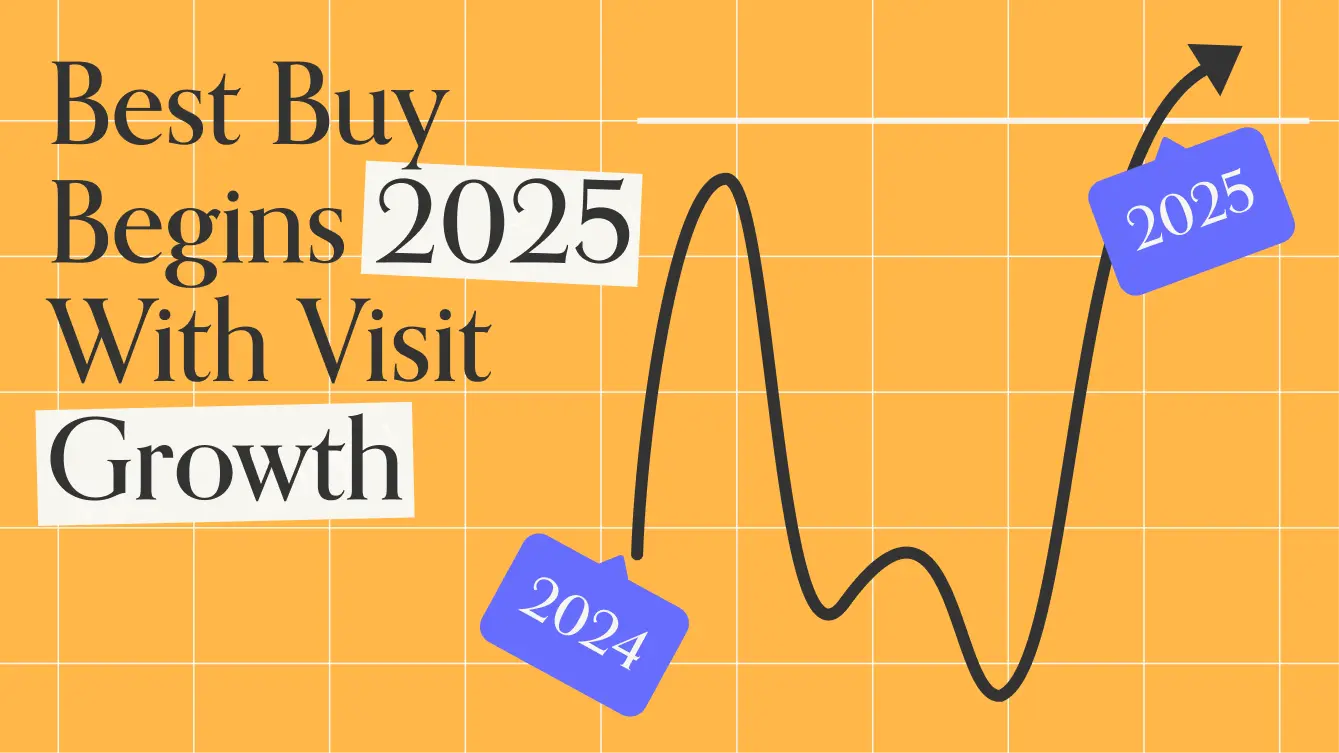
Best Buy has long been a go-to destination for consumers looking for the latest tech – but like many retailers, it has faced challenges in recent years. We dove into the data to explore the latest visitation trends for Best Buy and the demographics of visitors that are driving traffic to the chain.
Best Buy Bounces Back
Best Buy’s visits lagged in 2024 (7.0% below 2023 levels), but the company continues to invest in a real estate strategy aimed at improving consumer engagement. To leverage its store fleet most efficiently, Best Buy is closing traditional large-format stores while opening smaller-format ones to provide a tailored experience to consumers – often in small and midsized markets previously untapped by the retailer.
And Best Buy may already be reaping the benefits of this strategy; in January 2025, the retailer received a 0.4% YoY boost in foot traffic. As the chain continues to optimize its real estate footprint, it could be on track to drive more visit growth in the near future – particularly as more shoppers replace consumer electronics purchased during the pandemic.
Daily Holiday Spikes
Drilling down to daily visitation over the holiday season further highlights Best Buy’s momentum going into 2025. Best Buy consistently drives traffic during critical retail moments, and 2024 was no exception.
On Black Friday 2024, the retailer saw a 473.1% visit boost compared to the daily average for 2024. And the foot traffic surge continued the following day (Black Saturday, 162.4%) as consumers likely continued to take advantage of the weekend’s discounts.
And as was the case in previous years, Best Buy’s traffic picked up as Christmas 2024 neared, with significant visit spikes on Super Saturday (199.0%), Panic Sunday (151.3%), and Christmas Eve Eve (171.7%). Best Buy also saw elevated traffic post-Christmas traffic on Boxing Day (128.0%), when consumers likely looked to exchange gifts or set up their new tech with the help of the renowned Geek Squad.
Plugging in to Family Foot Traffic
Of course, Best Buy is more than just a holiday shopping destination. And analysis of audience segmentation for the retailer reveals that families are overrepresented in the chain’s captured* market relative to its potential* market – indicating that this segment in particular drives significant traffic year-round.
According to the AGS: Demographic Dimensions dataset, in 2024, the average household size in Best Buy’s potential market was 2.49 people compared to 2.64 people in the chain’s captured market. Married couples with children were also more heavily represented in the chain’s captured market (33.4%) compared to its potential market (32.0%), suggesting a relatively larger share of visitors from family households among Best Buy’s visitors.
Further analysis of audience segments within the chain’s captured and potential markets indicates that visitors from a variety of family types are drawn to Best Buy. According to the Spatial.ai: PersonaLive dataset, residents belonging to the “Wealthy Suburban Families”, “Upper Suburban Diverse Families”, “Near-Urban Diverse Families”, and “Blue Collar Suburbs” segments were all over-represented in Best Buy’s captured market compared to its potential market. This suggests that visitors from different types of family households – working-class, wealthy, urban, and suburban – are driving traffic to Best Buy.
Perhaps families are drawn to Best Buy’s expanding experiential format, where visitors of all ages can get hands-on with LEGO and explore home theater set ups worthy of a family movie night.
*A chain or venue’s potential market is derived by the census block groups (CBGs) from which the retailer draws its visitors weighted by the population size of each, whereas a captured market is derived from the same CBGs weighted by the share of visits from each, and thus reflects the population that actually visits the chain or venue.
The Best is Yet to Come
Best Buy’s ability to drive traffic through strategic store formats, holiday shopping surges, and family households highlights the company’s ongoing relevance in the evolving consumer electronics landscape. With early signs of a foot traffic resurgence, Best Buy appears to have positioned itself for continued success in 2025.
Want more data-driven retail insights? Visit Placer.ai.

The off-price apparel space remains well-positioned as consumers continue to favor budget-friendly retailers. We dive into the latest location intelligence for the space – and category leaders Burlington, Marshalls, Ross Dress for Less, and T.J. Maxx – to explore how the segment closed out 2024 and started off in 2025.
Increased Visitation to Off-Price Leaders
The leaders of the off-price apparel space – Burlington, Marshalls, Ross Dress for Less, and T.J. Maxx – drove the success of the category last year. In 2024, Burlington’s visits increased (7.9%), as did visits to Marshalls (5.3%), Ross (0.7%) and T.J. Maxx (4.9%).
Zooming into H2 2024 reveals that Burlington, Marshalls, and T.J. Maxx saw consistent YoY visit growth. And although Ross Dress for Less saw mild visit gaps for some of the period, all four off-price apparel chains analyzed started the new year on a high note with January 2025 visits up across the board compared to the previous year.
Marmaxx, Ross, and Burlington expanded their real estate footprints in 2024 – likely contributing to the chains’ YoY visit increases. And all four retailers’ have plans to continue their expansion strategies in the coming years – putting them on a foot traffic growth trajectory for 2025.
Off-Price Tips the Scales
The foot traffic growth of Burlington, Marmaxx, and Ross plays a significant role in the success of the off-price category, which has steadily increased its share of total apparel visits.
In Q4 2024, the off-price apparel category claimed a majority of the combined off-price and our traditional apparel category visits (51.9%) for the first time since at least 2019. This demonstrates the segment’s strong holiday performance and continued resilience in the face of economic headwinds for both consumers and retailers.
Regional Paths to Success
Diving deeper into the foot traffic for Burlington, Ross, Marshalls, and T.J. Maxx highlights robust nationwide visits as well as several regional preferences among consumers.
Nationwide, Ross claimed the lion’s share of visits between the four chains in Q4 2024 (31.0%), followed by T.J. Maxx (28.0%), Marshalls (23.1%), and Burlington (17.9%).
Analysis of the chains’ share of visits by CBSA reveals that Ross claimed the greatest share of visits in a majority of the West and Southwest, as well as in many large metropolises. Meanwhile, T.J. Maxx appeared to be the most-visited brand in many CBSAs throughout the Eastern United States, while Marshalls appeared to be the preferred brand in the Mid-Atlantic.
And despite claiming 17.9% of combined visits to the four off-price apparel chains, Burlington received the largest share of visits in only two CBSAs – Midland, TX and Anchorage, AK, which could be due to the brand’s long-term smaller-format strategy. While a smaller-format store may have less physical real estate (and therefore visitor potential) than the typical Marmaxx and Ross location, it affords Burlington the flexibility to source locations with strong economics that can drive productivity for the brand in markets nationwide.
All four brands have a robust presence nationwide, yet regional preferences and variations in real estate footprints highlight the different paths to success in the off-price space.
Taking Off
The off-price apparel segment is thriving in 2025, with Burlington, Marshalls, Ross, and T.J. Maxx leading the charge. Consumers continue to prioritize value, fueling steady foot traffic growth and cementing off-price retailers as key players in the apparel space. Each brand is carving out its own regional strongholds while expanding its footprint, setting the stage for even greater success in the year ahead.
Want more data-driven insights? Visit Placer.ai.

CAVA and sweetgreen have been rapidly expanding, cementing their place in the fast-casual dining landscape. We dive into the data to take a closer look at CAVA and sweetgreen’s foot traffic performance and uncover the seasonal visitation patterns driving appetite for these fast-growing chains in 2025.
Expanding Footprints
CAVA and sweetgreen are still firmly in expansion mode, with new store openings fueling their foot traffic growth. Last quarter, CAVA reported a 21.4% year-over-year (YoY) increase in total restaurants and currently boasts nearly 380 locations. And in the past year, sweetgreen has opened dozens of new venues, growing the chain’s footprint to over 900 locations.
Through H2 2024 and the start of 2025, CAVA and sweetgreen experienced consistent YoY visit growth – outperforming the fast-casual restaurant category every month. CAVA’s significantly larger visit growth (26.9% compared to sweetgreen’s 9.9% YoY in Q4 2024) was likely due to the proportional impact of new restaurant openings on CAVA’s smaller real estate footprint.
As CAVA and sweetgreen continue to expand, 2025 is likely to be another year of sustained growth for both restaurants.
Daytime Dining
Analyzing seasonal visit trends can reveal some of the factors driving sweetgreen and CAVA’s success.
Fast-casual restaurants generally receive more of their visits during lunch than during dinner. And CAVA and sweetgreen received an even larger share of lunchtime (12 PM to 3 PM) visits than the fast-casual average – indicating that these restaurants’ lunchtime popularity is likely a major growth driver.
CAVA also received the highest dinner (between 6 PM and 9 PM) visit share. This indicates that despite CAVA’s fast-casual designation, consumers seem to treat it more like a full-service restaurant, with patrons visiting the chain to eat a proper meal and not just to grab a convenient bite between errands. And the company’s recently launched loyalty program may well bring even more lunch and dinner visits to the chain in 2025.
Meanwhile, sweetgreen’s dinner visit share remained at or below the fast-casual average throughout the year. But evening traffic to the salad chain did increase during the warmer months – hitting a high of 27.4% between July and October – perhaps due to consumers remaining out and about later when there were more daylight hours. Consumers generally spend significantly more on dinner out than on lunch, so sweetgreen may want to fuel its warm-weather dinner boost by offering specials or promotions to attract even more evening patrons to its locations during Q2 and Q3. Sweetgreen may also choose to incorporate time-dependent ordering incentives into its new loyalty program to encourage more evening visits throughout the year.
Winter Weekends
Further analysis of visitor behavior reveals that CAVA and sweetgreen drive a significant share of weekend visits. And while sweetgreen’s dinner boost tends to occur in Q2 and Q3, both sweetgreen and CAVA’s weekend visit share increases in Q1 and Q4.
At least some of the elevated weekend visits in Q4 2024 may have been due to the many consumers that were on vacation – eating fewer mid-week meals out of the house – or grabbing a bite while doing their holiday shopping on Saturday and Sunday. Still, elevated weekend traffic in Q1 indicates that the chains have the potential to drive significant traffic during other cold-weather months on days when consumers have more time for recreation.
CAVA’s continued investment in inviting dining rooms – part of the chain’s “Project Soul” campaign – may attract unhurried diners looking to experience a cozy ambiance, while sweetgreen’s early-stage rollout of the robotic “Infinite Kitchen” may actually elevate the indoor dining experience to one that is fun and weekend-worthy.
Fresh Take
As sweetgreen and CAVA pursue various strategies in their next phase of growth, an understanding of consumer behavior can help the chains maximize the potential of their robust visitor bases and enhance operational efficiency.
Want more data-driven dining insights? Visit Placer.ai.

Digging Into Dining
The dining industry showcased its agility over the past couple of years as it rapidly adapted to shifts in consumer preference brought on by COVID and rising prices. And with a new year around the corner, the pace of change shows no signs of slowing down.
This white paper harnesses location analytics, including visitation patterns, demographic data, and psychographic insights, to explore the trends that will shape the dining space in 2024. Which dining segments are likely to pull ahead of the pack? How are chains responding to changes in visitor behavior? And where are brands driving dining foot traffic by taking advantage of a new advertising possibility? Read on to find out how dining leaders can tap into emerging trends to stay ahead of the competition in 2024.
Stepping Up To The Plate
Comparing quarterly visits in 2023 and 2022 highlights the impact of the ongoing economic headwinds on the dining industry. The year started off strong, with year-over-year (YoY) dining visits up overall in Q1 2023 – perhaps aided by the comparison to an Omicron-impacted muted Q1 2022. And while overall dining growth stalled in Q2 2023, several segments – including QSR, Fast Casual, and Coffee – continued posting YoY visit increases, likely bolstered by consumers trading down from pricier full-service concepts.
Foot traffic slowed significantly in Q3 2023 as inflation and tighter consumer budgets constrained discretionary spending. Overall dining visits fell 2.4% YoY, and full-service restaurants – with their relatively high price point compared to other dining segments – seemed to be particularly impacted by the wider economic outlook. But the data also revealed some bright spots: Fast Casual still succeeded in maintaining positive YoY visit numbers and Coffee saw its Q3 visit grow an impressive 5.4% YoY. As the return to office continues, a pre-work coffee run or lunchtime foray to a fast-casual chain may continue propelling the two segments forward.
Shifting Demographics and Shifting Dining Behavior
Restaurant visitation patterns have evolved over the past few years. Although an 8 PM seating was once the most coveted slot at fine-dining restaurants, recent visitation data suggests that sitting down to dinner earlier is rising in popularity.
But among the QSR segment, the opposite trend is emerging, with late-night visits rising. Analyzing hourly foot traffic to several major QSR chains reveals that the share of visits between 9 PM and 12 AM increased significantly between Q3 2019 and Q3 2023. Even Taco Bell – already known for its popularity among the late-night crowd – saw a substantial increase in late-night visits YoY – from 15.4% to 20.3%.
Younger Customers Staying Out Later
Who is driving the late night visit surge? One reason restaurants have been expanding their opening hours is to capture more Gen-Z diners, who tend to seek out nighttime dining options. But location intelligence reveals that younger millennials are also taking advantage of the later QSR closing times.
An analysis of the captured market for trade areas of top locations within one of Taco Bell’s major markets – the Chicago-Naperville-Elgin, IL-IN-WI Metropolitan area – reveals a year-over-four-year (Yo4Y) increase in “Singles & Starters.” The “Singles & Starters” segment is defined by Experian: Mosaic as young singles and starter families living in cities who are typically between 25 and 30 years old. As consumers continue to prioritize experiential entertainment and going out with friends, late-night dining may continue to see increased interest from young city-dwellers.
Smoothies Drive Weekend Visits
Millennials and Gen-Z consumers aren’t only heading to their favorite fast food joint for a late-night bite – these audience segments are also helping drive visits on the weekends. Smoothie King is one chain feeling the benefits of young, health-conscious consumers.
The chain, which opened in New Orleans, LA, in 1973 as a health food store, has since grown to over 1,100 locations nationwide and is currently expanding, focusing on the Dallas-Fort Worth CBSA. The area’s Smoothie King venues have seen strong visitation patterns, particularly on the weekends – weekend visits were up 3.4% YoY in Q3 2023. The smoothie brand’s trade areas in the greater Dallas region is also seeing a YoY increase in weekend visits from “Young Professionals” – defined by the Spatial.ai PersonaLive dataset as “well-educated young professionals starting their careers in white-collar or technical jobs.”
Sports and Dining - Match Made in Heaven
While some dining chains are appealing to the late-night or weekend crowd, others are driving visits by appealing to sports lovers. How have recent rule changes around student athletes changed the restaurant game, and how can college football teams drive business in their hometowns?
Scoring Big: Leveraging Fan Insights to Fuel Successful Partnerships
College sports have long been a major moneymaker, with top-tier teams raking in billions of dollars annually. And as of 2021, college athletes can enjoy a piece of the significant fan following of college sports thanks to the change in the NCAA’s Name, Image, and Likeness (NIL) rules, which now allows student athletes to sign endorsement deals.
Since then, multiple restaurants have jumped on the opportunity to partner with student athletes, some of whom have millions of followers on Instagram and TikTok. Chains like Chipotle, Sweetgreen, Slim Chickens, and Hooters have all signed college athletes to various brand deals.
How can brands ensure they partner with athletes their customers will want to engage with? Analyzing a chain’s audience by looking at the interests of residents in a given chain’s trade area can reveal which type of athlete will be the most attractive to each brand’s customer base. For example, data from Spatial.ai: Followgraph provides insight into the social media activity of consumers in a given trade area and can highlight desirable partnerships.
Examining the trade areas of Chipotle, Sweetgreen, Slim Chickens, and Hooters, for instance, reveals that Sweetgreen’s visitors tended to have the largest share of Women’s Soccer followers. Conversely, Sweetgreen’s trade area had lower-than-average shares of College Football Fans or College Basketball Fans, while residents of the trade areas of the other three chains showed greater-than-average interest in these sports. Leveraging location intelligence can help companies choose brand deals that their customers resonate with and find the ideal athletes to represent the chain.
College Gameday - Wins for Dining
Finding the right college athlete partnership is one way for dining brands to appeal to college sports enthusiasts. But dining chains and venues located near major college stadiums also benefit from the popularity of their local team by enjoying a major game day visit boost.
One of the country’s most popular college football teams, the Ohio State Buckeyes, can draw millions of TV viewers, and its stadium has a capacity of 102,780 – one of the largest stadiums in the country. And while tailgating is a popular activity for Buckeyes fans, nearby restaurants are some of the biggest beneficiaries of the college football craze. Panera experienced a 235.3% increase on game days as compared to a typical day, Domino’s Pizza visits grew by 283.3%, and Tommy’s Pizza, a local pie shop, saw its visits jump by a whopping 600.9%.
Game Day Visitor Spikes
This influx in diners also causes a major shift in game day visitor demographics, as revealed by changes in visitors at dining venues located near stadiums of two of the nation’s best college football teams – the Ohio State Buckeyes and Ole Miss Rebels. Based on Spatial.ai: Personalive data for the captured market of these dining venues, game day visitors tended to come from “Ultra Wealthy Families” when compared to visitors during a typical non-game day in September or October.
The analysis indicates that popular sporting events create a unique opportunity for restaurants near college stadiums to attract high-income customers game day after game day, year after year.
Subwars: Room for Everyone
While some spend game day tailgating or visiting a college restaurant, others hold a viewing party – with a six-foot submarine. And the sub’s popularity extends beyond Superbowl Sundays. Sandwich chains including Jersey Mike’s, Firehouse Subs, Jimmy John’s, and Subway (recently purchased by the same company that owns Jimmy John’s) have seen sustained YoY increases in visits and visits per venue in the first three quarters of 2023.
Some of the growth to these chains may be related to their affordability, a draw at all times but especially during a period marked by consumer uncertainty and rising food costs. And subway leaders seem to be seizing the moment and striking while the iron is hot – Jersey Mike’s opened 350 stores in 2023 and still saw its YoY visits per venue grow by 6.6%. And Subway reported ten consecutive quarters of positive sales, a promising sign for its new owner.
Sandwich Chains Attract a Wide Consumer Base
The love for a healthy, affordable sandwich extends across all income levels, with all four chains seeing a range in their visitors' median household income (HHI). Out of the four chains analyzed, Jersey Mike’s – which has long prioritized a suburban, middle-income customer – had the highest trade area median household income of the four chains at $77.3K/year. Subway, known for its affordability, had the lowest, with $62.9K/year. The variance in median HHI combined with the strong foot traffic growth shows that when it comes to sandwiches, there’s something for everyone.
So What’s The Dining Space Cooking Up?
Persistent inflation and declining consumer sentiment may pose serious challenges for the dining space, but emerging trends are helping boost some restaurants. Customers seeking out a late-night bite drive visits to QSR chains, and health-conscious diners are boosting foot traffic to smoothie bars and sandwich shops. Meanwhile, sports sponsorships and game-day restaurant visits can provide a boost to dining businesses that take advantage of these opportunities.

