


.svg)


Brick-and-mortar retail continues to evolve – and while consumers have always turned to physical commercial spaces to gather, shop, eat, and be entertained, we predict that 2025 will be the year of brick and mortar stores as Brand Amplifiers. What do we mean by that? Simply put, the more we have options to do things online – be it shop, communicate, work, or play – the more we also crave the opportunity to do these things in the physical world, and brick and mortar is at the center of making these experiences larger than life. It’s no surprise, then, that even digitally native Gen Z is still regularly visiting physical stores.
We’ve written extensively about the importance of brick-and-mortar locations for digital brands and of standalone boutiques for wholesale brands – within the four walls of a branded store, marketers have the ability to control the narrative. From the visual merchandising to the customer associate, the brand’s personality and DNA can really come to life.
The recent Meta Popup Lab on Melrose Ave in the West Hollywood Design District – created to test its Ray-Ban smart glasses – offers a great example of brick and mortar’s potential to amplify digital brands and make them come to life. While the venue only opened for a little under two months, visitation data and audience profile analysis reveals the consumer demand for the experience as well as the brand amplification value that Meta received from the pop up.
Meta Popup Lab Drew Significant Weekend Visits
Weekends tend to be the most popular recreation days, as that’s when most people have free time to shop and explore. And looking at visitation patterns shows that this trend held true at the Meta Popup Lab and in the wider Design District retail corridor in which the pop up was operating. But the Meta Popup Lab actually received a larger share of its visits on Saturdays and Sundays compared to the wider shopping corridor – indicating that visitors were dedicating precious weekend time to visit the pop up and make sure they could get the full Meta experience without feeling rushed by their various weekday constraints.
Most Visitors Stayed Long Enough to Make a Purchase Decision
Diving into the visit duration at Meta Lab reveals that over a quarter of visits lasted between 15-29 minutes, and roughly 1 in 6 lasted 30-44 minutes. That time frame is enough to try on some frames, speak to a customer associate, and make a purchase decision.
Young and Affluent Visitor Base
Meta Lab also drew more visitors from trade areas with higher income and smaller households compared to the wider West Hollywood Design District. This indicates that, as may be expected, Meta Lab attracted a relatively young and affluent audience – tech-savvy visitors with the disposable income to spend.
Physical Pop Ups Bring Digital Brands to Life
The success of the Meta Popup Lab underscores the potential of brick-and-mortar spaces as brand amplifiers, transforming digital concepts into immersive, tangible experiences. As consumers continue to seek deeper connections with brands, physical retail offers a unique opportunity to engage, educate, and excite in ways that digital alone cannot. In an era where online and offline worlds are increasingly intertwined, brands that strategically leverage physical spaces will stand out by creating lasting impressions that go beyond the screen.
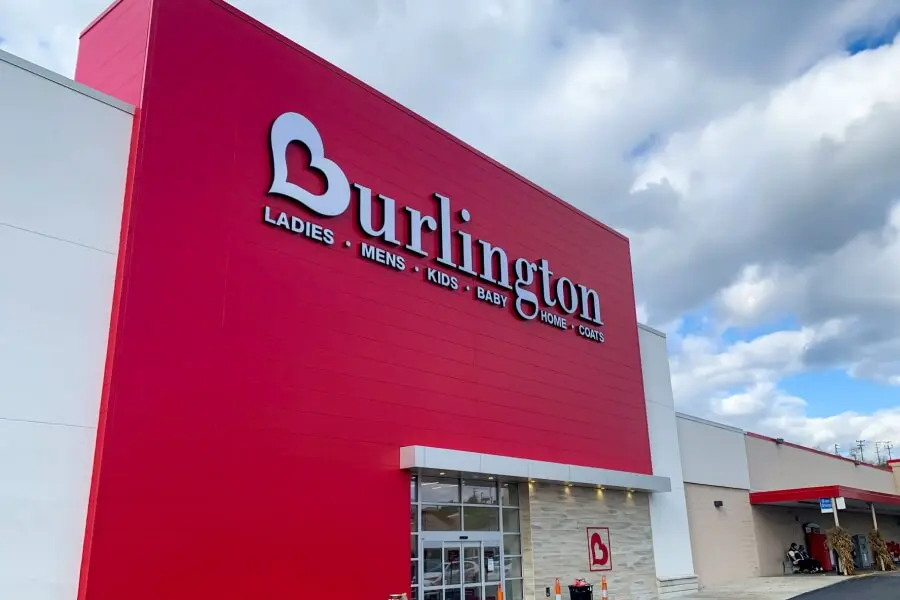
They say that one man’s trash is another one’s treasure – and for Burlington Stores, opportunity knocked when Bed Bath & Beyond selected Burlington Stores as the successful bidder for many of its leases, with the latter taking over 44 locations for $12 million. Per CNBC, many of these new venues are scattered across the country.
Using Placer data, we are able to compare visitation trends to these locations when they were branded as a Bed Bath & Beyond store versus when the new leases took over.
In Avondale, AZ, the new Burlington store is receiving over twice the traffic (241.8% more visits per square foot) during the holiday shopping season in December 2024 compared to a similar time frame when it was a Bed Bath & Beyond in December 2021.
In comparing shopping center frequented by visitors to the analyzed venue, the profile of the shopper has changed somewhat. While both sets of shoppers frequented the nearby Gateway Crossings, Westgate Entertainment District, and Arrowhead Towne Center, Burlington shoppers had a penchant for Desert Sky Mall and Tanger Outlets Phoenix, whereas the Bed Bath & Beyond shoppers preferred Palm Valley Pavillions West and Coldwater Plaza.
Whereas the top four segments have remained consistent for both banners, Burlington attracts a higher proportion of Melting Pot Families - over 2x the rate compared to when it was a Bed Bath & Beyond.
In a head to head comparison using comparable months, Burlington attracted over 3x the traffic in its first year of opening, compared to when it was a Bed Bath and Beyond two years prior.
The number of visits across numerous visit durations was considerably higher to Burlington, and the average dwell time increased to 41 minutes compared to 31 minutes when it was a Bed Bath & Beyond.
While this is just one example of a Burlington takeover, it goes to show that while the location may stay the same, the audience it attracts will vary and this Burlington is off to an excellent start.
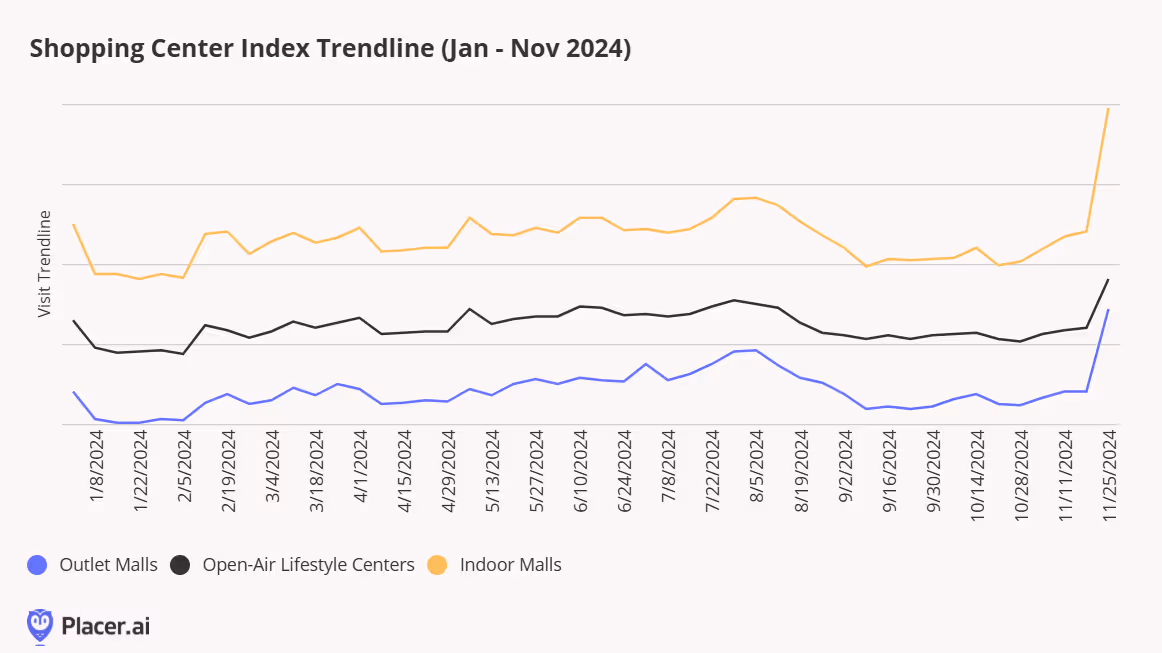
Holiday shoppers in November 2024 turned out in greater numbers than last year, particularly at malls. Following a strong spring and summer year-over-year performance (despite April having one fewer weekend and Easter falling in March, as well as July having one less weekend than 2023), and a weaker early fall, it seems many consumers held off on their mall visits until November.
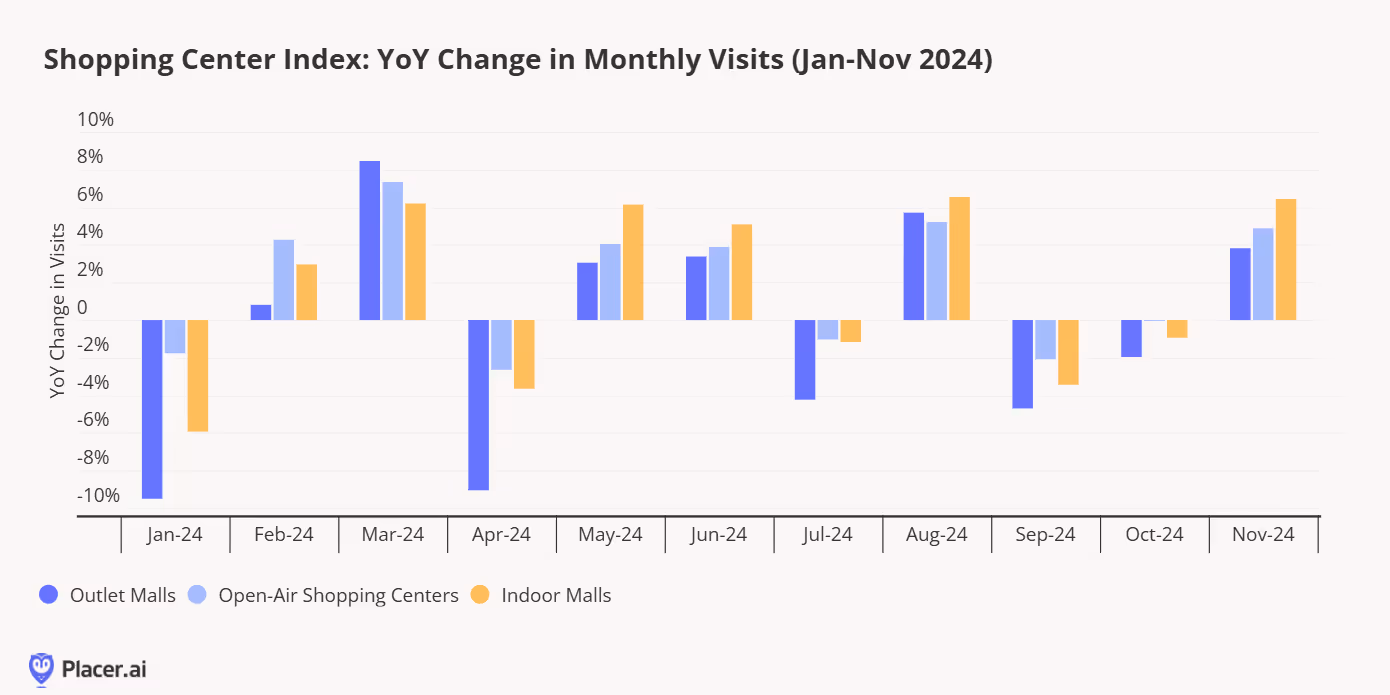
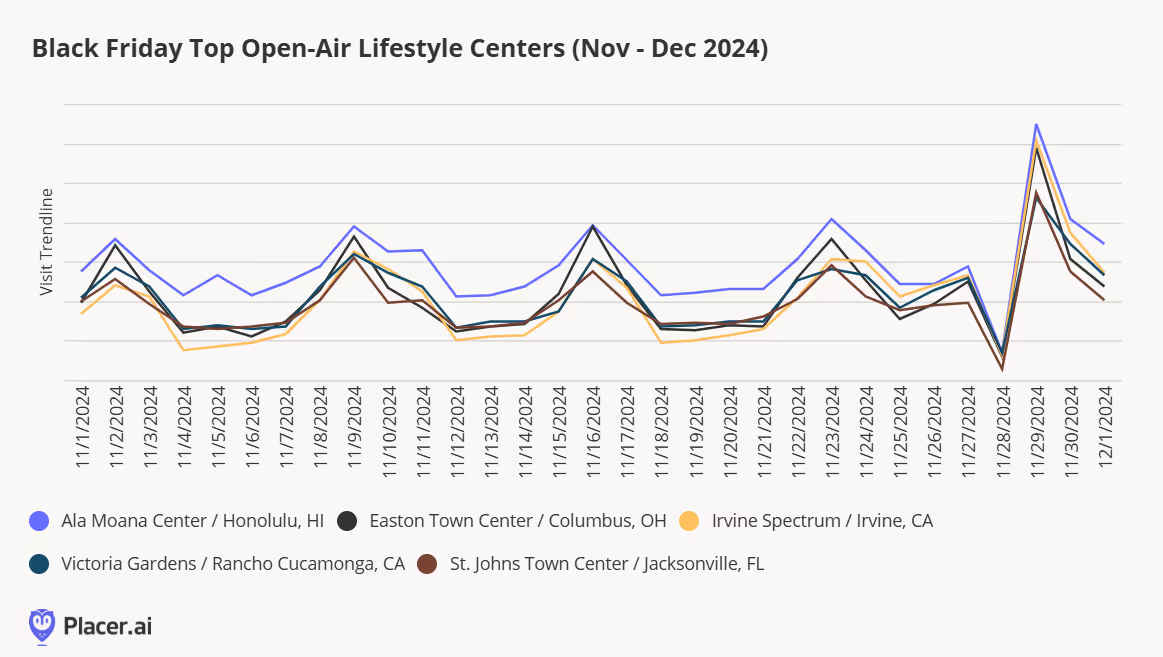
Indoor malls saw the highest total visits, followed by open-air lifestyle centers and outlet malls.
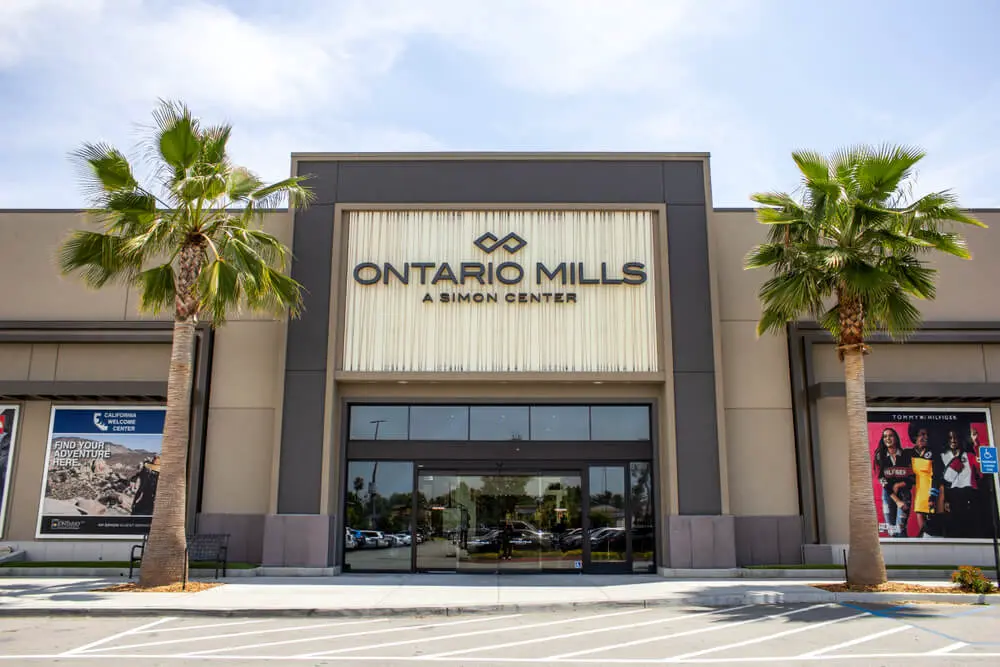
Deal-hunting was a major theme this year, drawing shoppers in large numbers to outlet malls. For most of November, Arundel Mills in Hanover, MD, led in total visits. However, when it came to post-Thanksgiving steps and walking off turkey-induced calories, Ontario Mills in Southern California claimed the top spot. Sawgrass Mills in Florida secured third place, while the Assyrian fortress-themed Citadel Outlets in Los Angeles landed fourth—complete with a massive Black Friday traffic jam on the 5 Freeway. Gurnee Mills in Illinois rounded out the top five for national outlet mall traffic.
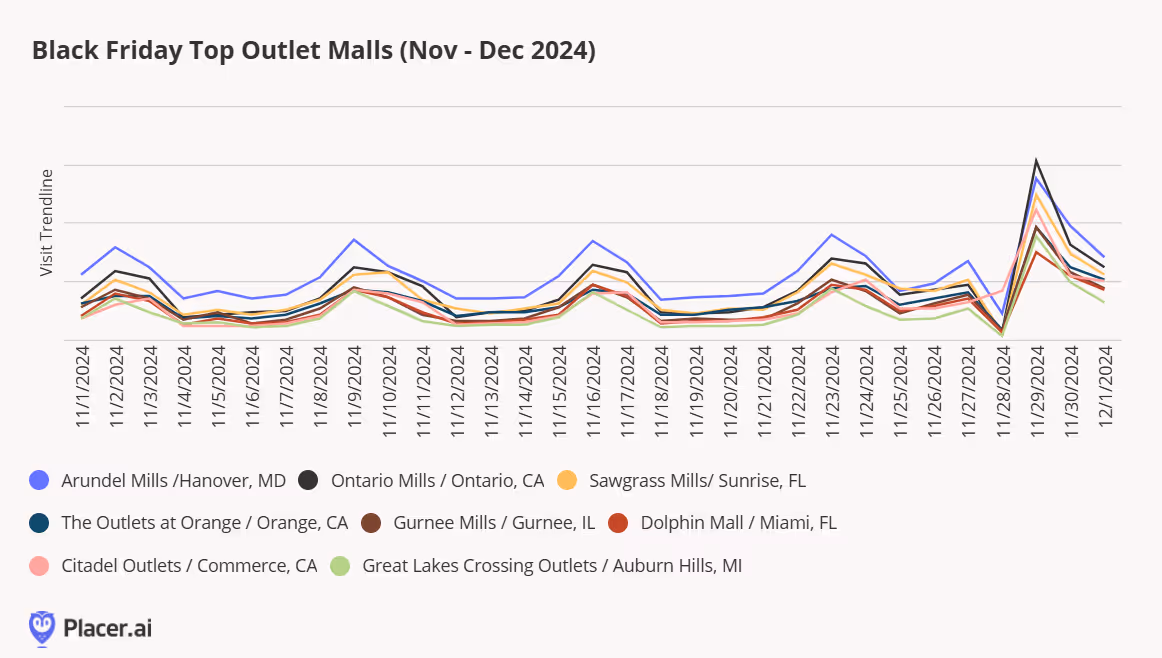
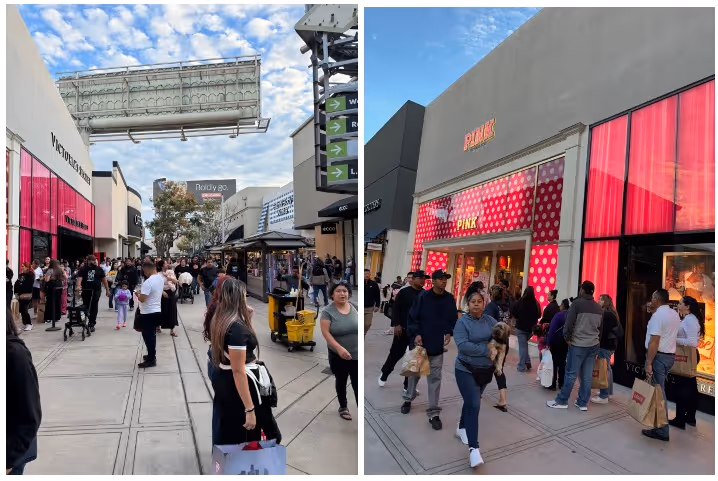
We watched Moana 2 on Black Friday at the Outlets of Orange, the sixth most-visited outlet mall in America. Judging by the unbelievably crowded parking lot, it might be worth checking the Placer app for historical traffic comparisons. The silver lining to the 25-minute parking hunt? With half an hour of previews now the norm, no one missed a moment of the movie! The mall was bustling, with lines stretching around the corners of some stores. Crowds filled the main thoroughfare, and eager shoppers formed long queues at popular spots like Victoria’s Secret and Pink.
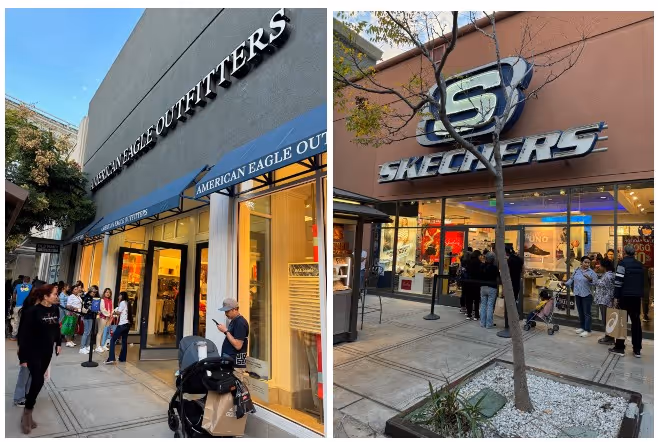
Shoppers at juniors' retailers like American Eagle needed a bit of patience, as did those heading to Skechers.
Great Lakes Crossing Outlets in Michigan secured seventh place, while Dolphin Mall in Miami, FL rounded out the top eight.
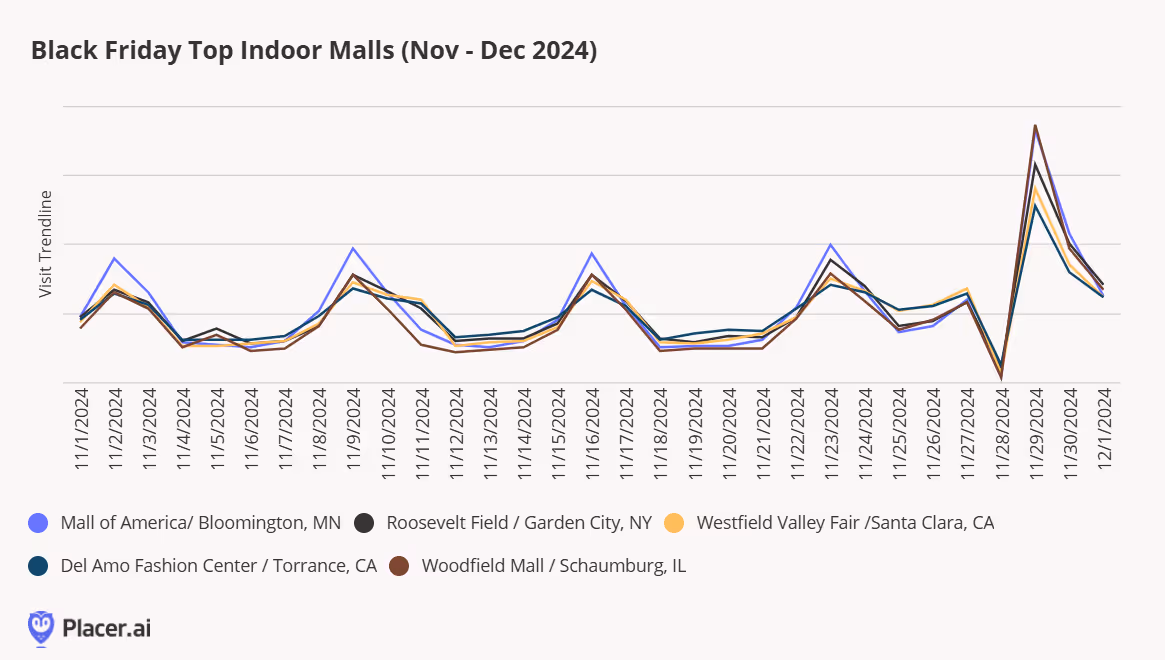
From November 1 to December 1, the top five most-visited indoor malls were Mall of America in Minnesota, Roosevelt Field in New York, Westfield Valley Fair in California, Del Amo Fashion Center in California, and Woodfield Mall in Illinois. However, Black Friday brought a shift in rankings. Woodfield Mall claimed the top spot for Black Friday visits, with the other malls each moving down one position compared to their overall November visitation rankings.
From November 1 to December 1, Ala Moana Center in Hawaii consistently held its #1 spot among open-air shopping centers, including on Black Friday. If you're enjoying the aloha spirit this holiday season, don’t miss unique Hawaiian stores like Honolulu Cookie Co., Island Slipper, and Malie Organics. The rankings saw some shifts on Black Friday, with Irvine Spectrum climbing from third place throughout November to the #2 spot. Easton Town Center secured third place, while St. Johns Town Center and Victoria Gardens rounded out the fourth and fifth spots, respectively, on the busiest shopping day of the year.
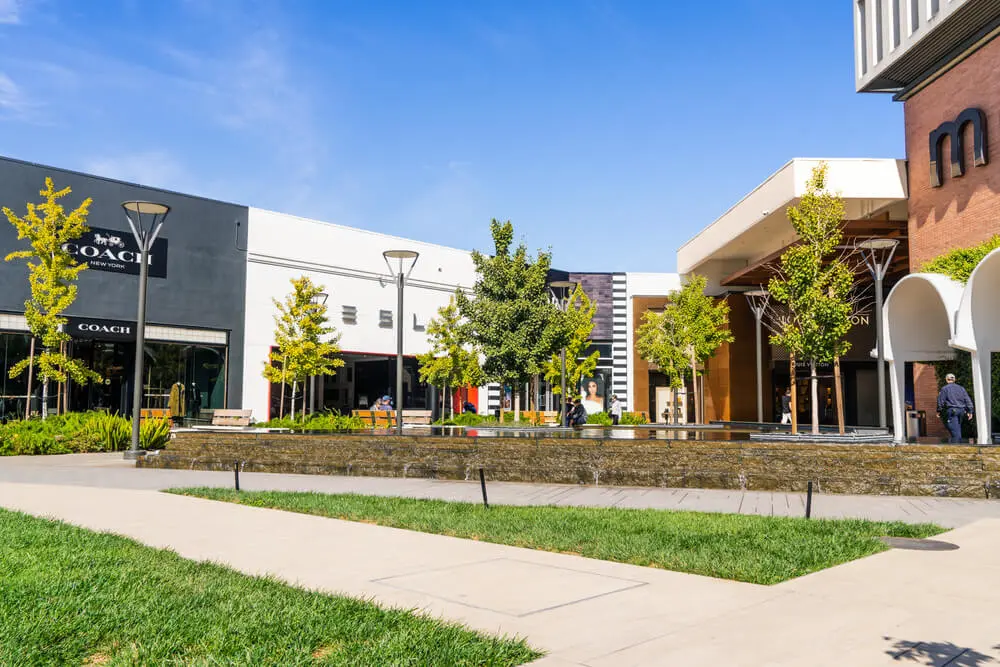
With the rise of hybrid and remote work, we’ve observed a notable shift in everyday consumer behaviors, particularly around fitness, shopping, running errands, and grabbing takeout. Without the need to commute on certain days, it’s easier for consumers to squeeze in a workout or make a quick trip to a store. Local outdoor shopping centers have become prime beneficiaries of this new “pop-in, pop-out” behavior. Here, we explore some of the brands poised to thrive in this evolving landscape.
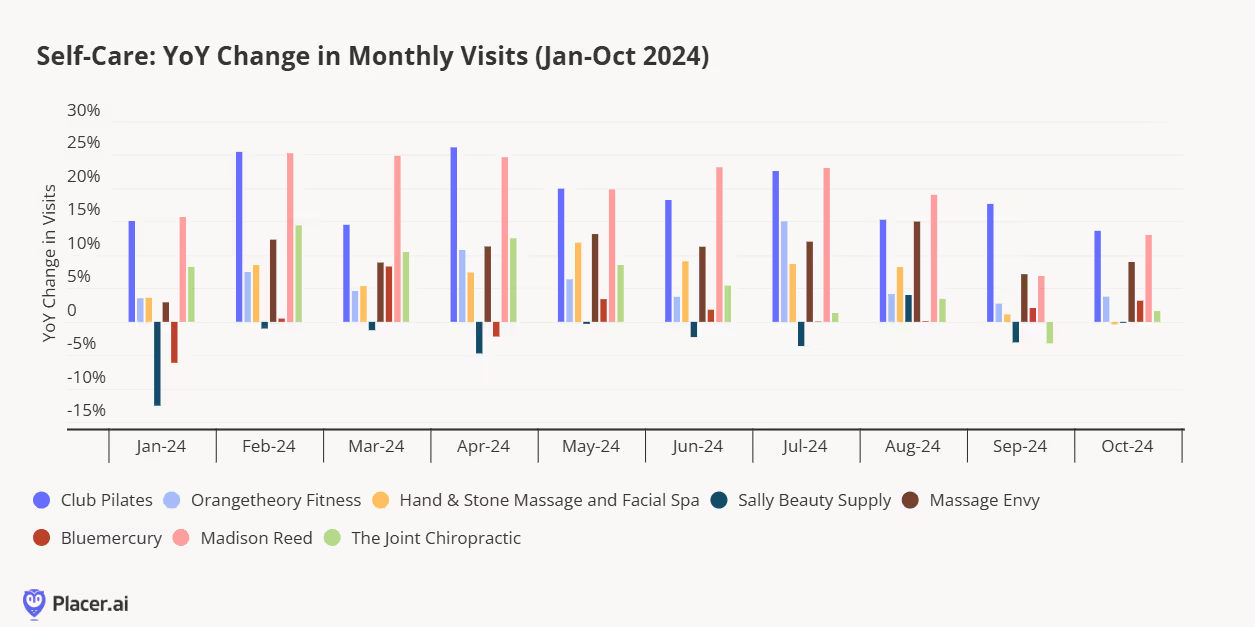
At the start of this year, we predicted that the beauty category boom we witnessed last year would persist, with wellness and self-care becoming integral parts of that definition. For many, self-care includes a good workout, whether low-impact or high-intensity. We've previously highlighted fitness trends, with brands like Club Pilates and Orangetheory Fitness continuing to demonstrate year-over-year growth. A perfect post-workout activity might include a massage or chiropractic session to ease sore muscles or restore alignment—services that have driven increased traffic for brands like Massage Envy and Joint Chiropractic. Another standout is Madison Reed, which offers "salon results without salon cost or time" and continues to expand its footprint.
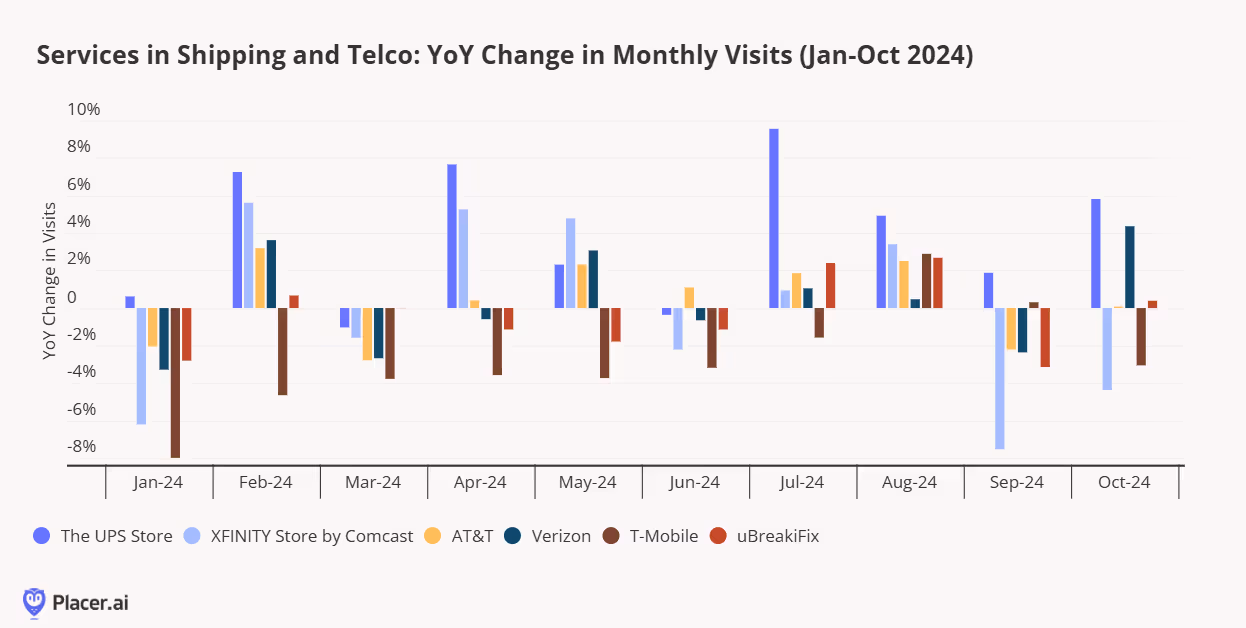
The next group of brands stands out for their ubiquity—you’re likely to find one or more of these stores in any local outdoor shopping center. UPS is indispensable for shipping and returning items, serving as a go-to for everyday logistics. Meanwhile, telecommunications and internet service providers like AT&T, Verizon, T-Mobile, and Xfinity maintain a steady customer base, driven by the regular upgrade cycle for cell phones and service plans.
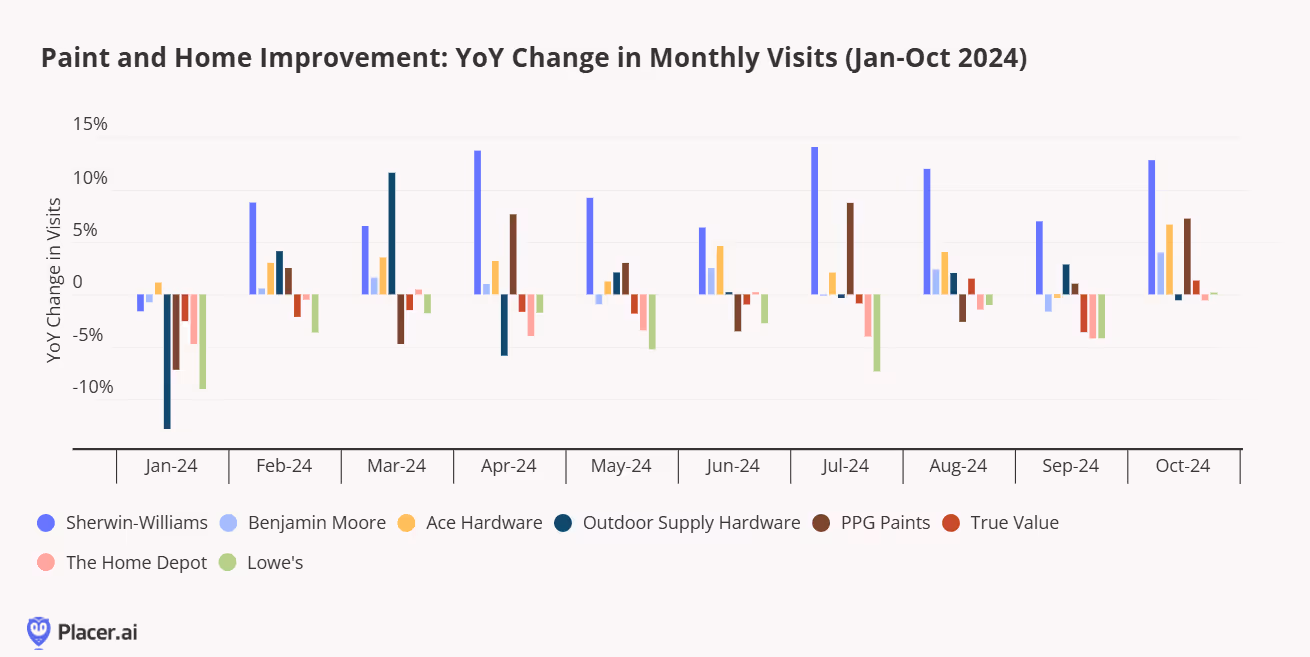
Another home improvement and furnishings replacement cycle may be upon us. Pandemic-driven nesting behaviors accelerated demand in previous years, but now, many consumers are cautiously approaching this phase. Instead of investing in big-ticket items like dining or living room furniture, there’s growing enthusiasm for budget-friendly updates, such as applying a fresh coat of paint. Sherwin-Williams stands out as a key player, experiencing increased foot traffic. This rise in paint store visits could signal a positive trend for future investments in home improvement, redecorating, and refurnishing.
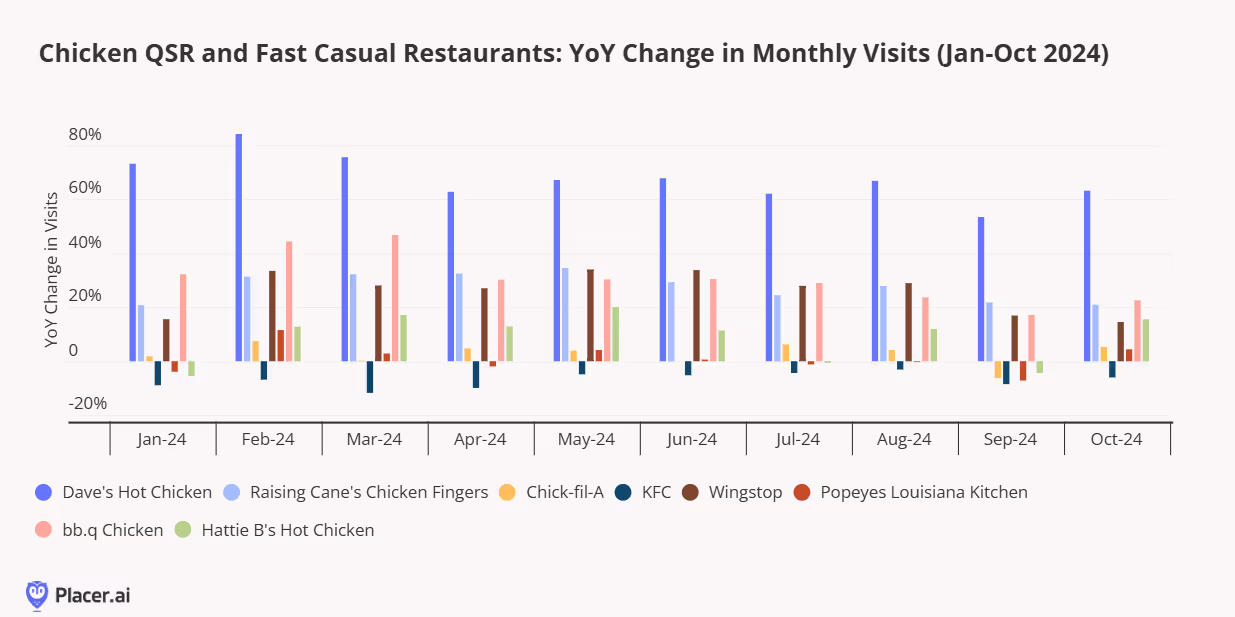
Next, we have some tasty additions perfect for local outdoor shopping centers. Americans’ love affair with chicken shows no signs of slowing down. Dave’s Hot Chicken has developed a cult following for its juicy, flavorful chicken, while Raising Cane’s draws loyal fans for its irresistible tenders and signature sauce. Bb.q Chicken offers a unique twist, boasting over a dozen wing flavors, including Caribbean Spice, Hot Mala, and Cheesling cheese dust.

While Boston trails both the New York City and Nationwide Office Building Index in return-to-office rates, one standout related to office activity is the Newbury Street location of the Dutch brand Suitsupply. Visitation to this location saw steady growth from February to August this year.


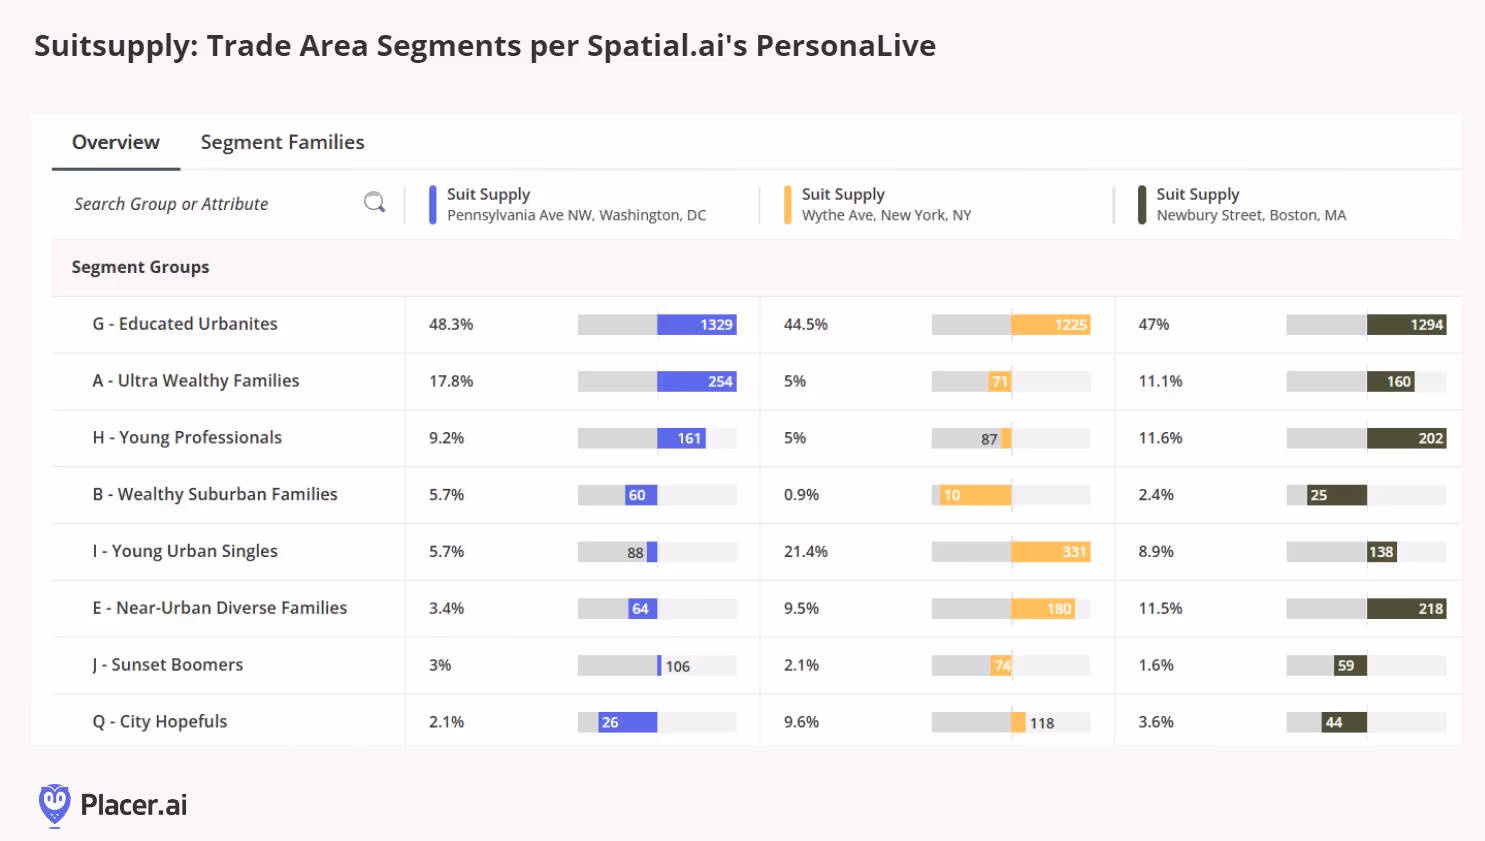
When examining the three East Coast cities in the chart—Washington, D.C., New York, and Boston—Educated Urbanites make up nearly half of Suitsupply's trade area, according to Spatial.ai’s PersonaLive data. In Boston specifically, there are also high indices for Near Urban Diverse Families and Young Professionals.
Both the Newbury St and Washington, DC Suitsupply locations saw the greatest gains compared to the prior year.

What might explain the gains in Boston? We have a few theories. First, Boston is a city where nearly a quarter of the population consists of students. The steady growth at the Newbury Street location from February to August could reflect students preparing for spring interviews, purchasing suits for summer internships, and later for weddings in late summer and early fall. Notably, a previous Anchor article highlighted that fall has become the most popular time of year for weddings. Additionally, the strong cohort of students and young professionals in their 20s and 30s may find the office environment particularly beneficial for camaraderie and mentorship. This group is also more likely to seek out—or at least be less resistant to—returning to the office compared to millennials and Gen X.
On a lighter note, there could be something lucky about this store, as it was the 100th location opened by the Amsterdam-based brand. From a quantitative perspective, year-over-year traffic to Newbury Street has increased over the past six months, with notable growth in June and August.

The importance of visual merchandising and the customer experience cannot be overlooked. A unique feature of Suitsupply is its in-store tailoring, often showcased prominently in the front window. This not only provides engaging "retail theater" but also reassures customers of the craftsmanship behind their suits. Some shoppers have even been drawn into the store out of curiosity sparked by seeing an artisan at work. Online reviews for the Boston location highlight customers' appreciation for attentive service, reasonable prices, meticulous attention to detail, and outstanding tailoring.
While consumer confidence appears optimistic heading into the holidays, and businesses are feeling more assured now that the election is over, thrifting continues to benefit from tailwinds driven by last year's inflationary pressures, the shift toward sustainability, and Gen Z’s desire for unique items.
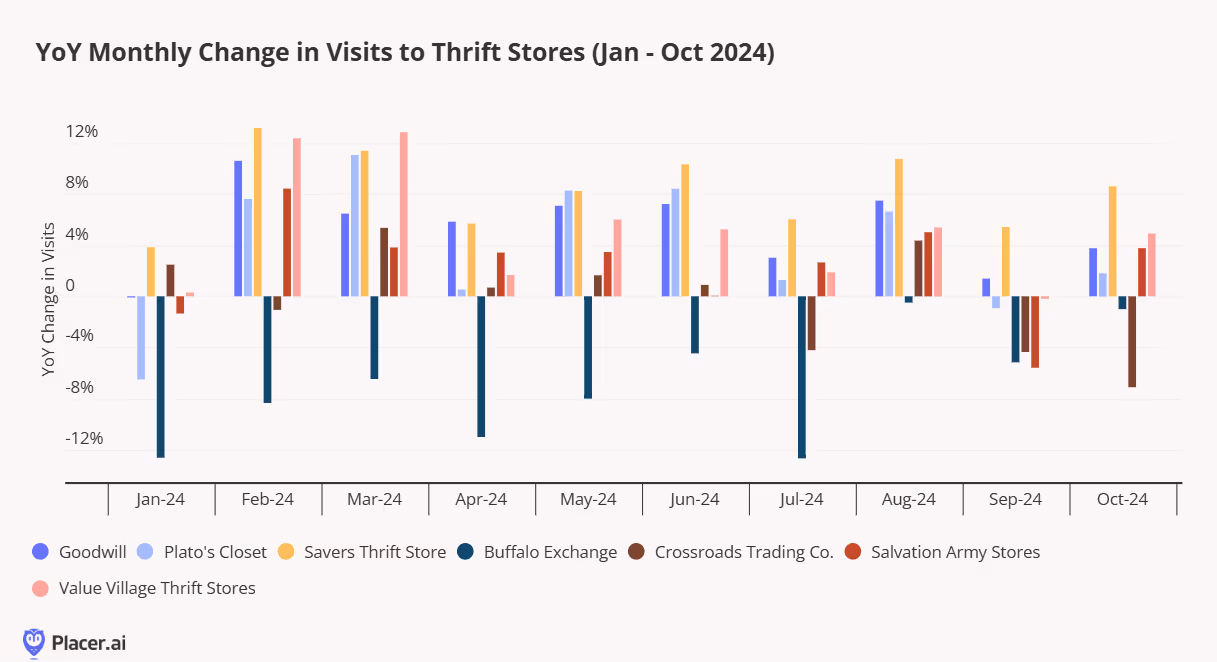
We analyzed year-over-year traffic for well-established chains like Goodwill and Salvation Army, as well as for smaller chains like Buffalo Exchange and Crossroads Trading Co. Among these, Savers Thrift Store has experienced the highest growth rate in recent months, with Goodwill also showing consistent increases compared to last year.
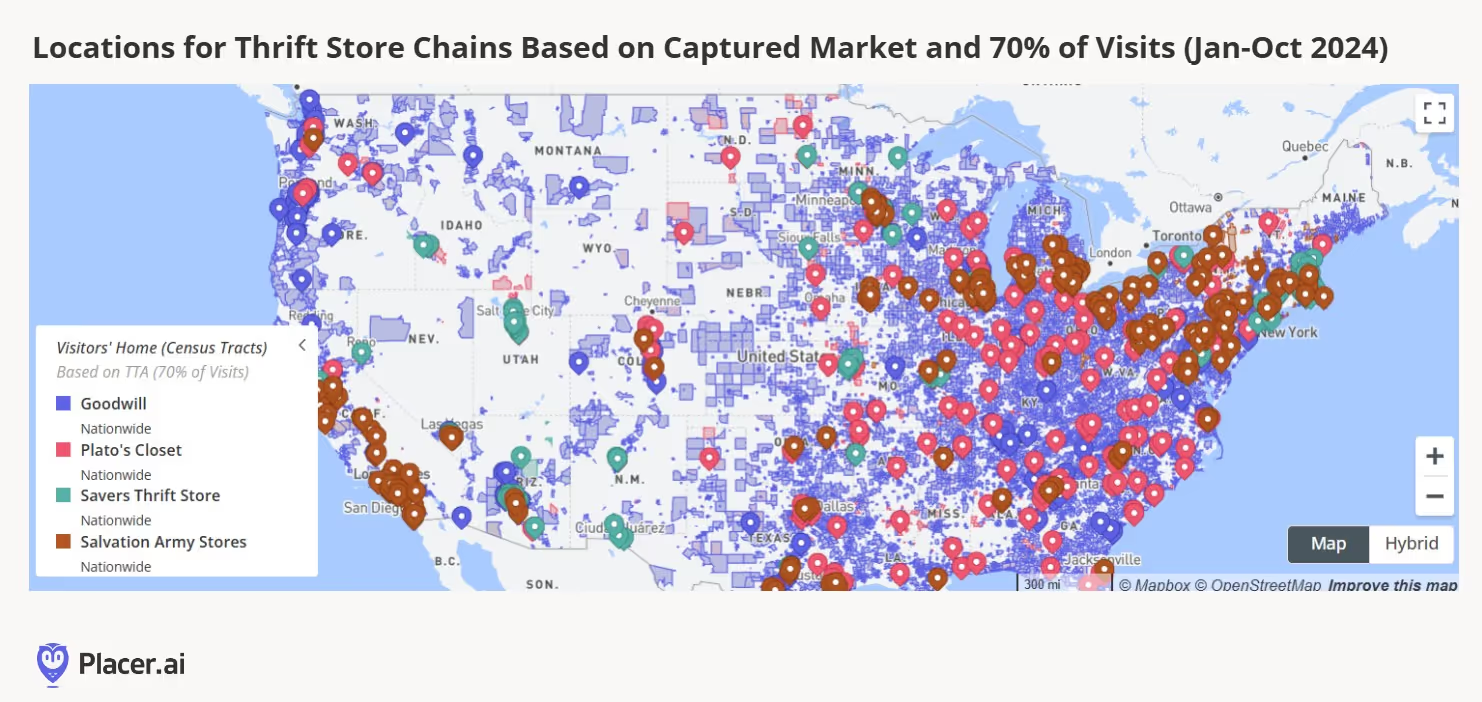
The thrift store footprint is quite strong nationwide, with a concentration of stores in the eastern half of the country and along the West Coast.
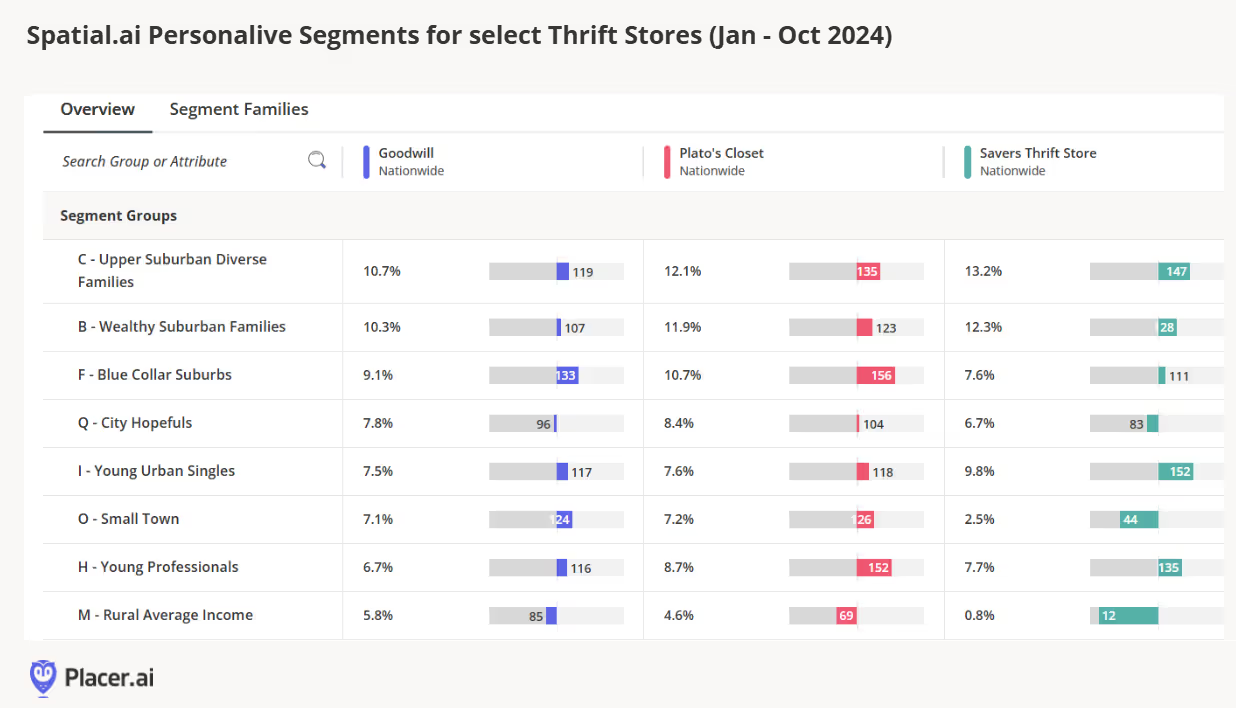
Thrifting is no longer just for lower-income households. In a sign of its upmarket appeal, over 1 in 10 of thrift store captured trade areas are now the "Upper Suburban Diverse Families" segment, and another 1 in 10 are from "Wealthy Suburban Families" according to PersonaLive customer segments. The chart below filters for visitors with a dwell time of at least 10 minutes, indicating that these segments aren’t merely dropping off donations—they’re sticking around to treasure hunt. The thrill of finding a hidden gem has been widely shared on social media platforms like TikTok, where one lucky shopper recently discovered a $6,000 couture wedding dress for the unbelievable price of $25 at Goodwill.
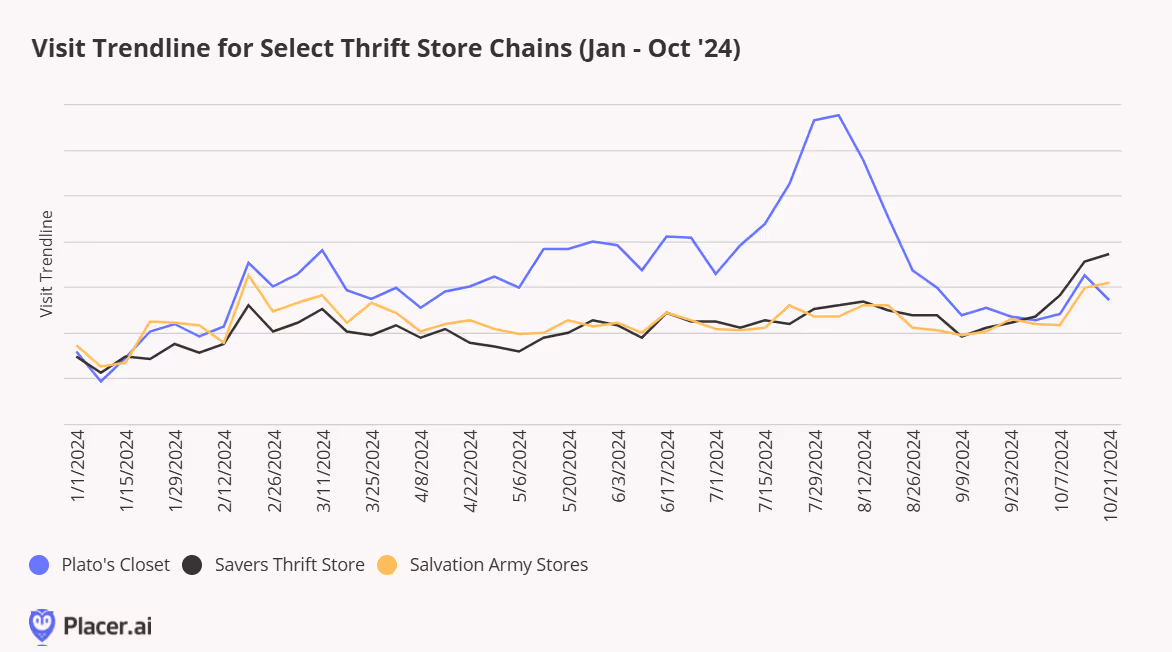
While Goodwill is undoubtedly the largest player in this field, with roughly ten times the visits of its nearest competitor, a substantial share of visits also goes to Plato’s Closet (with over 400 stores tracked by Placer), Salvation Army Stores (400+ tracked by Placer), and Savers Thrift Stores (100+ tracked by Placer). Interestingly, although Savers has just a quarter of the number of stores, its yearly visits nearly match those of Plato’s Closet and Salvation Army Stores during certain months of the year.
Plato’s Closet sees a notable spike in late July and early August, aligning with back-to-school shopping season. With its focus on teens and young adults and an emphasis on popular and fast-fashion brands, it’s no surprise that this chain resonates strongly with its youthful audience.
This past season, one of the major trends has been a love for all things '90s. Popular items include handkerchief hems, baby tees, crop tops, straight jeans, mom jeans, flared jeans (essentially anything but skinny jeans), and, of course, the essential graphic tee. Thrifters are on the hunt for that perfect vintage piece—something unique to wear to a concert or party and, most importantly, to showcase on social media.

Introduction
2024 has been another challenging year for retailers. Still-high prices and an uncertain economic climate led many shoppers to trade down and cut back on unnecessary indulgences. Value took center stage, as cautious consumers sought to stretch their dollars as far as possible.
But price wasn’t the only factor driving consumer behavior in 2024. This past year saw the rise of a variety of retail and dining trends, some seemingly at odds with one another. Shoppers curbed discretionary spending, but made room in their budgets for “essential non-essentials” like gym memberships and other wellness offerings. Consumers placed a high premium on speed and convenience, while at the same time demonstrating a willingness to go out of their way for quality or value finds. And even amidst concern about the economy, shoppers were ready to pony up for specialty items, legacy brands, and fun experiences – as long as they didn’t break the bank.
How did these currents – likely to continue shaping the retail landscape into 2025 – impact leading brands and categories? We dove into the data to find out.
Conventional Value Reaching Its Ceiling
Bifurcation has emerged as a foundational principle in retail over the past few years: Consumers are increasingly gravitating toward either luxury or value offerings and away from the ‘middle.’ Add extended economic uncertainty along with rapid expansions and product diversification from top value-oriented retailers, and you have an explosion of visits in the value lane.
But we are seeing a ceiling to that growth – especially in the discount & dollar store space. Throughout 2023 and the first part of 2024, visits to discount & dollar stores increased steadily. But no category can sustain uninterrupted visit growth forever. Since April 2024, year–over-year (YoY) foot traffic to the segment has begun to slow, with September 2024 showing just a modest 0.8% YoY visit increase.
Discount & dollar stores, which attract lower-income shoppers compared to both grocery stores and superstores, have also begun lagging behind these segments in visit-per-location growth. In Q3, the average number of visits to each discount and dollar store location remained essentially flat compared to 2023 (+0.2%), while visits per location to superstores and grocery stores grew by 2.8% and 1.0%, respectively. As 2024 draws to a close, it is the latter segments, which appeal to shoppers with incomes closer to the nationwide median of $76.1K, which are seeing better YoY performance.
The deceleration doesn’t mean that discount retailers are facing existential risk – discount & dollar stores are still extremely strong and well-positioned with focused offerings that resonate with consumers. The visitation data does suggest, however, that future growth may need to focus on initiatives other large-scale fleet expansions. Some of these efforts will involve moving upmarket (see pOpShelf), some will focus on fleet optimization, and others may include new offerings and channels.
Return of the middle anyone?
Innovative and Disruptive Value Shake Up Retail and Dining
Still, in an environment where consumers have been facing the compounded effects of rising prices, value remains paramount for many shoppers. And brands that have found ways to let customers have their cake and eat it too – enjoy specialty offerings and elevated experiences without breaking the bank – have emerged as major visit winners this year.
Trader Joe’s Drives Visits With Private Label Innovation
Trader Joe’s, in particular, has stood out as one of the leading retail brands for innovative value in 2024, a trend that is expected to continue into 2025.
Trader Joe’s dedicated fan base is positively addicted to the chain’s broad range of high-quality specialty items. But by maintaining a much higher private label mix than most grocers – approximately 80%, compared to an industry average of 25% to 30% – the retailer is also able to keep its pricing competitive. Trader Joe’s cultivates consumer excitement by constantly innovating its product line – there are even websites dedicated to showcasing the chain’s new offerings each season. In turn, Trader Joe’s enjoys much higher visits per square foot than the rest of the grocery category: Over the past twelve months, Trader Joe’s drew a median 56 visits per square foot – compared to 23 for H-E-B, the second-strongest performer.
Chili’s Beats QSR at its Own Game
Casual dining chain Chili’s has also been a standout on the disruptive value front this past year – offering consumers a full-service dining experience at a quick-service price point.
Chili’s launched its Big Smasher Burger on April 29th, 2024, adding the item to its popular ‘3 for Me’ offering, which includes an appetizer, entrée, and drink for just $10.99 – lower than than the average ticket at many quick-service restaurant chains. The innovative promotion, which has been further expanded since, continues to drive impressive visitation trends. With food-away-from-home inflation continuing to decelerate, this strategy of offering deep discounts is likely to continue to be a key story in 2025.
The Convenience Myth
Convenience is king, right?
Well, probably not. If convenience truly were king, visitors would orient themselves to making fewer, longer visits to retailers – to minimize the inconvenience of frequent grocery trips and spend less time on the road. But analyzing the data suggests that, while consumers may want to save time, it is not always their chief concern.
Looking at the superstore and grocery segments (among others) reveals that the proportion of visitors spending under 30 minutes at the grocery store is actually increasing – from 73.3% in Q3 2019 to 76.6% in Q3 2024. This indicates that shoppers are increasingly willing to make shorter trips to the store to pick up just a few items.
At the same time, more consumers than ever are willing to travel farther to visit specialty grocery chains in the search of specific products that make the visit worthwhile.
Cross visitation between chains is also increasing – suggesting that shoppers are willing to make multiple trips to find the products they want – at the right price point. Between Q3 2023 and Q3 2024, the share of traditional grocery store visitors who also visited a Costco at least three times during the quarter grew across chains.
Does this mean convenience doesn’t matter? Of course not. Does it indicate that value, quality and a love of specific products are becoming just as, if not more, important to shoppers? Yes.
The implications here are very significant. If consumers are willing to go out of their way for the right products at the right price points – even at the expense of convenience – then the retailers able to leverage these ‘visit drivers’ will be best positioned to grow their reach considerably. The willingness of consumers to forego convenience considerations when the incentives are right also reinforces the ever-growing importance of the in-store experience.
So while convenience may still be within the royal family, the role of king is up for grabs.
Serving Diners Quicker With Automatization
Chipotle Draws Crowds With Autocado
Convenience may not be everything, but the drive for quicker service has emerged as more important than ever in the restaurant space. Diners want their fast food… well, as fast as possible. And to meet this demand, quick-service restaurants (QSRs) and fast-casual chains have been integrating more technology into their operations. Chipotle has been a leader in this regard, unveiling the “Autocado” robot at a Huntington Beach, California location last month. The robot can peel, pit, and chop avocados in record time, a major benefit for the Tex-Mex chain.
And the Autocado seems to be paying off. The Huntington Beach location drew 10.0% more visits compared to the average Chipotle location in the Los Angeles-Long Beach-Anaheim metro area in Q3 2024. Visitors are visiting more frequently and getting their food more quickly – 43.9% of visits at this location lasted 10 minutes or less, compared to 37.5% at other stores in the CBSA.
Are diners flocking to this Chipotle location to watch the future of avocado chopping in action, or are they enticed by shorter wait times? Time will tell. But with workers able to focus on other aspects of food preparation and customer service, the innovation appears to be resonating with diners.
McDonald’s Leans into Automation in Texas
McDonald’s, too, has leaned into new technologies to streamline its service. The chain debuted its first (almost) fully automated, takeaway-only restaurant in White Settlement, TX in 2022 – where orders are placed at kiosks or on app, and then delivered to customers by robots. (The food is still prepared by humans.) Unsurprisingly, the restaurant drives faster visits than other local McDonald’s locations – in Q3 2023, 79.7% of visits to the chain lasted less than 10 minutes, compared to 68.5% for other McDonald’s in the Dallas-Fort Worth-Arlington, TX CBSA. But crucially, the automated location is also busier than other area McDonald’s, garnering 16.8% more visits in Q3 than the chain’s CBSA-wide average. And the location draws a higher share of late-night visits than other area McDonald’s – customers on the hunt for a late-night snack might be drawn to a restaurant that offers quick, interaction-free service.
Evolving Retail Formats - Finding the Right Fit
Changing store formats is another key trend shaping retail in 2024. Whether by reducing box sizes to cut costs, make stores more accessible, or serve smaller growth markets – or by going big with one-stop shops, retailers are reimagining store design. And the moves are resonating with consumers, driving visits while at the same improving efficiency.
Macy’s Draws Local Weekday Visitors With Small-Format Stores
Macy’s, Inc. is one retailer that is leading the small-format charge this year. In February 2024, Macy’s announced its “Bold New Chapter” – a turnaround plan including the downsizing of its traditional eponymous department store fleet and a pivot towards smaller-format Macy’s locations. Macy’s has also continued to expand its highly-curated, small-format Bloomie’s concept, which features a mix of established and trendy pop-up brands tailored to local preferences.
And the data shows that this shift towards small format may be helping Macy’s drive visits with more accessible and targeted offerings that consumers can enjoy as they go about their daily routines: In Q3 2024, Macy’s small-format stores drew a higher share of weekday visitors and of local customers (i.e. those coming from less than seven miles away) than Macy’s traditional stores.
Harbor Freight Tools and Ace Hardware Serve Smaller Growth Markets With Less Square Footage
Small-format stores are also making inroads in the home improvement category. The past few years have seen consumers across the U.S. migrating to smaller suburban and rural markets – and retailers like Harbor Freight Tools and Ace Hardware are harnessing their small-format advantage to accommodate these customers while keeping costs low.
Harbor Freight tools and Ace Hardware’s trade areas have a high degree of overlap with some of the highest growth markets in the U.S., many of which have populations under 200K. And while it can be difficult to justify opening a Home Depot or Lowe’s in these hubs – both chains average more than 100,000 square feet per store – Harbor Freight Tools and Ace Hardware’s smaller boxes, generally under 20,000 square feet, are a perfect fit.
This has allowed both chains to tap into the smaller markets which are attracting growing shares of the population. And so while Home Depot and Lowe’s have seen moderate visits declines on a YoY basis, Harbor Freight and Ace Hardware have seen consistent YoY visit boosts since Q1 2024 – outperforming the wider category since early 2023.
Hy-Vee Bucks the Trend by Going Big
Are smaller stores a better bet across the board? At the end of the day, the success of smaller-format stores depends largely on the category. For retail segments that have seen visit trends slow since the pandemic – home furnishings and consumer electronics, for example – smaller-format stores offer brands a more economical way to serve their customers. Retailers have also used smaller-format stores to better curate their merchandise assortments for their most loyal customers, helping to drive improved visit frequency.
That said, a handful of retailers, such as Hy-Vee, have recently bucked the trend of smaller-format stores. These large-format stores are often designed as destination locations – Hy-Vee’s larger-format locations usually offer a full suite of amenities beyond groceries, such as a food hall, eyewear kiosk, beauty department, and candy shop. Rather than focusing on smaller markets, these stores aim to attract visitors from surrounding areas.
Visit data for Hy-Vee’s large-format store in Gretna, Nebraska indicates that this location sees a higher percentage of weekend visits than other area locations – 37.7% compared to 33.1% for the chain’s Omaha CBSA average – as well as more visits lasting over 30 minutes (32.9% compared to 21.9% for the metro area as a whole). For these shoppers, large-format, one-stop shops offer a convenient – and perhaps more exciting – alternative to traditionally sized grocery stores. The success of the large-format stores is another sign that though convenience isn’t everything in 2024, it certainly resonates – especially when paired with added-value offerings.
A Resurgence of Legacy Brands
Many retail brands have entrenched themselves in American culture and become an extension of consumers' identities. And while some of these previously ubiquitous brands have disappeared over the years as the retail industry evolved, others have transformed to keep pace with changing consumer needs – and some have even come back from the brink of extinction. And the quest for value notwithstanding, 2024 has also seen the resurgence of many of these (decidedly non-off-price) legacy brands.
In apparel specifically, Gap and Abercrombie & Fitch – two brands that dominated the cultural zeitgeist of the 1990s and early 2000s before seeing their popularity decline somewhat in the late aughts and 2010s – may be staging a comeback. Bed Bath & Beyond, a leader in the home goods category, is also making a play at returning to physical retail through partnerships.
Anthropologie, another legacy player in women’s fashion and home goods, is also on the rise. Anthropologie’s distinctive aesthetic resonates deeply with consumers – especially women millennials aged 30 to 45. And by capturing the hearts of its customers, the retailer stands as a beacon for retailers that can hedge against promotional activity and still drive foot traffic growth.
And visits to the chain have been rising steadily. In Q4 2023, the chain experienced a bigger holiday season foot traffic spike than pre-pandemic, drawing more overall visits than in Q4 2019. And in Q3 2024, visits were higher than in Q3 2023.
Meeting the Evolving Needs of Millennials
And speaking of the 35 to 40 set – the generation that all retailers are courting? Millennials. Does that sound familiar? Yes, because this is the same generational cohort that retailers tried to target a decade ago. As millennials have aged into the family-formation stage of life, their retail needs have evolved, and the industry is now primed to meet them.
Sam’s Club Draws Value-Conscious Singles and Starters
From the revival of nostalgic brands like the Limited Too launch at Kohl’s to warehouse clubs expanding memberships to younger consumers as they move to suburban and rural communities, there are myriad examples of retailers reaching out to this cohort. And Sam’s Club offers a prime example of this trend.
Over the past few years, millennials and Gen-Zers have emerged as major drivers of membership growth at Sam’s Club, drawn to the retailer’s value offerings and digital upgrades – like the club’s Scan & Go technology. Over the same period, Sam’s Club has grown the share of “Singles and Starters” households in its captured market from 6% above the national benchmark in Q3 2019 to 15% in Q3 2024. And with plans to involve customers in co-creating products for its private-label brand, Sam’s Club may continue to grow its market share among this value-conscious – but also discerning and optimistic – demographic.
Taco Bell Brings in Crowds With Value Nostalgia Menu
Millennials are also now old enough to wax nostalgic about their youth – and brands are paying attention. This summer, Taco Bell leaned into nostalgia with a promotion bringing back iconic menu items from the 60s, 70s, 80s, and 90s – all priced under $3. The promotion, which soft-launched at three Southern California locations in August, was so successful that the company is now offering the specials nationwide. The three locations that trialed the “Decades Menu” saw significant boosts in visits during the promotional period compared to their daily averages for August. And people came from far and wide to sample the offerings – with a higher proportion of visitors traveling over seven miles to reach the stores while the items were available.
What Lies Ahead?
Hot on the heels of a tumultuous 2023, 2024’s retail environment has certainly kept retailers on their toes. While embracing innovative value has helped some chains thrive, other previously ascendant value segments, including discount & dollar stores, may have reached their growth ceilings. Consumers clearly care about convenience – but are willing to make multiple grocery stops to find what they need. At the same time, legacy brands are plotting their comeback, while others are harnessing the power of nostalgia to drive millennials – and other consumers – through their doors.

